Performance evaluation on quality of Asian
e-government websites – an AHP approach
P.D.D. Dominic* and Handaru Jati
Department of Computer and Information Science, Universiti Teknologi Petronas,
31750, Tronoh, Perak, Malaysia Fax: +605 365 6180
E-mail: [email protected] E-mail: [email protected] E-mail: [email protected]
*Corresponding author
G. Kannabiran
Department of Management Studies, National Institute of Technology,
Tiruchirapalli – 620 015, Tamilnadu, India
Fax: +91 431 2500 133 E-mail: [email protected]
Abstract: The concept of website quality is consisting of many criteria: quality of service perspective, a user perspective, a content perspective or indeed a usability perspective. This research conducts some tests to measure the quality of e-government website of five Asian countries via web diagnostic tools online. We propose a methodology for determining and evaluate the best e-government sites based on many criteria of website quality. The approach has been implemented using analytical hierarchy process (AHP), the proposed model uses the AHP pairwise comparisons and the measure scale to generate the weights for the criteria which are much better and guarantee more fairly preference of criteria. Applying AHP approach for website evaluation has resulted in significant acceleration of implementation, raised the overall effectiveness with respect to the underlying methodology and ultimately enabled more efficient procedure. The result of this study confirmed that the e-government websites of Asian are neglecting performance and quality criteria.
Keywords: performance; e-government; quality; web diagnostic; analytical hierarchy process; AHP.
Reference to this paper should be made as follows: Dominic, P.D.D., Jati, H. and Kannabiran, G. (2010) ‘Performance evaluation on quality of Asian e-government websites – an AHP approach’, Int. J. Business Information Systems, Vol. 6, No. 2, pp.219–239.
Petronas, Malaysia. His fields of interest are operations management, KM and decisions support systems. He has published technical papers in international, national journals and conferences.
Handaru Jati obtained his MSc in Information Technology in 2005 and MBA during 2001 from Gadjah Mada University, Indonesia. Currently he is pursuing his Doctoral Degree from Universiti Teknologi Petronas in Computer and Information Science Department, Malaysia. Since 1999 he has held the post of a Lecturer in the Department of Electronics and Informatics Engineering in Yogyakarta State University, Indonesia (formerly Yogyakarta Vocational Education Institute). His fields of interest are software quality, image processing and e-learning evaluation. He has published technical papers in international and nationalconferences.
G. Kannabiran obtained his MSc in Operations Research in 1985, MBA and ME from Regional Engineering College, Tiruchirappalli, India during 1987 and 1992 respectively. He obtained his PhD in the area of information technology at Bharathidasan University, Tiruchirappalli, India. Since 2003 he has held the post of a Professor in the Department of Management Studies, National Institute of Technology, Tiruchirappalli, India. His fields of interest are information systems, e-business and supply chain management. He has published technical papers in international, national journals and conferences.
1 Introduction
Website quality is a new topic in the software quality. Web based application can be used and reached more users than non web based application. The importance of website creates a demand from the users for the quality and fast delivery, unfortunately the complexities of the websites and technology which support this application make testing and quality control more difficult to handle. Automation of the testing for website quality is a new chance and a new method. The question of website quality has been defined by many disciplines in three distinct ways:
• the information value of the content provided (library and information science) • the design of such a site (information systems and technology, media studies) • the usability of the interface (mediated communication).
amount of time. Thus, the challenge is to create a method that will guide the internet user to the same finding as the WQET without needed a lot of time.
There are many scope of quality, and each measure will pertain to a particular website in varying degrees. Here are some of them: first factor is time, a credible site should be updated frequently. The information about latest update also should be included on the homepage. However, if the information has not been updated currently, the visitor could easily know that perhaps the site manager does really bother to update the site. Second factor is structural, all of the parts of the website hold together and all links inside and outside the website should work well. Broken links on the webpage also are another factor that always downgrades the quality of website. Each page usually has references or links or connections to other pages. These may be internal or external website. Users expect each link to be valid, meaning that it leads successfully to the intended page or other resource. In the year of 2003, it was discovered that about one link out of every 200 disappeared each week from the internet (McCowen et al., 2005).
The third factor is content; number of the links, or link popularity is one of the off page factors that search engines are looking to determine the value of the webpage. Most of the search engines will need a website that have at least two links pointing to their site before they will place it to their index, and the idea of this link popularity is that to increase the link popularity of a website, this website must have large amount of high quality content. Number of links to website improves access growth and helps to generate traffic (Page et al., 1998). Page-rank is a link analysis algorithm used by the Google internet search engine that assigns a numerical weighting to each element of a hyperlinked set of documents, such as the World Wide Web, with the purpose of measuring its relative importance within the set.
PR(A) = (1 – d) + d(PR(t1) / C(t1) + ... + PR(tn) / C(tn)) PR = page rank
t1 – tn = are pages linking to page A
C = is the number of outbound links that a page has d = is a damping factor, usually set to 0.85, 0 ≤d≤ 1.
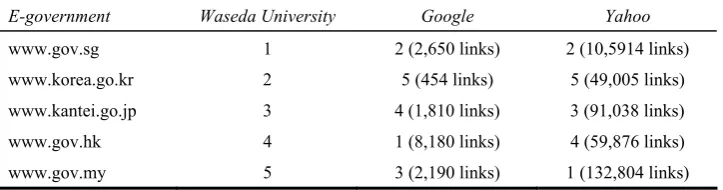
Table 1 shows that in terms of ranking, link popularity of the e-government website are different with the result of the Waseda University World E-government ranking in 2008. Based on Waseda University World E-government, the rankings are Singapore, Korean, Japan, Hong Kong and Malaysia, while based on link popularity using Google search engine the sequence are: Hong Kong, Singapore, Malaysia, Japan, and the last ranking is Korea. Similar result is occurred by using Yahoo search engine with Malaysia rank as number one, followed by Singapore, Japan, Hong Kong, and Korea as the last ranking.
Table 1 Ranking of the e-government websites based on search engine
E-government Waseda University Google Yahoo
www.gov.sg 1 2 (2,650 links) 2 (10,5914 links)
www.korea.go.kr 2 5 (454 links) 5 (49,005 links)
www.kantei.go.jp 3 4 (1,810 links) 3 (91,038 links)
www.gov.hk 4 1 (8,180 links) 4 (59,876 links)
www.gov.my 5 3 (2,190 links) 1 (132,804 links)
The last criterion is performance. Technology continues to make an important impact in service industries and fundamentally shapes how services are delivered (Durkin, 2007). There are so many factors influence the performance of the web and most of it is outside the control of website designer. Download time of the website will be determined by webpage design, web server, hardware of the client, software configuration and characteristics of the internet router which connect users and the websites. One of the research findings mention that website which has slow download time is less attractive compare to website with faster download time (Ramsay et al., 1998). In the recent time the average time of the connection speed is 5 kbps (kilobytes per second). This facts give an implication that one webpage with 40 kb page size will be downloaded during eight seconds. This matter in accordance with the ‘eight second rule’, this eight-second is a normal time for loading webpage and will not be tolerable from the user. This result are supported by many research result mentioned that the mean of tolerable download time in the user side is 8.57 with standard deviation of 5.9 seconds (Bouch et al., 2000). Providing information related with waiting time is very important for user. For the long download time, it is better to provide information about how many percentage of the webpage is already downloaded and how many hours are needed to complete this task. Another important aspect is information fit-to-task, information presented on a website is accurate and appropriate for the task at hand (Loiacono et al., 2007).
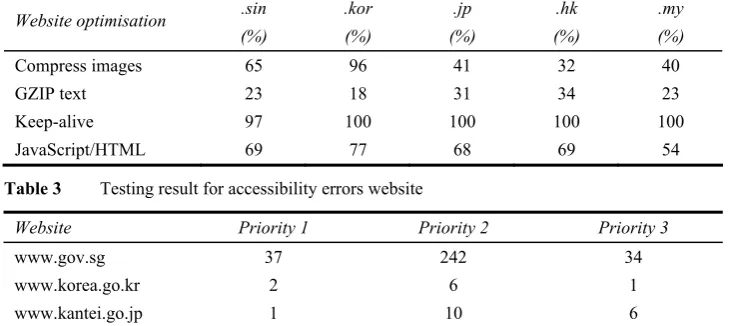
is used for all objects that are from a domain that serves more than one object for the page, and only Singapore has 97% optimisation, while other websites can reach 100%. The last indicator is HTML and JavaScript coding, and the rank result for this category are Korea, Singapore, Hong Kong, Japan, and followed by Malaysia.
Table 2 Testing result for e-government websites optimisation based on criteria
.sin .kor .jp .hk .my Website optimisation
(%) (%) (%) (%) (%)
Compress images 65 96 41 32 40
GZIP text 23 18 31 34 23
Keep-alive 97 100 100 100 100
JavaScript/HTML 69 77 68 69 54
Table 3 Testing result for accessibility errors website
Website Priority 1 Priority 2 Priority 3
www.gov.sg 37 242 34
www.korea.go.kr 2 6 1
www.kantei.go.jp 1 10 6
www.gov.hk 0 2 1
www.gov.my 13 246 47
2 Literature review
2.1 Website evaluation studies
The website evaluation can be approached from users, website designer/administrator or both together (Sayar and Wolfe, 2007). From the user’s perspective on the website evaluation, most studies focus on the factors for successful websites. These researches concentrate on the development of a website evaluation tool. These studies search for design and content elements of a successful website using the exploratory study. The main areas for the website quality evaluation are: function, usability, efficiency and reliability (Olsina et al., 2001). Website quality evaluation method (QEM) for six university sites from different countries was tested using this factor (Olsina et al., 2001). Website architecture is classified into content and design (Huizingh, 2000), and each category is specified into evaluation criteria according to the characteristics and perception of a website. They test the framework with websites in Yahoo and Dutch yellow page and summarise the findings based on the industry and the size of the website. Website evaluation model is developed to test university websites in Spain (Mateos et al., 2001). The model, called web assessment index has content, accessibility, and navigation at the major criteria. Website usability, design, and performance are developed using metrics and conducted a user test with them (Palmer, 2002). Through the three consecutive tests, it was concluded that the success of a website is dependent on the speed, navigation, content, interactivity and response (Palmer, 2002). Another research evaluates the performance of the present TV3 (television station in Malaysia) website, this research identifies the website viewer requirements and their corresponding importance level. The quality function deployment (QFD) exercise provides the prioritised technical requirements (Rafikul et al., 2007).
From the website designer or administrator’s perspective the website evaluation focuses on the web usability and accessibility. The website evaluation model is based on the study of the user-centred development and evaluation approach. This study attempts to develop the methodology and tool for the website quality evaluation from the information systems and software engineering perspective. Best websites selected by experts and users are investigated in order to identify the common characteristics of them (Sinha et al., 2001; Ivory and Hearst, 2002). To empirically determine whether content is more important than graphics, Webby Award 2000 data set is examined to differentiate the factors of best websites from the factors of other websites (Sinha et al., 2001). Webby Award evaluators use five specific criteria and the general experience. The criteria include structure, content, navigation, visual design, functionality and interactivity. Although content was found to be more important than graphics, evaluation criteria can not be considered independently (Sinha et al., 2001). The result confirmed that their 154 criteria had high accuracy rate of 84% by applying them to 157 webpages and Webby Award 2000 data set (Ivory and Hearst, 2002).
2.2 Website evaluation tool studies
introduced in previous research (Ivory and Hearst, 2002). The WebTango is a quality checker, which aims to help non-professional designers improve their sites using quantitative measures of the informational, navigational and graphical aspects of a website. The usability evaluation approach is used in the field of the software engineering to the website usability evaluation (Brajnik, 2000). The comparison of automated evaluation tools using consistency, adequate feedback, situational navigation, efficient navigation and flexibility as the characteristics of usability are explored is this research (Brajnik, 2000). Website evaluation model based on the stages of a transaction in the electronic market is another approach (Schubert and Selz, 1999). There are three stages of the electronic commerce-information stage, contract stage and payment stage – and assume that the communication stage in the cyber community plays an important role (Schubert and Selz, 1999). Their website evaluation model is based on the stages and was applied to the Swissair website. A website evaluation model is developed by applying the software quality model (Brajnik, 2002). The test method is proposed to determine whether an automated website evaluation tool uses the proper rules and applies it to the LIFT, an automated website evaluation tool (Brajnik, 2001, 2002). The validity of a set of website evaluation criteria is verified using the Webby Award 2000 data set (Ivory and Hearst, 2002). Development and evaluation of a model called web-based quality function deployment (WQFD) is a model to link among total quality management (TQM), information technology (IT) and web engineering (WE) (Sudhahar et al., 2009). The quality of service (QoS) in the internet and richer understanding of internet accounting taxonomy, such as attributes, parameters, protocols, records and metering tools need to be updated or replaced (Hak Ju, 2009).
2.3 Website evaluation tool
improvement has to be done faster than other software maintenance due to market pressure and the lack of barrier in website development. These characteristics of the website evaluation methods make an automated website evaluation tool a necessity, not an option. Automated website evaluation tools play a bigger role in supplementing or substituting non-automated website evaluation tool. Automated website evaluation tools allow to identify potential usability problems before the actual operation of a website and to select the best design through the comparison of alternative designs. This reduces economic and non-economic cost of non-automated website evaluations. Automated website evaluation tools also allow the website designer or administrator to evaluate many websites and to detect potential problems as well as actual problems.
2.4 Automated website evaluation tool
The function of an automated website evaluation tool largely consists of capture, analysis, and critique of website data (Ivory and Hearst, 2001). Capture activity records usage data. Analysis activity identifies potential usability problems. Critique activity proposes improvements for potential problems. Web accessibility initiative (WAI) of W3C classifies automated website evaluation tools into evaluation tool, repair tool and transformation tool. Analysis tools of automated website tools is divided into four types (Ivory and Hearst, 2001), which identify potential usability problems of a website. The first type of tools analyses server log file data to identify potential problems in usage patterns. The second type of tools help check whether the HTML code of a website follows the proper coding practice from a usability point of view. The third type of tools evaluates a website’s usability by collecting data through a simulation of a hypothetical user’s experience. The fourth type of tools monitors consistency, availability and performance of a web server by stressing the server. The second type of tools is most widely used in practice and some of the examples includes A-Prompt, WatchFire Bobby, UsableNet LIFT, W3C HTML Validator, and National Institute of Standards and Technology (NIST). These tools examine HTML to evaluate a website’s usability and check the conformance of WCAG or Section 508 guidelines. In 1998, US Government, the federal law Rehabilitation Act 508, requires all electronic information technologies to allow handicap people to use them. Therefore every website is required to provide accessibility to all and this guideline becomes an evaluation criterion of automated website evaluation tools. Max of WebCriteria, an automated website evaluation tool evaluates the usability of a website by collecting primary statistical data through the simulation model. The primary evaluation criteria include accessibility, load time and content. NetRaker, another evaluation tool, develops an online survey which allows users to answer the survey while using the website. NetRaker does not check HTML code or analyse statistical data. Instead, it collects and analyses user survey data of a website.
2.5 Quality standard
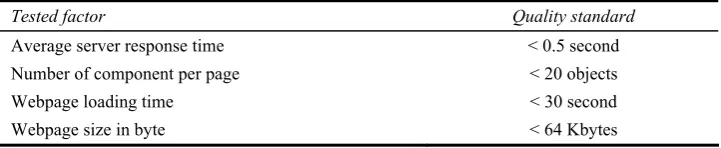
standard for performance measurement of quality (Amerson et al., 2001). Table 4 describes all of the criteria and quality standard that should be fulfilled by website to be a good quality website. Tested factors consist of: average server response time, number of component per page, webpage loading time, and webpage size in byte. A standard international download time for this performance can be used as a reference to categorise the tested webpage. Automation of the testing for website quality is a new chance and a new method, and should be applied for testing the quality of website. For leveraging the effectiveness of the continuous quality improvement, developer community has been aggressive in attaining TQM strategies by implementing ISO 9001:2000 standard (Sakthivel et al., 2007).
Table 4 Standard of the website performance
Tested factor Quality standard
Average server response time < 0.5 second
Number of component per page < 20 objects
Webpage loading time < 30 second
Webpage size in byte < 64 Kbytes
Source: Amerson et al. (2001)
3 Methodology
This research is consisted of several stages, start with problem identification followed by research procedure and data collection, and ended with analysis of data. Basically our research purpose has two-fold aim:
1 to propose the new methodology for evaluating the quality of e-government website 2 to determine the best e-government website based on the criteria proposed in the new
methodology.
This research examined the national e-government portals of a selected number of countries in Asia: Singapore, Korean, Japan, Hong Kong and Malaysia. This data of quality website from e-government website will be taken more than 30 trails on various occasions on the different period of time. Using website diagnostic tools and analytical hierarchy process (AHP) the aim of this research will be explored. All of the data for this research was taken using PC with specification: processor Pentium Mobile 740, using local area network internet connection with average bandwidth 60 kbps.
3.1 Web diagnostic tools
validator website (http://validator.w3.org) was used to validate the HTML code of the portals, this standard was set up by W3C, the main international standards organisation for the World Wide Web. The link popularity website www.linkpopularity.com is used to determine the amount and quality of links that are made to a single website from many websites, this based on the page-rank analysis.
This research also conduct using accessibility software for testing whether the webpage tested already fulfil the criteria to be accessed by people with disabilities. This software has an ability to conduct an online test for webpage refer to the criteria setup by W3C-WCAG. WCAG is part of a series of web accessibility guidelines published by the W3C’s WAI. They consist of a set of guidelines on making content accessible, primarily for disabled users, but also for all user agents, including highly limited devices, such as mobile phones. Accessibility software can be downloaded from www.tawdis.net. Testing using accessibility software consist of test for HTML code for knowing whether the webpage can be read by screen reader, and testing for knowing if there is any alternative text for every single picture, animation, video and audio in the webpage. Tawdis software tester can cover almost 90% of the item demanded by WCAG. Accessibility software used will give a report about an item, which is not met with the requirement, how many mistakes in every item, and line error of the HTML code. The last tool to be employed in our study was colour-blind webpage filter http://colorfilter.wickline.org which simulated how the colour schemes used by the respective portals impacted upon people with various forms of colour blindness. Three types of colour blindness are simulated: deuteranopia and protanopia both of which are forms of red/green deficiency), and tritanopia (a rare blue/yellow deficiency).
3.2 Sample data
In order to get the data for this research, we examined e-government websites from five Asian countries: the e-government portals were not randomly selected, but a careful process was undertaken. Rather than selecting any generic e-government web portal this research attempted to evaluate the web portals of governments that are considered to be leaders in the area of e-government based on the result of Waseda University World E-government ranking. By doing such an approach it was felt that measures of ‘best practices’ could emerge. As explained before, we examined the national e-government portals of a selected number of countries and their web addresses are provided along with the names, which are: Singapore (http://www.gov.sg), Korea (http://www.korea.go.kr/eng), Japan (http://www.kantei.go.jp/foreign/index-e.html), Hong Kong (http://www.gov.hk), and Malaysia (http://www.gov.my). This data in Table 7 will be taken more than 30 trails on various occasions on the different period of time.
3.3 Analytical hierarchy process
making (Yuen and Lau, 2008). In AHP the problems are usually presented in a hierarchical structure and the decision maker is guided throughout a subsequent series of pairwise comparisons to express the relative strength of the elements in the hierarchy. In general the hierarchy structure encompasses of three levels, where the top level represents the goal, and the lowest level has the website under consideration. The intermediate level contains the criteria under which each website is evaluated. The final score obtain for each website across each criterion is calculated by multiplying the weight of each criterion with the weight of each website. Website which has got the highest score is suggested as the best website and decision maker may consider that one as the best decision choice.
Generally, AHP has the following four steps:
1 Define an unstructured problem and determine its goal.
2 Structure the hierarchy from the top (objectives from a decision-maker’s viewpoint) through intermediate levels (criteria on which subsequent levels depend) to the lowest level, which typically contains a list of alternatives.
3 Employ a pairwise comparison approach. Fundamental scale for pairwise comparisons developed to solve this problem (Saaty, 1980). The pairwise comparison matrix A, in which the element aijof the matrix is the relative importance of the ith factor with respect to the jth factor, could be calculated as:
12 1 Reciprocals are automatically assigned to each pairwise comparison, where n is the matrix size.
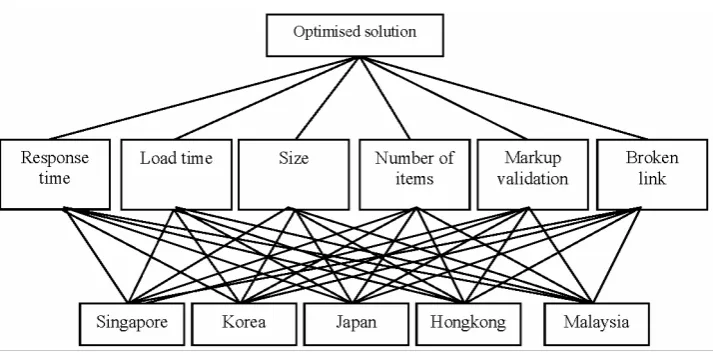
In the constantly fluctuating of the website, evaluation cannot survive without comprehensive quality factor identification and evaluation. The AHP methodology is demonstrated by applying it to a quality factors with an e-government website problem. Construction of the hierarchy is the first step in the problem-solving process. In this case (Figure 1), the goal of an AHP decision is to select the best e-government during the first level. Response time, load time, size, number of items, mark-up validation and broken link are the evaluation criteria during the second level of the hierarchy.
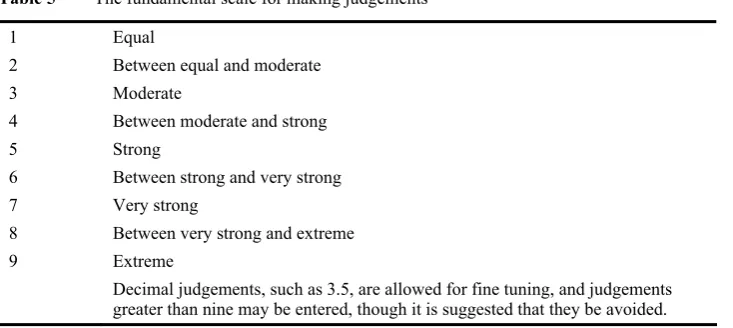
The fundamental scale for judgements is shown in Table 5.
Table 5 The fundamental scale for making judgements
1 Equal
2 Between equal and moderate
3 Moderate
4 Between moderate and strong
5 Strong
6 Between strong and very strong
7 Very strong
8 Between very strong and extreme
9 Extreme
Decimal judgements, such as 3.5, are allowed for fine tuning, and judgements greater than nine may be entered, though it is suggested that they be avoided.
When a number greater than nine is suggested by the inconsistency checking, this means that the elements you have grouped together are too disparate. You may input a number greater than nine, but perhaps you should reorganise your structure so that such a comparison is not required. It will do no great damage to allow numbers up to 12 or 13, but you should not go much beyond that.
4 Result and discussion
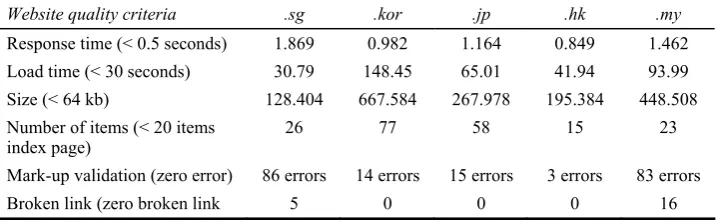
Results of the websites quality test based on server response, load time, size and number of items, mark-up validation, and broken link are showed in Table 7. The data in Table 7 shows that most of the websites in Asian cannot meet the criteria as a high quality website. Most of server response, load times, size and number of items exceed the value standardised by IBM, except Hong Kong websites in number of items criteria. Implementation of the W3C’s HTML validator highlighted that none of the Asian e-government website had HTML 4.01 valid entry page, most of it did not have Doctype declarations. Consequences of this problem will be on the portability and development of the website. In terms of broken link, two e-government website or 40% of the sample have a broken link.
Table 6 Testing result for websites performance based on criteria
Website quality criteria .sg .kor .jp .hk .my
Response time (< 0.5 seconds) 1.869 0.982 1.164 0.849 1.462
Load time (< 30 seconds) 30.79 148.45 65.01 41.94 93.99
Size (< 64 kb) 128.404 667.584 267.978 195.384 448.508
Number of items (< 20 items index page)
26 77 58 15 23
Mark-up validation (zero error) 86 errors 14 errors 15 errors 3 errors 83 errors
Broken link (zero broken link 5 0 0 0 16
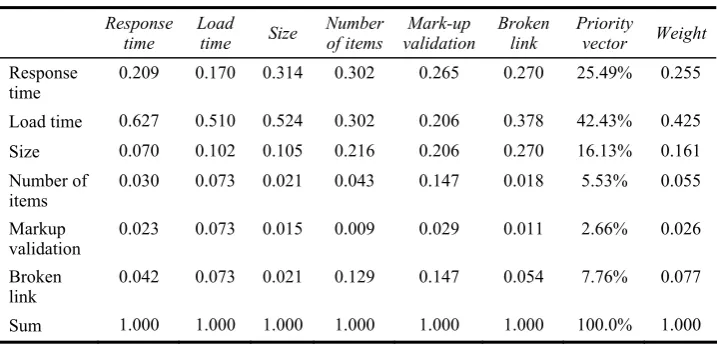
After determining the attributes and performance results, the next step in the analytic hierarchy process is to perform a comparison of each attributes. The preference criteria matrix was obtained which compare each criterion to the others and Table 7 depicts the preference criteria matrix in a form of pairwise comparisons.
Table 7 Criteria of performance website and country
Criteria Measurement unit Singapore Korea Japan Hong
Kong Malaysia
Response time Second 1.869 0.982 1.164 0.849 1.462
Load time Second 30.79 148.45 65.01 41.94 93.99
Size Kbytes 128.404 667.584 267.978 195.384 448.508
Number of items Number of items 26 77 58 15 23
Mark-up validation Number of error 86 14 15 3 83
Broken link Number of broken link
5 0 0 0 16
Table 8 Preference criteria matrix
Criteria Response
1 sum the elements in each column 2 divide each value by its column total 3 calculate row averages.
Calculation yields the normalised matrix of criteria is illustrated in Table 10. The average weights of rows are computed in the last column to indicate the weights of the criteria.
Table 9 Weights of criteria
Response
Table 10 Original response time matrix
Websites Singapore Korea Japan Hong Kong Malaysia
Singapore 1.000 0.143 0.200 0.111 0.333
Table 11 Normalise matrix for response time
From Table 10, the sum of Singapore response time is 25, Korea is 13.343, Japan is 6.6, Hong Kong is 6.454 while Malaysia is 13.476. The next step is to compute the value matrix by dividing all of the pairwise value with sum of the column. The result of the criteria values matrix is displayed in Table 11.
Table 12 added two new columns, which are: row summation of the value based on country and priority vector column (sum column divide by total). In this table Singapore has priority vector value of 0.025, Korea has 0.234, Japan has 0.226. Hong Kong has 0.361, and Malaysia has 0.154. The highest weights (priority vector) 0.361 and 0.234 belong to the attributes Hong Kong and Korea respectively. The attribute Singapore has the lowest weight of 0.025.
Table 12 Original load time matrix
Website Singapore Korea Japan Hong Kong Malaysia
Singapore 1.000 9.000 5.000 3.000 7.000
Korea 0.111 1.000 0.200 0.333 0.143
Japan 0.200 5.000 1.000 7.000 3.000
Hong Kong 0.333 3.000 0.143 1.000 7.000
Malaysia 0.143 7.000 0.333 0.143 1.000
Sum 1.787 25.000 6.676 11.476 18.143
Sum element for every column give a result: Singapore load time column matrix is 1.787, Korea is 25.000, Japan is 6.676, Hong Kong is 11.476 and Malaysia is 18.143. The next step is dividing all of the value by its column total. The result of the criteria values matrix is displayed in Table 13.
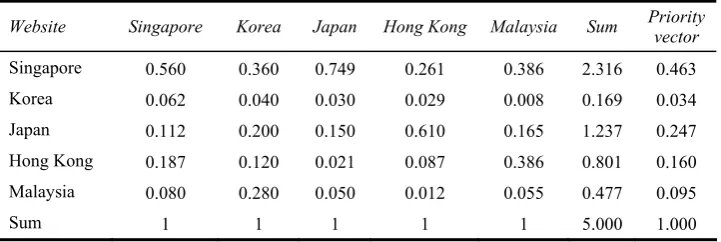
Table 13 Normalise matrix for load time
Website Singapore Korea Japan Hong Kong Malaysia Sum Priority vector
Singapore 0.560 0.360 0.749 0.261 0.386 2.316 0.463
Korea 0.062 0.040 0.030 0.029 0.008 0.169 0.034
Japan 0.112 0.200 0.150 0.610 0.165 1.237 0.247
Hong Kong 0.187 0.120 0.021 0.087 0.386 0.801 0.160
Malaysia 0.080 0.280 0.050 0.012 0.055 0.477 0.095
Sum 1 1 1 1 1 5.000 1.000
In Table 13, Singapore has priority vector value of 0.463, Korea has 0.034, Japan has 0.247. Hong Kong has 0.160 and Malaysia has 0.095. The highest weights (priority vector) 0.463 and 0.247 belong to the attributes Singapore and Japan respectively. The attribute Malaysia has the lowest weight of 0.095.
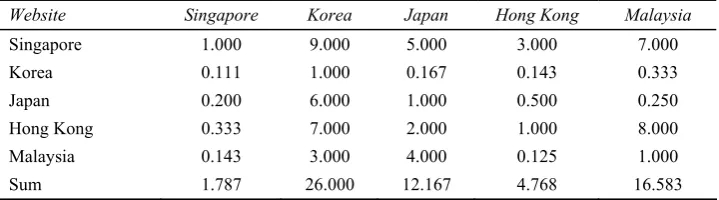
Table 14 Original matrix for size
Website Singapore Korea Japan Hong Kong Malaysia
Singapore 1.000 9.000 5.000 3.000 7.000
Korea 0.111 1.000 0.167 0.143 0.333
Japan 0.200 6.000 1.000 0.500 0.250
Hong Kong 0.333 7.000 2.000 1.000 8.000
Malaysia 0.143 3.000 4.000 0.125 1.000
Sum 1.787 26.000 12.167 4.768 16.583
In Table 15, Singapore has a priority vector value of 0.474, Korea has 0.033, Japan has 0.109, Hong Kong has 0.262 and Malaysia has 0.122. The highest weights (priority vector) 0.474 and 0.262 belong to the attributes Singapore and Hong Kong respectively. The attribute Korea has the lowest weight of 0.033.
Table 15 Normalise matrix for size
Website Singapore Korea Japan Hong
Kong Malaysia Sum Priority vector
Singapore 0.560 0.346 0.411 0.629 0.422 2.368 0.474
Korea 0.062 0.038 0.014 0.030 0.020 0.164 0.033
Japan 0.112 0.231 0.082 0.105 0.015 0.545 0.109
Hong Kong 0.187 0.269 0.164 0.210 0.482 1.312 0.262
Malaysia 0.080 0.115 0.329 0.026 0.060 0.611 0.122
Sum 1 1 1 1 1 5.000 1.000
The sum of Singapore number of items is 6.292, Korea is 28.000, Japan is 19.333, Hong Kong is 1.921 and the last e-government website for Malaysia is 4.843. The result of the criteria values matrix is displayed in Table 16.
Table 16 Original matrix for number of items
Website Singapore Korea Japan Hong Kong Malaysia
Singapore 1.000 8.000 6.000 0.333 0.500
Korea 0.125 1.000 0.333 0.111 0.143
Japan 0.167 3.000 1.000 0.143 0.200
Hong Kong 3.000 9.000 7.000 1.000 3.000
Malaysia 2.000 7.000 5.000 0.333 1.000
Sum 6.292 28.000 19.333 1.921 4.843
Table 17 Normalise matrix for number of items
Website Singapore Korea Japan Hong Kong Malaysia Sum Priority vector
Singapore 0.159 0.286 0.310 0.174 0.103 1.032 0.206
Korea 0.020 0.036 0.017 0.058 0.029 0.160 0.032
Japan 0.026 0.107 0.052 0.074 0.041 0.301 0.060
Hong Kong 0.477 0.321 0.362 0.521 0.619 2.300 0.460
Malaysia 0.318 0.250 0.259 0.174 0.206 1.207 0.241
Sum 1 1 1 1 1 5.000 1.000
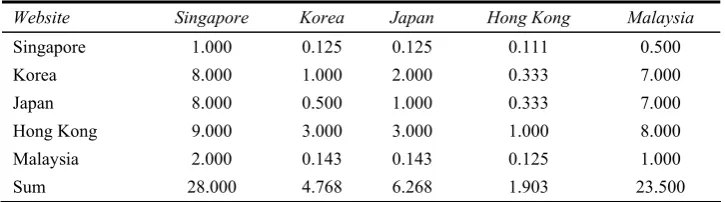
Based on data from Table 18, the sum of Singapore mark-up validation is 28.000, Korea is 4.768, Japan is 6.268, Hong Kong is 1.903 and the for Malaysia is 23.500. The result of the criteria values matrix is displayed in Table 19.
Table 18 Original matrix for mark-up validation
Website Singapore Korea Japan Hong Kong Malaysia
Singapore 1.000 0.125 0.125 0.111 0.500
Korea 8.000 1.000 2.000 0.333 7.000
Japan 8.000 0.500 1.000 0.333 7.000
Hong Kong 9.000 3.000 3.000 1.000 8.000
Malaysia 2.000 0.143 0.143 0.125 1.000
Sum 28.000 4.768 6.268 1.903 23.500
Table 19 for mark-up validation displayed that Singapore has priority vector value of 0.032, Korea has 0.258, Japan has 0.205, Hong Kong has 0.459 and Malaysia has 0.046. The highest weights (priority vector) 0.459 and 0.258 belong to the attributes Hong Kong and Korea respectively. The attribute Korea has the lowest weight of 0.032.
Table 19 Normalise matrix for mark-up validation
Website Singapore Korea Japan Hong Kong Malaysia Sum Priority vector
Singapore 0.036 0.026 0.020 0.058 0.021 0.162 0.032
Korea 0.286 0.210 0.319 0.175 0.298 1.288 0.258
Japan 0.286 0.105 0.160 0.175 0.298 1.023 0.205
Hong Kong 0.321 0.629 0.479 0.526 0.340 2.295 0.459
Malaysia 0.071 0.030 0.023 0.066 0.043 0.232 0.046
Sum 1 1 1 1 1 5.000 1.000
Table 20 Original matrix for broken link
Website Singapore Korea Japan Hong Kong Malaysia
Singapore 1.000 0.333 0.333 0.333 7.000
Korea 3.000 1.000 1.000 1.000 9.000
Japan 3.000 1.000 1.000 1.000 9.000
Hong Kong 3.000 1.000 1.000 1.000 9.000
Malaysia 0.143 0.111 0.111 0.111 1.000
Sum 10.143 3.444 3.444 3.444 35.000
Table 21 Normalise matrix for AHP pairwise comparison for broken link
Website Singapore Korea Japan Hong Kong Malaysia Sum Priority vector
Singapore 0.099 0.097 0.097 0.097 0.200 0.589 0.118
Korea 0.296 0.290 0.290 0.290 0.257 1.424 0.285
Japan 0.296 0.290 0.290 0.290 0.257 1.424 0.285
Hong Kong 0.296 0.290 0.290 0.290 0.257 1.424 0.285
Malaysia 0.014 0.032 0.032 0.032 0.029 0.139 0.028
Sum 1 1 1 1 1 5.000 1.000
Priority vector for broken link taken from Table 21 displayed that Singapore has priority vector value of 0.032, Korea has 0.258, Japan has 0.205, Hong Kong has 0.459 and Malaysia has 0.046. The highest weights (priority vector) 0.285 belong to the three attributes Korea, Japan and Hong Kong. The attribute Malaysia has the lowest weight of 0.028.
From Table 9, the weight of the response time is 0.255, load time is 0.424, size is 0.161, number of items is 0.055, mark-up validation is 0.4243 and the weight for broken link is 0.027. The next step is to compute the criteria value matrix from the previous Tables: 11, 13, 15, 17, 19, and 21 and multiply each column in Table 22 by the corresponding weights of attributes. The result of the criteria values matrix is displayed in Table 22.
Table 22 Weight of criteria and website
Website Singapore Korea Japan Hong Kong Malaysia Weight
Response time 0.025 0.234 0.226 0.361 0.154 0.255
Load time 0.463 0.034 0.247 0.160 0.095 0.424
Size 0.474 0.033 0.109 0.262 0.122 0.161
Number of items 0.206 0.032 0.060 0.460 0.241 0.055
Markup validation 0.032 0.258 0.205 0.459 0.046 0.027
Broken link 0.118 0.285 0.285 0.285 0.028 0.078
results, the website which has the highest score is suggested as the best website for the proposed hybrid model.
Table 23 Final result
Criteria Singapore Korea Japan Hong Kong Malaysia
Response time 0.006 0.060 0.058 0.092 0.039
Load time 0.197 0.014 0.105 0.068 0.041
Size 0.076 0.005 0.018 0.042 0.020
Number of items 0.011 0.002 0.003 0.025 0.013
Markup validation 0.001 0.007 0.005 0.012 0.001
Broken link 0.009 0.022 0.022 0.022 0.002
Final score 0.301 0.110 0.211 0.262 0.116
In accordance with the results generated by the proposed model, Singapore website has the highest score of 0.301 in comparison with the rest of e-government websites. As a result, the proposed AHP model rank for e-government website is: Singapore (score: 0.301), Hong Kong (score: 0.262), Japan (score: 0.211), Malaysia (score: 0.116), and the last rank is Korea (score: 0.110).
5 Conclusions
In this paper we evaluate the quality of Asian e-government websites. Using a series of online diagnostic tools, we examined many dimensions of quality, and each dimension will be measured by specific test online. The result of this study confirmed that the website presence of Asian e-government websites is neglecting performance and quality criteria. It is clear in our research that more effort is required to meet with these criteria in the context of website design. This suggests that web developer responsible for e-government website should follow and encourage the use of recognised guidelines when designing website. To get results on the quality of a website, we measure sample data from e-government portal in five Asian countries and calculate response time, page size, number of item, load, mark validation and broken link, number of link in search engine, optimisation score, accessibility errors, and colour-blind webpage filter test. The proposed model uses the AHP pairwise comparisons and the measure scale to generate the weights for the criteria which are much better and guarantee more fairly preference of criteria. Limitation of this research occurred in the number of sample size and time factor, this research used limited sample size of 30 data and taken during a short period observation time.
Acknowledgements
The authors would like to thank the editor and the anonymous reviewers for their valuable comments on earlier version of this article.
References
Amerson, M., Fisher, G., Hsiung, L., Krueger, L. and Mills, N. (2001) ‘Design for performance: analysis of download times for page elements suggests ways to optimise’.
Bouch, A., Kuchnisky, A. and Bhatti, N. (2000) ‘Quality is in the eye of the beholder: meeting users’ requirements for internet quality of service’, Human Factors in Computing Systems, ACM, The Hague, Netherlands.
Brajnik, G. (2000) ‘Automatic web usability evaluation’, Human Factors and the Web 6th, June. Brajnik, G. (2001) ‘Automatic web usability evaluation: what needs to be done?’.
Brajnik, G. (2002 ) ‘Quality models based on automatic web testing’, CHI Workshop, ACM, Minneapolis ACM.
Cooper, M. (2008) W3C Web Content Accessibility Guideline (WCAG) 2.0.
Durkin, M. (2007) ‘In search of the internet-banking customer: exploring the use of decision styles’, International Journal of Bank Marketing, Vol. 22, pp.484–503.
Green, D. and Pearson, J.M. (2006) ‘Development of a website usability instrument based on ISO-9241-11’, The Journal of Computer Information Systems, Vol. 47, pp.66–72.
Hak Ju, K. (2009) ‘New accounting system for the QoS-enabled multiservice internet: technical overview’, International Journal of Business Information Systems, Vol. 4, pp.173–194. Huizingh, E. (2000) ‘The content and design of websites: an empirical study’, Information and
Management, Vol. 37, pp.123–134.
Ivory, M. and Hearst, M. (2001) ‘The state of the art in automating usability evaluation of user interfaces’, ACM Computing Surveys, Vol. 33, pp.470–516.
Ivory, M. and Hearst, M. (2002) ‘Statistical profiles of highly-rated websites’, The SIGGHI Conference on Human factors in Computing Systems: Changing our World, Changing Ourselves,Minneapolis, Minnesota, USA, ACM, Minnesota, USA.
Josep, D., Ana, P., Julio, S., Jose, A. and Gil, A. (2007) ‘A user-focused evaluation of web prefetching algorithms’, Comput. Commun., Vol. 30, pp.2213–2224.
Krishnamurthy, B. and Wills, C. (2006) ‘Cat and mouse: content delivery tradeoffs in web access’,
The 15th International Conference on World Wide Web, Edinburgh, Scotland.
Loiacono, E. and McCoy, S. (2004) ‘Website accessibility: an online sector analysis’, Information Technology and People, Vol. 17, pp.87–101.
Loiacono, E.T., Watson, R.T. and Goodhue, D.L. (2007) ‘WebQual: an instrument for consumer evaluation of websites’, International Journal of Electronic Commerce, Vol. 11, pp.51–87. Mateos, M., Mera, A., Gonzalez, F. and Lopez, O. (2001) ‘A new web assessment index: Spanish
university analysis’, Internet Research: Electronic Networking Applications and Policy, Vol. 11, pp.226–234.
McCowen, F., Michael, N. and Bollen, J. (2005) ‘The availability and persistence of web references in D-Lib Magazine’, the 5th International Web Archiving Workshop and Digital Preservation
(IWAW’ 05), Viena.
McInerney, C. (2000) ‘Establishing and maintaining trust in online systems’, in Williams, M. (Ed.):
The 21st National Online Meeting Information Today, Medford, NJ.
Olsina, L., Godoy, D., Lafuente, G.J. and Rossi, G. (2001) Specifying Quality Characteristics and Attributes for Websites, Web Engineering, Springer Berlin.
Page, L., Motwani, R., Brin, S. and Winograd, T. (1998) ‘The anatomy of a large-scale hypertextual web search engine’, Vol. 30, pp.107–117.
Palmer, W. (2002) ‘Website usability, design, and performance metrics’, Information Systems Research, Vol. 13, pp.151–167.
Rafikul, I., Mohiuddin, A. and Masliza Hj, A. (2007) ‘Application of quality function deployment in redesigning website: a case study on TV3’, International Journal of Business Information Systems, Vol. 2, pp.195–216.
Ramsay, J., Barbesi, A. and Preece, J. (1998) Psychological investigation of long retrieval times on the World Wide Web, Interacting with Computers, Vol. 10, pp.77–86.
Saaty, T. (1980) The analytic hierarchy process: planning, priority setting, resources allocation, McGraw-Hill, London.
Sakthivel, M., Devadasan, S.R., Vinodh, S., Ramesh, A. and Shyamsundar, S. (2007) ‘ISO 9001:2000 based quality information management responsibility system’, International Journal of Business Information Systems, Vol. 2, pp.217–237.
Sayar, C. and Wolfe, S. (2007) ‘Internet banking market performance: Turkey versus the UK’,
International Journal of Bank Marketing, Vol. 25, pp.122–141.
Schubert, P. and Selz, D. (1999) ‘Web assessment – measuring the effectiveness of electronic commerce sites going beyond traditional marketing paradigms’, The 32nd Annual Hawaii International Conference on System Sciences, IEEE Computer Society.
Seffah, A., Donyaee, M., Kline, R. and Padda, H. (2006) ‘Usability measurement and metrics: a consolidated model’, Software Quality Journal, Vol. 14, pp.159–178.
Sinha, R., Hearst, M. and Ivory, M. (2001) ‘Content or graphics?: an empirical analysis of criteria for award-winning websites’, Proceedings of the 7th Conference on Human Factors and the Web.
Sudhahar, C., Kumar, R.S.P., Senthil, V., Devadasan, S.R. and Murugesh, R. (2009) ‘Web-based QFD: a collaborative technique for supporting the adoption of customers’ voices’,
International Journal of Business Information Systems, Vol. 4, pp.360–385.
Williams, R. and Rattray, R. (2003) ‘An assessment of web accessibility of UK accountancy firms’,
Managerial Auditing Journal, Vol. 18, pp.710–716.
Yuan, J., Chi, C. and Sun, Q. (2005) ‘A more precise model for web retrieval’, International World Wide Web Conference, ACM, Chiba, Japan.