Health Outcomes
A Model of Elderly Health Dynamics
Zhou Yang
Donna B. Gilleskie
Edward C. Norton
a b s t r a c t
Prescription drug coverage creates a change in medical care consumption, beyond standard moral hazard, arising both from the differential cost-sharing and the relative effectiveness of different types of care. We model the dynamic supplemental health insurance decisions of Medicare beneficiaries, their medical care demand, and subsequent health outcomes over time. Using parameter estimates obtained with longitudinal individual-level data, we simulate behavior under different drug coverage scenarios. Prescription drug coverage increases drug expenditures by 7 percent to 27 percent over a five-year period. While mortality rates fall slightly, the survivors have poorer health, leading to higher total medical expenditures.
I. Introduction
One of the fundamental questions in health economics is how health insurance affects the demand for medical care. In general, health insurance causes ex
Zhou Yang is assistant professor of health economics at Emory University. Donna B. Gilleskie is an associate professor of economics at the University of North Carolina at Chapel Hill. Edward C. Norton is a professor of health management and policy and a professor of economics at the University of Michigan. This research is funded by the National Institute on Aging Grant Number R01-AG16600. The authors appreciate comments from David Blau, Richard Hirth, Xin Li, Tom Mroz, Betsy Sleath, Sally Stearns, Morris Weinberger, and seminar and conference participants at the University of North Carolina at Chapel Hill, Michigan State University, the University of Wisconsin, Yale University, the 4th World Congress of the international Health Economics Association, and the 15th Annual Health Economics Conference. The data used in this article were acquired through a restricted use agreement with the Centers for Medicare and Medicaid Services and can only be obtained through the Centers for Medicare and Medicaid Services. The authors are willing to help other scholars through this process.
½Submitted August 2007; accepted October 2007
post moral hazard (that is, an increase in the demand for medical care as a result of the decreased net price of care).1Moreover, health insurance that is specific to just one type of medical care—prescription drugs, long-term care, or mental health care—could influence consumption of other types of medical care. This change in medical care consumption stems both from the differential cost-sharing features of insurance for different types of care as well as the relative effectiveness of each type of care in producing or maintaining health. The resulting changes in morbidity and mortality affect all future medical care expenditures. The behavioral effect could lead to more efficient use of medical care resources if increased demand for a newly covered service reduces costly expenditures on other types of care and if the associ-ated changes in care improve health over time. Alternatively, changes in behavior as-sociated with additional coverage in one area may cause unnecessary costs if consumption of costly or redundant care escalates or if health outcomes deteriorate. The recent expansion of Medicare from hospital and physician services coverage for the elderly (Parts A and B) to one that includes optional coverage of prescription drugs (Part D) will provide an interesting social experiment for evaluating the effect of one type of insurance on consumption of other types of medical care and, more impor-tantly, on the health of the elderly.2Unfortunately, we must wait a few years; careful examination of what are obviously dynamic outcomes can occur only at some point in the future. However, existing sources of prescription drug coverage, and health insur-ance in general, provide insight into the relationships between the demands for med-ical care services of all types and the subsequent production of health. To examine these relationships we use panel data on elderly Medicare-covered individuals to es-timate a dynamic model of supplemental insurance selection (which may or may not include prescription drug coverage); demand for hospital services, physician serv-ices, and prescription drugs; health shocks; and health production over time.
Our model can be used to understand how prescription drug coverage affects total medical care expenditures and health over time. One argument in favor of the Medi-care expansion is the expected reduction in other health Medi-care expenditures. Support for this argument cannot be tested within a static framework, as others have tried to do. Projections of long-run costs associated with drug coverage should reflect not only the immediate moral hazard effect but also the longer-run changes in morbidity and mortality associated with changes in both drug use and other medical care use over time. Increased prescription drug use may reduce disability among the elderly, reduce the onset of chronic illness and its complications, and reduce mortality. This health maintenance or improvement may reduce hospital and physician service expenditures in the short run. However, decreased mortality may increase the number of Medicare beneficiaries and the total demand for Medicare-covered services in the long run. Our dynamic analysis allows an increase in prescription drug use induced by drug coverage to affect subsequent total medical care expenditures of the elderly through changes in health status over time. Modeling the health and behavior of
1. Ex ante moral hazard refers to the insurance-induced changes in behaviors that increase a person’s prob-ability of needing medical care.
marginal survivors, those individuals who would have died without prescription drug coverage but who live longer with it, is critical to understanding the full costs and benefits of prescription drug coverage.
We use data from the longitudinal Medicare Current Beneficiary Survey Data (MCBS) from 1992 to 2001 to jointly estimate a system of dynamic empirical equa-tions representing supplemental insurance coverage decisions, drug and other medi-cal care demand, and health production. Specifimedi-cally, our findings quantify the effect of prescription drug coverage (through Medicaid, employer and private insurance plans, or Medicare’s managed care option) on the demand for drugs as well as hos-pital and physician services among Medicare beneficiaries. We also examine the ef-fect of each medical care input on chronic condition status, functional status, and mortality, and the effect of health on subsequent medical care consumption over time. We evaluate the long-run (five-year) effect of drug coverage by simulating behavior under different drug coverage scenarios and updating endogenous explanatory vari-ables year by year. Universal prescription drug coverage would increase prescription drug expenditures in our sample by 7–27 percent over five years (depending on the type of drug coverage provided). The associated changes in hospital and physician service expenditures differ depending of the source of drug coverage and the subpop-ulation of interest, but some offsets in expenditures are realized. While some of the increase in total expenditures is directly attributable to changes in insurance, the increase results from changes in health as well. Long-run survival probabilities increase, leading to larger proportions of elderly survivors with functional limita-tions. Our projections of changes in both expenditures and health, however, are smaller than those produced by extrapolating static models that fail to incorporate the dynamic consequences of increased prescription drug use on health and con-sumption of other Medicare-covered services.
This paper extends the literature on moral hazard induced by health insurance in several ways. We are the first to model the dynamic effects of insurance and drug coverage on health and Medicare-covered expenditures over time. A few papers have tried to estimate the static effect of prescription drug coverage on other forms of medical care expenditures, but never before in a dynamic framework. Static models miss much of the total effect of prescription drug coverage, because prescription drug use affects future morbidity, mortality, and medical care expenditures, not just current ones. Furthermore, because our model allows for both permanent and time-varying heterogeneity, we show that medical care behavior of the elderly is highly correlated over time. Our policy simulations not only show modest cost offsets over five years, they break down the changes into morbidity and mortality effects.
II. Background and Literature Review
Even before Medicare began offering prescription drug coverage, elderly Americans spent a large amount on outpatient prescription drugs. In 1995, approximately 85 percent of the noninstitutionalized elderly had at least one pre-scription, and the average annual outpatient prescription drug expenditure was around $600 per person and $22 billion in total (Poisal et al. 1999). By 2001, the average elderly individual consumed over $1,400 annually in prescription drugs (MCBS data). Although the elderly only account for one-eighth of the total popula-tion, their drug expenditures account for one-third of all drug expenditures in the United States. (DHHS 1998; Long 1994). Elderly persons have greater demand for prescription drugs because of worse general health, higher disability rates, and a higher prevalence of chronic diseases (Adams et al. 2001a; Blustein 2000; Johnson et al. 1997; Lillard et al. 1999; Poisal et al. 1999; Rogowski et al. 1997; Soumerai and Ross-Degnan 1999; Stuart and Coulson 1994).
Despite the large demand for drugs, insurance coverage of outpatient prescription drugs was limited among the elderly. Before 2006, the Medicare program did not cover most outpatient prescription drugs. However, about 65 percent of Medicare beneficiaries had some drug coverage from at least one supplemental insurance plan, leaving 35 percent who covered the full cost of outpatient prescription drugs out of pocket. Among those with drug coverage (which may be from multiple sources), about 44 percent had employer-provided health insurance (either as retirees or active workers), 16 percent held privately purchased individual coverage, 16 percent had Medigap insurance, 11 percent were covered through a Medicare managed care plan, 17 percent were on Medicaid, and 4 percent had other publicly provided coverage, including Veteran Assistance or state Pharmacy Assistance (Poisal et al. 1999). Ad-verse selection suggests, however, that those who purchased additional insurance be-yond Medicare were those who expected to have higher than average medical care expenditures.
or other cost-sharing limitations may have restricted the appropriate use of clinically essential drugs (Reeder and Nelson 1985; Soumerai et al. 1987; Soumerai and Ross-Degnan 1990; Soumerai et al. 1991; Soumerai et al. 1994).
Most studies of the potential costs of a Medicare prescription drug benefit are cross-sectional and provide only a point-in-time correlation between drug coverage and drug use. These studies suggest that insurance increases prescription drug use, and the more generous plans have the strongest positive effects (Adams et al. 2001b; Blustein 2000; Lillard et al. 1999; Long 1994; Poisal et al. 1999; Rogowski et al. 1997). Other cross-sectional studies conducted at the state or community level draw similar conclusions (Fillenbaum et al. 1993; Stuart and Coulson 1993; Stuart and Grana 1995).
To better understand the effects of increased drug coverage among the elderly, it is necessary to consider both the effect of insurance on drug use, as well as the effect of drug use on other medical care costs and health outcomes. With regard to the effect of drug use on nondrug medical care expenditures, Soumerai and colleagues (1991) found that a reduction in use of outpatient drugs due to a prescription cap in New Hampshire led to increased hospital and nursing home admission rates among elderly beneficiaries over one year. For mentally ill patients, the increase in the cost of non-drug medical services even exceeded the savings in reduced prescription non-drug use (Soumerai et al. 1994). A study conducted in Canada revealed that greater consumer cost-sharing for prescription drugs led to a reduction in consumption of essential drugs, and higher rates of adverse health events and emergency room visits among elderly persons (Tamblyn et al. 2001). These studies, however, do not consider ex-plicitly the effect of altered drug use on patient mortality or morbidity.
Turning to the effect of drug use on health outcomes, Gowrisankaran and Town (2004) analyzed county-level mortality rates over time and found that greater enroll-ment in Medicare managed care insurance plans without a drug benefit was associ-ated with higher mortality but found no association between mortality and Medicare managed care plans with drug coverage. Federman, et al. (2001) and Lichtenberg (2005) found that greater use of clinically essential drugs or newer drugs may de-crease the population mortality rate. None of these studies, however, investigated morbidity and functional status among the survivors and their subsequent medical care expenditures. Some researchers argue that chronic diseases are the main reason for functional disability and therefore suggest that the development and use of new drugs could decrease disability rates (Cutler 2001; Ferrucci et al. 1997).
consumption depends crucially on health insurance, and unobserved health influences health insurance decisions, medical care use, and subsequent health outcomes, the endogeneity of health insurance must be considered (that is, one should jointly model health insurance decisions). The available longitudinal data that allows us to accom-plish our research goals requires that we rely only on indicators of insurance coverage since we do not have (reliable or specific) information on insurance characteristics.
Measurement of the effect of drug use on health outcomes (both mortality and morbidity) over time is necessary for predicting the net cost of a Medicare drug ben-efit. For example, studies that fail to consider the possible reduction in disability rates associated with prescription drug use may overstate the net cost of the drug benefit given the positive correlation between disability and hospital expenditures among the elderly (Stearns et al. 2007). If the elderly live longer but healthier lives, then total medical care costs at the population level may not necessarily increase. Alternatively, studies that fail to consider how drug use affects morbidity and mortality may under-state the long-term net costs of a Medicare drug benefit. A lower mortality rate and greater longevity will increase the number of Medicare beneficiaries and lead to greater demand for all Medicare-covered health care services. Additionally, the dis-tribution of health among survivors may change: Increased survival may imply a larger proportion of disabled elderly. The lack of longitudinal analyses of individual behavior that could explain the complicated causal relationship between drug con-sumption, changes in health status, and subsequent expenditures on other medical care services among the elderly population is a striking omission from the existing literature (Adams et al. 2001a). This paper seeks to fill the void.
III. Model of Elderly Health Dynamics
A. Theoretical Motivation
Economic theory provides a framework for analyzing medical care demand and health production over time. The seminal work of Grossman (1972) adopted the household production approach to model a consumer’s lifetime demand for health, and derived demand for medical care, where health exhibits both consumption value and investment value. Individuals receive utility each period from the services of a health stock (that is, healthy days). Health inputs (medical care and time spent in health producing-activities) augment the natural depreciation of the health stock over time.3
Much of the empirical work on medical care demand has been based on reduced-form models, or has exploited changes or differences in policies that provide ‘‘nat-ural’’ exogenous variation in the determinants of demand. This outcome arises largely because of the difficulty of solving and estimating structural parameters of optimization problems that involve many decisions, numerous alternatives, and large state spaces. Various authors in the body of empirical work have tried to address issues of uncertainty, unobserved heterogeneity, and dynamics, but a unifying frame-work that captures each of these issues remains elusive. However, estimable approx-imations representing the structural demand equations, health production functions, and uncertain health shocks can be derived from a theoretical framework that cap-tures the dynamic utility maximization problem under uncertainty.
Our theoretical framework assumes, like Grossman, that utility is a function of health, but we believe medical care consumption may directly influence current-period utility while also serving as investment in future health. That is, it may alle-viate pain, cause discomfort, or capture time costs (which are not modeled directly) associated with utilization. Additionally, we allow prior medical care use to affect current-period utility (and hence, also insurance selection) directly rather than solely through its influence on health transitions from period to period. That is, lagged med-ical care utilization may alter the marginal utility of medmed-ical care this period or in-fluence health insurance purchases from one year to another. Medical care prices, health insurance, and income constrain consumption. We model health shocks each period and allow these observed health shocks to influence contemporaneous con-sumption and subsequent health transitions. Conditional on health entering the period and health shocks and medical care consumption during the period, the evolution of health from one period to the next is uncertain. Individuals are forward-looking and maximize the sum of contemporaneous utility and discounted expected future utility.
Figure 1 depicts the timing of annual insurance and medical care decisions, health shocks, and health production that characterize our empirical model of individual be-havior. An elderly person may choose to supplement basic Medicare insurance cov-erage with a supplemental planðItÞ that may or may not include prescription drug coverageðJtÞ. After choosing his health insurance for the year, he may or may not experience a health shockðStÞ. This health shock and his insurance coverage affect medical care consumption during the year. We model demand for hospital services
ðAtÞ, physician services ðBtÞ, and prescription drugs ðDtÞ. At the end of the year, health production, which depends on the health shocks and medical care inputs dur-ing the year, determines his health next year measured by whether he has ever had particular chronic conditionsðEt+1Þand his functional statusðFt+1Þ.
We denote the information available to an individual at the beginning of each year byVt¼ ðEt;Ft;At21;Bt21;Dt21;Xt;ZtÞ. This information set includes observed health entering the period, which is summarized by whether the individual has ever had spe-cific chronic conditionsðEtÞand by functional statusðFtÞentering periodt. A history of medical care use is reflected by the lagged values of medical care demand
Mt21¼½At21;Bt21;Dt21
ð Þ. Information entering the year also includes exogenous individual characteristicsðXtÞand exogenous theoretically relevant variables reflect-ing price and supply conditions for insurance and medical careðZtI;Z
M
t Þand exoge-nous shifters of healthðZH
all current and lagged values of the individual- and time-specific unobserved (by the researcher) components of the optimization problem.
B. Empirical Specification of Jointly Estimated Equations
1. Insurance Selection
All elderly U.S. citizens (age 65 and older) receive Medicare hospitalization cover-age (labeled Part A) and have the option to purchase physician services covercover-age (labeled Part B). Over 95 percent of the elderly choose Part B coverage. Part A cov-erage is free, but Part B covcov-erage requires a monthly premium. Both Parts A and B are administered as fee-for-service insurance and require some consumer cost shar-ing in the form of deductibles, co-insurance, indemnity reimbursement, or limits in the amount of coverage. In addition to limits on the number of nights in a hospital and the number of days in a nursing facility following a hospital stay, Medicare Parts A and B do not cover prescription drug use outside of the hospital. Given the cost sharing and limited coverage, some elderly choose to supplement this basic Medicare coverage.
We denote the insurance coverage of an individual covered by Medicare Parts A and B only asIt¼0. By definition, this basic plan does not provide drug coverage so the drug coverage indicator,Jt, equals zero. If eligible, based on state-specific in-come and asset limits, an individual may be dually covered by Medicare Parts A and B and Medicaid. In this case, denoted byIt¼1, the beneficiary pays no premi-ums and experiences little or no cost sharing. Medicaid also covers prescription drugs; hence Jt¼1 by definition. An individual may choose to supplement basic Medicare coverage with a private plan; we denote this alternative It¼2. Sources of this private coverage include 12 supplemental options defined by Medicare (termed Medigap plans) and sold by private insurance companies; other privately purchased plans; and employer-provided group plans obtained through a current or former em-ployer, a spouse’s emem-ployer, or a union. Individuals may select among private plans that do or do not offer prescription drug coverage. Beginning in 1985, Medicare be-gan offering the elderly covered by Parts A and B the option to receive their benefits Figure 1
through a variety of risk-based or coordinated care plans called Medicare+Choice and later renamed Medicare Advantage. This option (labeledIt¼3) is conveniently referred to as Part C, and individuals may choose from an array of managed care plans that do or do not cover prescription drugs. In 2006, Medicare began offering prescription drug coverage (labeled Part D), but the data we use in estimation span the years 1992–2001 only.
The indirect utility of each supplemental plan alternative i¼0;.;3 and each drug coverage alternativej¼0;1 depends on the plan’s price (that is, premium), its nonpecuniary characteristics (for example, filing of claims, stigma), the cost-shar-ing and coverage characteristics associated with that plan, the individual’s expecta-tion of his medical care needs (that is, his health during the year), and medical care prices. Together, these determine the beneficiary’s out-of-pocket cost distribution. Prior to falling ill and/or consuming medical care, this distribution depends on the information an individual has at the time of insurance purchase. Unfortunately, sev-eral aspects of health insurance are not observed by the researcher or do not vary across individuals within a plan, and therefore cannot be included as explanatory var-iables in estimation.4Entering year
t, the individual (and the researcher) observes
Vt¼ðEt;Ft;At21;Bt21;Dt21;Xt;ZtÞwhereZt¼ Z utility of planiwith drug coveragejis
VijtI ¼vðEt;Ft;At21;Bt21;Dt21;Xt;Zt;It¼i;Jt¼jÞ+u I ijt
ð1Þ
whereuIijt represents unobserved individual heterogeneity that influences insurance decisions.
The observed variation in the arguments ofvðÞexplains only part of the variation in insurance coverage in the data. Unobserved individual characteristics likely influ-ence the insurance choice, as well as many or all of the behaviors we model, but these unobservables may not be completely idiosyncratic. We decompose the error term,uI
ijt, into three components. The first part, m, captures permanent, or time-independent, unobserved individual heterogeneity.5The second part,
vt, represents time-varying un-observed individual heterogeneity.6The third part,eI
ijt, is a serially uncorrelated error term that expresses an individual’s random preferences for insurance. LetrI
ij be the
4. We do not use cost-sharing characteristics of insurance plans, such as payments, deductibles, or co-insurance rates, because 1.) they are not available in the MCBS data (for private plans) or 2.) they do not vary across individuals (for the Medicare only option) or vary very little (for Medicaid) or 3.) they vary in too many dimensions to simplify (for Part C plans). The MCBS data do report out-of-pocket costs, as well as claims, which enables the researcher to calculate the percent of total costs paid by the consumer, but does not allow the researcher to uncover the specific cost-sharing structure. Because of potential measurement error, we do not use these constructed variables.
5. Examples of unobserved permanent individual heterogeneity include risk aversion or attitude toward medical treatment. For example, a patient who prefers outpatient care to inpatient care is more likely to seek drug treatment than a patient who better tolerates inpatient care. Similarly, he may choose supplemen-tal insurance with better prescription drug coverage.
factor loading onmandvI
ijbe the factor loading onvtfor each insurance optioniandj. The error decomposition is
I, andvtare estimated parameters of the empirical model.7 Substituting Equation 2 into Equation 1 and assuming an Extreme Value distribu-tion of the additive idiosyncratic error term ðeI
ijtÞ in the alternative-specific value function for insurance, the individual’s decision rule is to choose the combination of insurance plan i and drug coverage j that provides the highest indirect utility. Our assumptions yield a multinomial logit distribution of the polydichotomous sup-plemental insurance plans as a function of the theoretically relevant variables known by the individual at the beginning of the period.
Private supplemental plans differ from the Part C options regardless of whether the plan offers drug coverage or not (for example, physician choice, cost sharing, etc.) The similarities among plans with different coverage options within the broad insur-ance categories lead us to model the selection of supplemental insurinsur-ance type first, and then, conditional on insurance type, the coverage of drugs (Feldman et al. 1989).8 After approximating thevð:Þ function with a series expansion of its argu-ments, the probabilities of dual coverage by MedicaidðIt¼1Þ, supplemental cover-age from a private plan It¼2, and participation in Medicare Part C It¼3 are specified (in log odds relative to the basic Medicare plan)9as
ln PrðIt¼iÞ
Individuals covered by Medicare Parts A and B only do not have drug coverage; those covered by Medicaid, do. An individual selecting either a private supplemental plan or the Medicare managed-care option(It¼2or3)may or may not have selected prescription drug coverage. The probability of drug benefitsðJt¼1Þ, relative to no drug benefits, is modeled as a logit outcome where
7. The discrete mass points of the permanent and time-varying heterogeneity distributions are denoted
m¼ ðmm;m¼1;.;MÞandnt¼ ðnlt;l¼1;.;LÞ, respectively, whereMandLare the number of mass points in the discrete approximations to the distributions. Leterepresent the equation this unobserved het-erogeneity influences. The factor loadings measure the weight on the hethet-erogeneity component for each outcome,o, of each equation,e, wherere¼ ðre
o;o¼1;.;OÞandv
e¼ ðve
o;o¼1;.;OÞfor each equa-tion with more than two outcomes. Appropriate normalizaequa-tions are imposed for identificaequa-tion.
8. Although our modeling of permanent and time-varying unobserved heterogeneity breaks the assumption of independence of irrelevant alternatives that plagues the multinomial logit specification, we go one step further and model the plan and drug coverage demand using two equations (allowing for unique marginal effects of included explanatory variables across both insurance type and drug coverage) that we estimate jointly (allowing for correlation in unobservables).
ln PrðJt¼1jIt¼2 or 3Þ
The health insurance decision at the beginning of the period depends on price and supply conditions in the insurance marketðZI
tÞ and expected medical care expenses during the coverage period. This expectation is a function of expected health (or need for medical care), expected medical care utilization, and medical care prices. Existing chronic conditionsðEtÞand functional statusðFtÞentering the period determine the health distribution. Additionally, exogenous differences in health-related variables across countiesðZH
t Þ, such as measures of air quality, affect the probability of health shocks. Expected utilization during the period depends on lagged indicators of previous medical care use of each type of medical careðAt21;Bt21;Dt21Þbecause we assume these alter the marginal utility of consumption of medical care this period. The demand for a particular type of medical care is a function of its own price, as well as the price of substitutes and compliments. Medical care price and supply variables are summarized byZM
t . We also include time trends to control for aggregate influences that may explain general variation in coverage over time. We allow the observed supplemental health insurance and drug coverage of an individual to be affected by observable individual characteristicsðXtÞas well as unobservable individual characteristics (for example, health history or preferences for care),mandvt, that are likely to also influence med-ical care decisions, health shocks, and health transitions. Assumed exogeneity of health insurance and drug coverage decisions would bias estimates of its effect on drug consumption (and other medical care consumption) if such adverse selection occurs. Correct estimates of the effects of insurance are crucial for evaluating the costs and benefits of prescription drug coverage.
2. Health Shocks
When an individual enters our sample, we observe whether he has ever had any of the four major chronic health concerns facing the elderly. We define the vector of existing chronic conditions asEt¼ Et1;E
2
whereE1t indicates heart prob-lems (including high blood pressure, stroke, and heart disease);Et2indicates respira-tory problems (such as bronchitis and emphysema);E3t indicates cancer; and E4t indicates diabetes. These chronic conditions tend to be the most disabling among the elderly and the elderly experiencing multiple chronic conditions consume much more medical care (Wolff et al. 2002). It has been suggested that better primary care, especially coordination of care, could reduce avoidable hospitalization rates (Culler et al. 1998). Others maintain, however, that better coordination and management of chronically ill patients may improve quality of care but will not reduce overall treat-ment costs (Fireman et al. 2004).
without chronic conditionkentering yeartmay experience a health shock of typek in yeartðSk
tÞ. An adverse health shock among individuals free of disease (that is, Ekt ¼0 andSkt ¼1) implies that they have the chronic condition in the subsequent periodðEk
t+1¼1Þ. We also assume that these conditions are never cured. 10
Our estimated equation system includes the probability of health shocks of type kwherekindicates the particular health shock enumerated above.11The logit prob-ability of health shockk, expressed in log odds relative to not having health shockkin periodt, is
Variations in existence of chronic conditions and functional status entering the cur-rent period (EtandFt), as well as demographic characteristicsðXtÞ, affect the prob-ability of a health shock. We control for exogenous county and year differences in health-related variables ðZH
t Þ that influence onset of or complication from chronic conditions. We assume these exogenous variables have no independent effect on functionality transitions from year to year, once shocks are observed. These health shocks, however, are likely correlated with permanent and time-varying unobserv-ables that determine other health-related behaviors such as insurance selection, med-ical care demand, and functionality transitions, as indicated by the inclusion ofmand vtabove.
3. Medical Care Demand
Observed annual medical care demand depends on the lifetime value of medical care consumption this period. The lifetime value of different hospital services, physician services, and prescription drug levels (At¼a;Bt¼b, andDt¼d) is comprised of contemporaneous utility and the expected present discounted value of utility in the future conditional on the medical care choices in periodt.
Current utility of different medical care combinations depends on this period’s se-lected health insurance coverage ðIt;JtÞand observed health shocksðStÞ as well as chronic condition status ðEtÞ and functionalityðFtÞentering the period. Exogenous prices of (all types of) care ðZM
t Þ and individual demographicsðXtÞalso affect de-mand. We allow past medical care consumptionðAt21;Bt21;Dt21Þto influence current consumption partially through pathways other than health. That is, lagged medical care behavior may influence the marginal utility of care today. Some theories of demand suggest that the current utility of consumption of addictive goods may depend on
10. By construction, is a stochastic variable defined by the onset of a health shock of a particular type. It is endogenous since individuals have the ability to influence their health stock (Et,Ft) which affects the
prob-ability of a health shock.
the use of that good in previous periods (Becker and Murphy 1988; Becker et al. 1994). While we are not suggesting that consumption of medical care is addictive, use of particular types of care may be habitual or the effectiveness may be dependent on continued use. For example, some Medicare beneficiaries develop stable and trustworthy relationships with their outpatient care providers over time. An individ-ual with more physician contact (or a regular source of care), all else eqindivid-ual, may be more likely to fill prescriptions and use other forms of medical care in the future be-cause of the relationship that has been established between patient and provider. Sim-ilarly, hospitalization in the previous period, for example, may require followup physician care or prescription medication.
Expected future utility, the second component of the lifetime (indirect) value of medical care consumption this period, depends on the effectiveness of medical care in maintaining or improving health next period (that is, health production) that may be offset by health shocks today. The unobserved natural deterioration of health over time and unobserved health shocks also affect health transitions and hence medical care demand today.
This value function and its arguments are
VM
abdtðEt;Ft;At21;Bt21;Dt21;Xt;Z M
t ;At¼a;Bt¼b;Dt¼djIt;Jt;StÞ:
ð6Þ
By assumption, variations in observed values ofZI
t andZtHdo not independently af-fect annual demand conditional on the observed insurance plan and drug coverage chosen at the beginning of the periodðIt;JtÞ and the observed health shocks ðStÞ during the period.
Our data allow for valuation of total medical care consumption as well as out-of-pocket expenditures. Because, in this analysis, we care about the effect of insurance on the total amount of care consumed and the effect of medical care on health, we model total expenditures in each medical care category. Additionally, out-of-pocket expenditure data are self-reported for some service categories and total expenditures may be more accurate because they are based on actual claims. The distribution of medical expenditures is highly skewed, with some people having zero expenditures. Following much of the literature in health economics, we model annual (log) expen-ditures as the joint product of the probability of any expenexpen-ditures (using a logit equa-tion) and the log of expenditures, if any (treated as a continuous outcome). Lettingq indicate expenditures on either hospital services (A), physician services (B), or pre-scription drugs (D), the probability of any such expenditures follows a logit specifi-cation, written in log odds, where
ln Prðqt.0Þ
lnðqtjqt.0Þ ¼d
Time trends are also included in the utilization and expenditures equations to capture additional time-series variation in particular types of care. In particular, consumption of prescription drugs has increased considerably over the 1990s. Much of this in-crease may be related to individual-level changes in health or insurance coverage, but a significant amount may be due to exogenous aggregate-level changes in adver-tising and production of new drugs.
The two-equation specification of demand allows variables of interest to have a different marginal effect on the probability of any expenditures and the log of expen-ditures. However, we allow for permanent and time-varying unobserved heterogene-ity that may be correlated with both outcomes. Additionally, because this study seeks a comprehensive understanding of how drug coverage affects prescription drug use and subsequent health outcomes, we cannot ignore the correlated use of other med-ical services such as hospital and physician care. Prescription drug use may be a complement to or a substitute for these other types of medical care. That is, a hospital stay may require physician care followups and prescription pain relief exhibiting positive contemporaneous correlation in annual use. Alternatively, prescription drug use may prevent, delay, or substitute for costly hospitalization reflecting negative contemporaneous correlation. Thus, the demands for each type of medical care are estimated jointly (along with insurance, health shocks, and health production) and are correlated through both permanent individual unobservablesðmÞand contempo-raneous time-varying individual unobservablesðvtÞ.
We recognize another important reason to model serial correlation in individual unobservables. Failure to account for this unobserved heterogeneity may lead to an apparent statistical correlation in medical care demand across time, given our in-clusion of lagged medical care use. A major concern, then, is accurately modeling unobserved health because the health measures available in the data may not fully capture the effects of past medical care use solely through the health production function.
4. Health Production
Current health and medical care inputs determine health in the subsequent period through a health production function. In addition to chronic conditions, functional statusðFtÞserves as a measure of health at the beginning of the annual observation periodt. We measure functional status by limitations with Activities of Daily Living (ADLs) and Instrumental Activities of Daily Living (IADLs) with death as the ex-treme negative health outcome.12Using a multinomial logit model, the functional
status outcomes are zero ADL or IADL limitationsðFt+1¼0Þ, at least one IADL limitation and up to two ADL limitationsðFt+1¼1Þ, more than two ADL limitations ðFt+1¼2Þ, and deathðFt+1¼3Þ. The specification of the health production function, written in log odds relative to no limitations in function, is
ln PrðFt+1¼fÞ
The dynamics of health are captured, in part, by the dependence of one’s functional status next period on endogenous values of her functional status in the current periodðFtÞ. The occurrence of health shocks each periodðStÞalso influence functionality transitions, and these shocks may be different if the shock captures the onset of a chronic condition
Sk t ¼1;E
k t ¼0
or a complication associated with a chronic condition Sk t ¼1; Ek
t ¼1Þ. Additionally, health transitions are dynamic because they depend on medical care consumption in the current period. We also include interactions of functional status and current health shocks with each type of care to allow for a different productive effect of medical care at different levels of health. Theory suggests that health production depends on the amount of medical care used and not expenditures per se (Grossman 1972). That is, consumption of medical care—not expenditures on medical care— improves, restores, or limits further deterioration in the health stock. Because we model total consumption in dollars, we are able to include indicators of any use, but also examine the role of expenditures. We also include interactions of each medical care type with the other types of care to measure complementarities in input allocation. This Grossman-like dynamic health production function is essential for linking current consumption with fu-ture health (and indirectly, fufu-ture insurance choices and medical care use) and thus appro-priately predicting net costs of expanded drug coverage.
5. Initial Conditions
of the initial equations and the estimated likelihood function are provided in the Ap-pendix. There we also provide more detail about the joint estimation procedure.
In summary, our empirical model, consisting of a jointly estimated set of equa-tions, has five key features: (1) observed supplemental plan and drug coverage deci-sions depend on unobserved individual characteristics that also influence the demand for all forms of medical care (endogenous insurance coverage, adverse selection); (2) current consumption of different types of medical care may be correlated (joint es-timation of medical care demand equations); (3) medical care demand and insurance decisions are determined by both the stock and the flow of health (joint estimation of general health and health shocks); (4) current medical care consumption influences future health, which, in turn, determines future consumption (joint estimation of en-dogenous medical care inputs and health outcomes); and (5) past medical care con-sumption influences current concon-sumption partially through pathways other than health (direct effects of lagged behavior).
C. Identification
Identification in this system of dynamic equations follows the arguments of Bhargava and Sargan (1983) and Arellano and Bond (1991). Estimation of dynamic equations with panel data requires exogeneity of some of the explanatory variables conditional on the unobserved individual heterogeneity. As such, all lagged values of exogenous variables serve to identify the system. These includeZtI,ZtH, andZtM, as well as time-varying individual characteristics inXt. Similarly, conditional on the unobserved het-erogeneity (mandvt), lagged values of the endogenous variables also aid identification assuming there is no serial correlation in the remaining errors. Additionally, we include exogenous variables in the reduced-form specification of the initial conditions that do not independently affect the dynamic demand and health outcome equations. These in-clude heightðR0Þ, which proxies for health during childhood, and periodt¼0 values of the exogenous time-varying identifying variablesðZ0Þ. (See the Appendix for specifi-cation of the initial condition equations.) Height is jointly significant in the initial con-dition equations, and is insignificant when included in the main equations.
Our specification of the permanent and time-varying unobserved individual het-erogeneity also serves to identify the system, allowing all laggedi.i.d.errors to in-dependently influence current behavior (for example, through inclusion of lagged health in the expenditure equations or the inclusion of current medical care inputs in subsequent health outcomes). That is, observed values of endogenous variables en-ter those equations rather than predicted values as in two-stage techniques that deal with endogeneity of explanatory variables. Finally, the functional forms of the equa-tions are not linear in each circumstance, and hence identification is further enhanced by the nonlinear nature of the specification. This nonlinearity of the initial condition equations also reduces the number of identifying variables needed for identification.
VI. Data
in two major parts—the survey files and the event files. Each respondent is inter-viewed three times a year and followed for multiple years. At the first interview, the respondent answer questions about demographics, health insurance, and health status. At the end of each year, usually between September and December, the re-spondent re-answers questions about health status in order to document changes in health. The event files link Medicare claims to survey-reported medical events and provide date, charge, and source of payment information about each inpatient, out-patient, medical provider, nursing home, home health, and hospice event during the year. Charge and payment information for each prescription or refill is also recorded, but the exact date of each prescription or refill is not available.
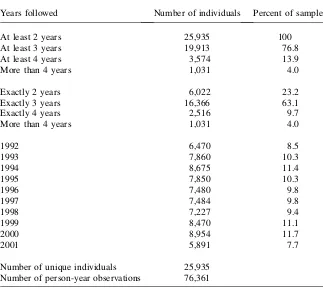
Our study uses the MCBS files from 1992 to 2001. As part of a longitudinal sur-vey, the respondents are followed for several years. This longitudinal feature makes it possible to estimate the effect of drug use in one year on subsequent health outcomes and medical care use in the next year. Additionally, new elderly individuals (age 65 and older) are brought into the sample each year ensuring a representative cross-sectional sample composition. However, not all of the respondents are observed for the same number of years. Respondents in early years of the survey were fol-lowed for five years; more recent participants were folfol-lowed for three years. Differ-ences in length of participation are due to sample design and death; there is relatively little attrition due to nonresponse.
Of the 28,906 elderly individuals surveyed between 1992 and 2001, 2,941 were dropped because they were either continuously enrolled in a nursing home, or en-tered a nursing home during the period of observation.13Because expenditures on prescription drugs are not available from the MCBS for people who lived in long-term care facilities, we do not include them in analysis. Table 1 details information on our research sample of 25,935 men and women who contribute 76,321 person-year observations to the analysis.
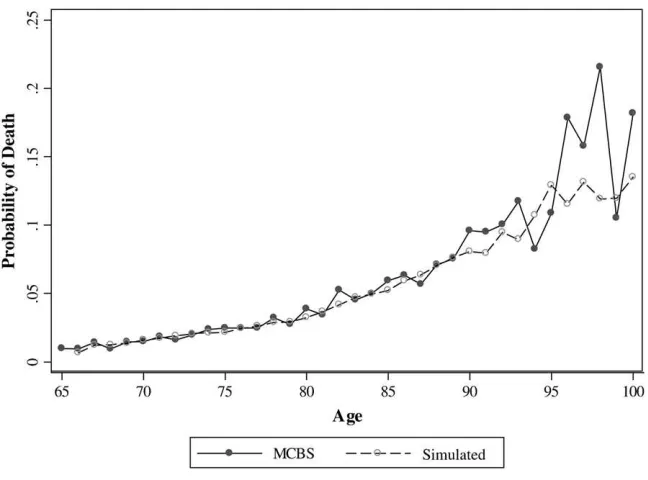
Measurement of a person’s general health should reflect true health as accurately and broadly as possible. Rather than use subjective self-reported health, we select the more objective measures of functional status and chronic conditions. In the MCBS, a survey of functional status is conducted between September and December in every calendar year. About 40 percent of the sample respondents report some functional limitation at some point during the survey period. Almost 30 percent report moderate disability measured by difficulty with at least one Instrumental Activity of Daily Liv-ing (IADL) and with no more than two Activities of Daily LivLiv-ing (ADL). Severe dis-ability, measured by difficulty with three or more ADLs, affects about 10 percent of the sample. Death rates average about 5 percent and rise with age (Figure 2) and de-terioration in health. Table 2 details one-year functional status transitions of the el-derly over the sample period. This table highlights the extent of movement across disability categories; obviously the transition rates differ by age and other
characteristics. About 40 percent of the elderly remain in a given disability state from one year to the next. However, transitions to poorer health are common. Death, for example, is more probable as functional limitations increase with 14 percent of the severely disabled dying in a given year. Interestingly, the incidence of health im-provement is also significant. Almost 20 percent of the sample experiences improved functionality from one year to the next.
At the initial interview, individuals report whether they have ever had particular chronic conditions; these include cardiovascular or cerebrovascular disease, respira-tory disease, cancer, or diabetes. In each year surveyed, the individual may experience medical claims associated with these diseases and identified in the claims-based event files by ICD-9 codes. We define such claims to indicate a particular health shock in that year. Hence we are able to capture both the onset of chronic conditions as well as complications associated with existing conditions. Case and Paxson (2005) find that differences in morbidity and mortality across genders can be explained by differences in the distribution of chronic conditions. Table 3 summarizes the probability of health shocks conditional on ever experiencing a particular chronic condition.
Table 1
Empirical Distribution of Sample Participation in MCBS, 1992–2001
Years followed Number of individuals Percent of sample
At least 2 years 25,935 100
At least 3 years 19,913 76.8
At least 4 years 3,574 13.9
More than 4 years 1,031 4.0
Exactly 2 years 6,022 23.2
Exactly 3 years 16,366 63.1
Exactly 4 years 2,516 9.7
More than 4 years 1,031 4.0
1992 6,470 8.5
1993 7,860 10.3
1994 8,675 11.4
1995 7,850 10.3
1996 7,480 9.8
1997 7,484 9.8
1998 7,227 9.4
1999 8,470 11.1
2000 8,954 11.7
2001 5,891 7.7
Number of unique individuals 25,935
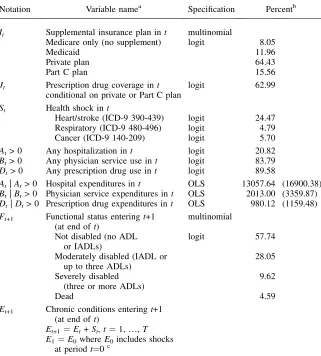
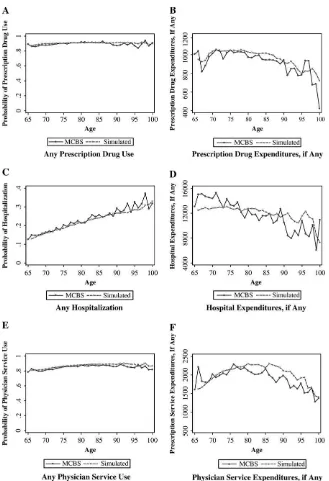
Table 4 describes the distribution of dependent variables, along with notation and specification of each equation in the set of jointly estimated equations. The sour-ces of major supplemental insurance for Medicare beneficiaries are Medicaid, employer-provided and privately purchased insurance (private plans), and the Medicare managed care options (Part C plans). In order to measure the effect of third-party coverage of drugs, we distinguish private and Part C plans by whether or not the plan offers outpatient prescription drug coverage. About 13 percent of the Medicare-covered sample respondents were dually Medicare-covered by Medicaid, which covers prescrip-tion drug medicaprescrip-tion. Almost 50 percent of the sample respondents received some other form of supplemental insurance with a drug benefit. Yet, over one-third of the elderly have no prescription drug coverage.
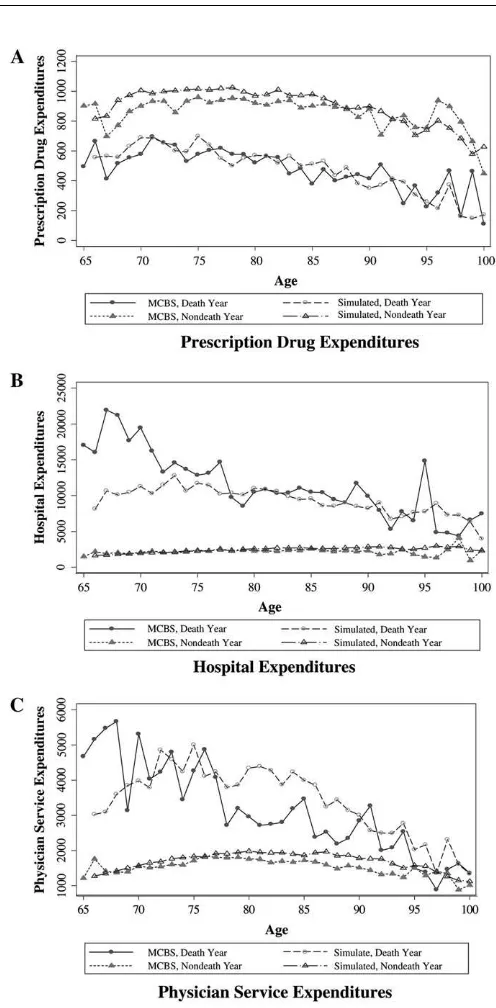
The average annual outpatient prescription drug expenditure (conditional on any) was $980 over the 1992–2001 period.14Although the observed probability of pre-scription drug use by age is nearly constant, expenditures, if any, gradually fall with age (Figure 3a and 3b).15This simple graph illustrates the complex relationship tween medical care use and age. One might expect expenditures to rise with age be-cause health is likely to be deteriorating. However, those individuals who survive to Figure 2
Actual and Simulated Annual Mortality Rates, by Age
14. We adjust all expenditures and income in the sample to year 2001 dollars using the Consumer Price Index.
older ages may be healthier reflecting a negative relationship between medical care expenditures and age among survivors.
Figures 3c and 3d illustrate a similar age pattern for Part A hospital expenditures (conditional on any) with an average of $13,058 per year. However, the probability of hospitalization increases dramatically with age from around 12 percent at age 65 to over 30 percent at ages above 90. The lower average hospital expenses as individu-als’ age suggest that the stays of older patients may be shorter than those of younger patients. This may be due to higher death rates or reflect the less aggressive treatment of those who are hospitalized at older ages. Use of Part B physician services is uni-form by age, as shown in Figures 3e and 3f, but annual expenditures by age exhibit an inverted U-shaped pattern. On average, these expenditures, if any, are $2,013.
It is well known that a large proportion of elderly health care expenditures in the United States is consumed by individuals in their last year of life (Yang et al. 2003; Table 2
Functional Status Transitions
Functional status in yeart+1 (Ft+1)
Observed one-year functional status transitions
Not disabled
Moderately disabled
Severely disabled Die
Functional status in yeart(Ft)
Not disabled (no ADL or IADL) 0.81 0.15 0.02 0.02
Moderately disabled (IADL or up to three ADLs)
0.26 0.57 0.11 0.06
Severely disabled (three or more ADLs) 0.06 0.24 0.56 0.14
Dead 0.00 0.00 0.00 1.00
Table 3
Health Shocks and Chronic Conditions
Health shock during yeart(St) Probability of health shock (conditional
on existing chronic conditions)a Heart/stroke Respiratory Cancer
Chronic condition entering yeart(Et)
Heart/stroke (ICD-9 390-439) 0.38 0.06 0.06
Respiratory (ICD-9 480-496) 0.32 0.20 0.07
Cancer (ICD-9 140-209) 0.27 0.18 0.06
Diabetes (ICD-9 250) 0.33 0.05 0.06
None 0.01 0.05 0.08
Stearns and Norton 2004). Figure 4 illustrates, by age, the higher average annual expenditures for hospital and physician services among those in their death year than among those who do not die that year. The differences are more striking for individuals who die at earlier ages. Interestingly, outpatient prescription drug use is lower for those who die relative to survivors. People who die have fewer days within the calendar year Table 4
Description of Endogenous Variables
Notation Variable namea Specification Percentb
It Supplemental insurance plan int multinomial
Medicare only (no supplement) logit 8.05
Medicaid 11.96
Private plan 64.43
Part C plan 15.56
Jt Prescription drug coverage int logit 62.99
conditional on private or Part C plan St Health shock int
Heart/stroke (ICD-9 390-439) logit 24.47 Respiratory (ICD-9 480-496) logit 4.79
Cancer (ICD-9 140-209) logit 5.70
At> 0 Any hospitalization int logit 20.82
Bt> 0 Any physician service use int logit 83.79
Dt> 0 Any prescription drug use int logit 89.58
At|At> 0 Hospital expenditures int OLS 13057.64 (16900.38)
Bt|Bt> 0 Physician service expenditures int OLS 2013.00 (3359.87)
Dt|Dt> 0 Prescription drug expenditures int OLS 980.12 (1159.48)
Ft+1 Functional status enteringt+1 (at end oft)
multinomial
Not disabled (no ADL or IADLs)
logit 57.74
Moderately disabled (IADL or up to three ADLs)
28.05
Severely disabled (three or more ADLs)
9.62
Dead 4.59
Et+1 Chronic conditions enteringt+1 (at end oft)
Et+1¼Et+St,t¼1,.,T
E1¼E0whereE0includes shocks at periodt¼0c
a. The statistics describe the distribution of dependent variables in the set of jointly estimated equations. These variables also serve as endogenous right-hand side variables.
Figure 3
Figure 4
to consume drugs and may be hospitalized more days out of the year (and receiving inpatient drug treatment) than individuals who survive the entire year.
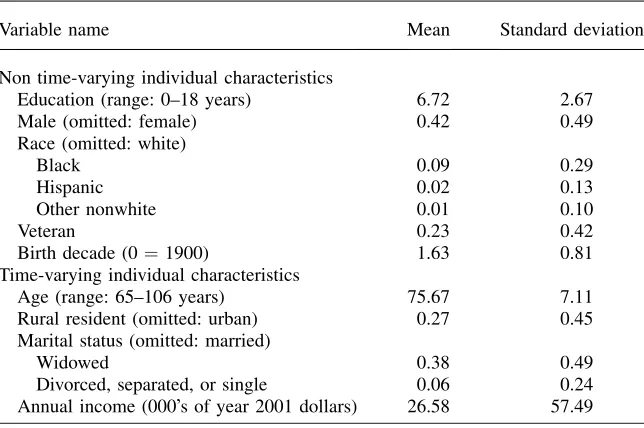
Table 5 summarizes the individual variables used to explain insurance selection, medical care demand, health shocks, and functional status transitions. In addition to these exogenous variables, the dependent variables defined in Table 4 serve as en-dogenous explanatory variables in relevant equations. We also include additional ex-ogenous variables that help identify variations in the decision variables and health outcomes (Table 6). Some of these variables capture variation in the supply and price of insurance and medical care during our sample period. Managed care penetration (or number of HMOs enrollees per capita) reflects availability of different types of insurance coverage as well as prices of medical care services in particular markets (for example, lower (negotiated) prices of medical care services in areas of high managed care concentration). The Area Resource File provides the adjusted average per capita cost (AAPCC) rates for Medicare services, which are based on projected average county-level fee-for-service spending for each upcoming year. The AAPCC rates were used to set Medicare reimbursement rates prior to the Balanced Budget Act of 1997. We obtain average retail prescription drug prices that vary by state and year. We also include an indicator of whether the elderly person lives within 100 miles of the Canadian or Mexican borders since drugs are relatively cheaper in these non-United States locations. The number of physicians, hospitals, and hos-pital beds per 1,000 elderly by county and year, also obtained from the Area Re-source File, reflect variations in medical care supply conditions. We include the Environmental Protection Agency’s measure of median air quality by county and Table 5
Description of Exogenous Individual Variables
Variable name Mean Standard deviation
Non time-varying individual characteristics
Education (range: 0–18 years) 6.72 2.67
Male (omitted: female) 0.42 0.49
Race (omitted: white)
Black 0.09 0.29
Hispanic 0.02 0.13
Other nonwhite 0.01 0.10
Veteran 0.23 0.42
Birth decade (0¼1900) 1.63 0.81
Time-varying individual characteristics
Age (range: 65–106 years) 75.67 7.11
Rural resident (omitted: urban) 0.27 0.45
Marital status (omitted: married)
Widowed 0.38 0.49
Divorced, separated, or single 0.06 0.24
Description of Exogenous Identifying Variables
Role Variable name
Source of
variation Mean
Standard deviation
Availability/price of insurance Percent of county HMO enrolled; HMO
penetrationa county, year 18.91 14.14
Price of hospitalization Medicare AAPCC part A rateb county, year 350.07 230.75 Price of physician services Medicare AAPCC part B rateb county, year 226.56 140.53 Price of prescription drugs Average prescription drug retail pricec state, year 41.01 5.49 Price of prescription drugs Reside within 100 miles of Canadian or
Mexican borderd zip code, year 0.17 0.37
Supply of physicians Number of physicians / 1000 elderlyb county, year 18.01 14.26 Supply of hospitals Number of hospitals / 1000 elderlyb county, year 0.18 0.18 Supply of hospital beds Number of hospitals beds / 1000 elderlyb county, year 30.52 22.12
Exogenous shift in health Median air quality indexe county, year 34.79 11.04 Exogenous variable in initial conditions Initial height in inches individual 65.67 3.99
a. We thank Lawrence Baker for measures of HMO penetration per county.
b. The projected average county-level fee-for-service spending for the coming year, or adjusted average per capita cost (AAPCC) rates, were used to set Medicare re-imbursement rates prior to the Balanced Budget Act of 1997. These values and the physicians, hospital, and bed supply numbers are from the Area Resource Files. c. Drug prices are the total value of drug costs divided by the total number of drugs sold in a particular state and year.
d. Distance to border is calculated using zip code centroids and North America Equidistant Conic map projections.
e. The median air quality index is reported for counties by the Environmental Protection Agency. Higher values indicate worse air quality.
Y
ang,
Gilleskie,
and
Norton
year, where increasing values of the index indicate lower air quality, to capture changes in exogenous measures that may influence health.
V. Discussion
Using the MCBS panel data we jointly estimate our model of elderly health behavior over time. The complexity of this dynamic system of demand equations and health production with its feed-forward structure suggests analysis of the estima-tion results on several levels. In Secestima-tion VA, we discuss the signs and significance of the main explanatory variables of interest in each equation, which qualitatively describes the short-run effects.16We also compare our results to those from estimation of single equations where we do not account for the endogeneity of important lagged choices or outcomes such as insurance, medical care inputs, and health on subsequent behavior. In Section VB, we discuss results from a five-year simulation of the system of jointly estimated equations in order to illustrate the influence of particular variables in the long run, taking into account changes in health status and mortality over time.
A. Estimation Results
1. Effects of insurance on medical care demand
We begin by discussing the effect of insurance on prescription drug consumption be-cause this relationship is at the heart of our analysis. In our preferred model (that is, the jointly estimated set of correlated equations henceforth labeled multiple equa-tions with unobserved heterogeneity), drug coverage, and supplemental insurance of any kind, has a significant positive effect on both whether a person uses any pre-scription drugs (Table 7a, second column) and the log of expenditures for those who use any (Table 7a, fourth column). The signs of coefficients on other variables are generally in the expected direction, with current health shocks, functional limita-tions, and existing chronic conditions each increasing use of and expenditures on pre-scription drugs. Interestingly, individuals experiencing cancer-related health shocks in the current period are less likely to use drugs and spend less on drugs.
Drug coverage, specifically, has little influence on the probability or (log) level of hospital expenditures (Table 7b, second and fourth columns). However, a Medicare Part C plan is associated with a greater probability of hospitalization, but lower expenditures among those with any inpatient stay. Health shocks have a large posi-tive effect on hospital services consumption. Disability and existing chronic condi-tions are associated with more hospital care. Supplemental insurance coverage by Medicaid or private plans is positively related to physician services consumption, while the Part C plans are associated with lower consumption of physician services (Table 7c, second and fourth columns). This relationship supports the efforts by man-aged care organizations to reduce medical care costs among its members through early detection and controlled spending. The influences of current health shocks, dis-ability, and existing chronic conditions are positive and significant.
Parameter Estimates for Selected Variables Explaining Prescription Drug Expenditures
Any Prescription Drug Use Prescription Drug Expenditures, if any
Selected variables
Single equation without unobserved
heterogeneity
Multiple equations with unobserved
heterogeneity
Single equation without unobserved
heterogeneity
Multiple equations with unobserved
heterogeneity
Supplemental insurance in yeart
Medicaid 0.407 (0.082)** 0.318 (0.089)** 0.210 (0.026)** 0.158 (0.027)** Private plan without Rx coverage 0.326 (0.067)** 0.345 (0.102)** 0.093 (0.023)** –0.017 (0.032) Private plan with Rx coverage 0.377 (0.066)** 0.462 (0.148)** 0.353 (0.023)** 0.168 (0.046)** Part C plan without Rx coverage 0.362 (0.122)** 0.445 (0.131)** 0.059 (0.041) 0.065 (0.042) Part C plan with Rx coverage 0.713 (0.078)** 0.857 (0.093)** 0.121 (0.026)** 0.106 (0.029)** Health shocks during yeart
Heart/stroke 1.088 (0.069)** 0.780 (0.071)** 0.262 (0.013)** 0.202 (0.013)** Respiratory 0.559 (0.140)** –0.149 (0.146) 0.139 (0.026)** –0.044 (0.027) Cancer 0.316 (0.101)** –0.196 (0.106)* 0.041 (0.023)* –0.069 (0.024)** Functional status entering yeart
Moderately disabled 0.202 (0.049)** 0.244 (0.052)** 0.272 (0.013)** 0.278 (0.013)** Severely disabled 0.047 (0.080) 0.083 (0.084) 0.307 (0.019)** 0.319 (0.020)** Chronic conditions entering yeart
Heart/stroke 0.632 (0.044)** 0.693 (0.048)** 0.355 (0.012)** 0.373 (0.012)** Respiratory 0.332 (0.066)** 0.448 (0.071)** 0.228 (0.015)** 0.263 (0.015)**
Cancer 0.060 (0.053) 0.073 (0.056) 0.013 (0.014) 0.025 (0.014)*
Diabetes 0.668 (0.064)** 0.673 (0.067)** 0.360 (0.013)** 0.356 (0.013)** (continued)
Y
ang,
Gilleskie,
and
Norton
Table 7a (continued)
Any Prescription Drug Use Prescription Drug Expenditures, if any
Selected variables
Single equation without unobserved
heterogeneity
Multiple equations with unobserved
heterogeneity
Single equation without unobserved
heterogeneity
Multiple equations with unobserved
heterogeneity
Medical care use last yeart-1
Any hospitalization 20.358 (0.061)** 20.394 (0.064)** 0.058 (0.014)** 0.054 (0.014)** Any physician service use 0.567 (0.046)** 0.648 (0.049)** 0.196 (0.018)** 0.208 (0.019)** Any prescription drug use 2.994 (0.040)** 3.220 (0.048)** 1.711 (0.026)** 1.778 (0.026)** Unobserved heterogeneity
Loading ron permanent factorm —— –0.075 (0.136) —— 0.180 (0.041)**
Loading von time-varying factoryt —— 2.474 (0.085)** —— 0.876 (0.026)**
Note: Standard errors are in parentheses. ** indicates significance at the 5 percent level; * 10 percent level.
Additional explanatory variables include exogenous individual characteristics (Table 5), relevant identifying variables (Table 6), and year indicators.
The
Journal
of
Human
Parameter Estimates for Selected Variables Explaining Hospital Expenditures
Any Hospitalization Hospital Expenditures, if any
Selected variables
Single equation without unobserved
heterogeneity
Multiple equations with unobserved
heterogeneity
Single equation without unobserved
heterogeneity
Multiple equations with unobserved
heterogeneity
Supplemental insurance in yeart
Medicaid 0.049 (0.059) 0.318 (0.089)** 0.027 (0.042) –0.043 (0.043)
Private plan without Rx coverage 0.065 (0.054) 0.345 (0.102)** 0.032 (0.039) –0.015 (0.051) Private plan with Rx coverage 0.012 (0.053) 0.462 (0.148)** 0.048 (0.039) 0.028 (0.071) Part C plan without Rx coverage 0.143 (0.101) 0.445 (0.131)** –0.274 (0.075)** –0.127 (0.073)* Part C plan with Rx coverage 0.301 (0.062)** 0.857 (0.093)** –0.280 (0.046)** –0.138 (0.049)** Health shocks during yeart
Heart/stroke 1.959 (0.028)** 2.289 (0.043)** 0.185 (0.020)** 0.347 (0.022)** Respiratory 1.633 (0.054)** 0.631 (0.083)** 0.158 (0.028)** –0.140 (0.033)** Cancer 1.283 (0.048)** 0.880 (0.069)** 0.244 (0.028)** 0.195 (0.031)** Functional status entering yeart
Moderately disabled 0.323 (0.030)** 0.487 (0.040)** 0.032 (0.021) 0.104 (0.023)** Severely disabled 0.649 (0.042)** 0.976 (0.057)** 0.069 (0.028)** 0.210 (0.029)** Chronic conditions entering yeart
Heart/stroke –0.077 (0.029)** 0.087 (0.037)** 0.018 (0.021) 0.082 (0.022)** Respiratory –0.060 (0.036) 0.261 (0.048)** 0.001 (0.024) 0.139 (0.026)**
Cancer –0.017 (0.032) 0.147 (0.042)** –0.011 (0.022) 0.059 (0.023)**
Diabetes 0.206 (0.031)** 0.319 (0.040)** 0.056 (0.021)** 0.105 (0.023)** (continued)
Y
ang,
Gilleskie,
and
Norton
Table 7b (continued)
Any Hospitalization Hospital Expenditures, if any
Selected variables
Single equation without unobserved
heterogeneity
Multiple equations with unobserved
heterogeneity
Single equation without unobserved
heterogeneity
Multiple equations with unobserved
heterogeneity
Medical care use last yeart-11
Any hospitalization 0.674 (0.031)** 0.896 (0.041)** 0.116 (0.021)** 0.217 (0.022)** Any physician service use –0.211 (0.045)** –0.208 (0.060)** –0.078 (0.035)** –0.078 (0.034)** Any prescription drug use 0.307 (0.054)** 0.390 (0.070)** –0.015 (0.043) 0.045 (0.039) Unobserved heterogeneity
Loading ron permanent factorm — 20.233 (0.123)* — 0.002 (0.006)
Loading von time-varying factoryt — 7.481 (0.203)** — 2.803 (0.069)**
Note: Standard errors are in parentheses. ** indicates significance at the 5 percent level; * 10 percent level.
Additional explanatory variables include exogenous individual characteristics (Table 5), relevant identifying variables (Table 6), and year indicators.
The
Journal
of
Human
Parameter Estimates for Selected Variables Explaining Physician Service Expenditures
Any Physician Service Use Physician Service Expenditures, if any
Selected variables
Single equation without unobserved
heterogeneity
Multiple equations with unobserved
heterogeneity
Single equation without unobserved
heterogeneity
Multiple equations with unobserved
heterogeneity
Supplemental insurance in yeart
Medicaid 0.529 (0.071)** 0.461 (0.075)** 0.338 (0.032)** 0.211 (0.036)** Private plan without Rx coverage 0.930 (0.063)** 0.953 (0.093)** 0.271 (0.028)** 0.228 (0.042)** Private plan with Rx coverage 0.763 (0.059)** 0.818 (0.131)** 0.276 (0.028)** 0.269 (0.063)** Part C plan without Rx coverage –0.720 (0.090)** –0.704 (0.096)** –0.382 (0.057)** –0.347 (0.058)** Part C plan with Rx coverage –1.117 (0.061)** –1.100 (0.072)** –0.534 (0.036)** –0.475 (0.043)** Health shocks during yeart
Heart/stroke 2.689 (0.102)** 2.531 (0.101)** 0.946 (0.016)** 0.697 (0.015)** Respiratory 1.598 (0.188)** 1.118 (0.192)** 0.675 (0.031)** –0.132 (0.035)** Cancer 2.825 (0.243)** 2.467 (0.244)** 1.092 (0.028)** 0.620 (0.030)** Functional status entering yeart
Moderately disabled 0.053 (0.041) 0.068 (0.042) 0.195 (0.016)** 0.213 (0.016)** Severely disabled –0.006 (0.066) 0.035 (0.069) 0.339 (0.024)** 0.380 (0.024)** Chronic conditions entering year t
Heart/stroke 0.178 (0.036)** 0.190 (0.038)** 0.072 (0.015)** 0.136 (0.015)** Respiratory 0.109 (0.051)** 0.171 (0.053)** 0.160 (0.019)** 0.310 (0.020)**
Cancer 0.062 (0.045) 0.071 (0.047) 0.118 (0.017)** 0.170 (0.017)**
Diabetes 0.204 (0.045)** 0.207 (0.048)** 0.254 (0.017)** 0.242 (0.017)** (continued)
Y
ang,
Gilleskie,
and
Norton
Table 7c (continued)
Any Physician Service Use Physician Service Expenditures, if any
Selected variables
Single equation without unobserved
heterogeneity
Multiple equations with unobserved
heterogeneity
Single equation without unobserved
heterogeneity
Multiple equations with unobserved
heterogeneity
Medical care use last yeart-1
Any hospitalization 20.083 (0.052) 20.093 (0.054)* 0.311 (0.018)** 0.298 (0.017)** Any physician service use 2.323 (0.036)** 2.440 (0.040)** 0.617 (0.029)** 0.736 (0.028)** Any prescription drug use 0.758 (0.044)** 0.730 (0.046)** 0.486 (0.026)** 0.400 (0.026)** Unobserved heterogeneity
Loading ron permanent factorm — –0.042 (0.121) — –0.017 (0.054)
Loading von time-varying factoryt — 1.619 (0.094)** — 3.779 (0.029)**
Note: Standard errors are in parentheses. ** indicates significance at the 5 percent level; * 10 percent level.
Additional explanatory variables include exogenous individual characteristics (Table 5), relevant identifying variables (Table 6), and year indicators.
The
Journal
of
Human