Asian Journal of Water, Environment and Pollution, Vol. 10, No. 3 (2013), pp. 1–9.
Study of the Removal of Humic Acid, Organic Pollutant
by Water Hyacinth Plant from Aquatic Environment and
Its Effect on pH, Chlorophyll Content and Degradation
N. Nyoman Rupiasih*, Made Sumadiyasa
1and A.A. Ratnawati
Biophysics Lab., Dept. of Physics, University of Udayana, Kampus Bukit Jimbaran, Bali – 80361, Indonesia1Applied-Physics Lab., Dept. of Physics, University of Udayana, Bali – 80361, Indonesia
Received July 28, 2012; revised and accepted May 31, 2013
Abstract: Humic acid (HA) is a pollutant formed in aquatic environment. Water hyacinth (WH) is a common aquatic plant in tropical regions and easily grows in heavily polluted water. The objective of this work is to investigate the capability of WH to remove HA from aquatic environment and its effects on pH, chlorophyll (Chl) content and degradation. The absorbtion was measured using UV-Vis spectroscopy. WH was grown in various media such as distilled water (DW), river water (RW) and HA solution with different concentrations, from 12 to 60 ppm. The absorbtion of two wavelengths, 250 and 275 nm of each sample medium were recorded after 1, 3, 5 and 8 days of exposure. The difference in concentration between control and treated media was found to be signiicant (p < 0.05). The study shows that WH can absorb HA from aquatic environment and help to maintain the stable condition of their aquatic environment. HA helps in increasing the concentration of Chl-a, Chl-b and total Chl of WH leaves. HA have more effect on Chl-b. Also, it has been found that HA act as a catalyst in degradation process of Chl pigments in the aquatic environment.
Key words: Humic acid, organic pollutant, water hyacinth, chlorophyll, degradation, UV-Vis, pH.
*Corresponding Author
Introduction
There is, to date, no information available regarding humic acid (HA) pollution in inland freshwater wetlands in Bali, Indonesia. However, extensive pollution caused by various domestic and farming organic wastes, especially in rainy season has turned many small rivers into unhealthy watercourses, which may have high doses of humic substances.
Humic acid (HA) is a form of environmental organic matters (OM) that are formed during the physical, chemical and microbiological transformation process of dead tissue of animals and plants. Generally they
are classiied as natural organic pollutants though they
need to be removed from the aquatic medium.
al., 2004). HA has also been reported having capability to induce cytotoxicity for many mammalian cells and
induce growth retardation and apoptosis of ibroblasts
(Danuta et al., 2002; Kuo-Jang et al., 2003; Mei-Ling et al., 2003; Thomas et al., 2004).
Water hyacinth plant (WH) is a common aquatic plant in many tropical countries. They usually dwell mainly in the shallow regions of lakes, ponds, pools, marshes, streams, rivers etc. in which HA is present. Considering the existence of WH in the aquatic environment, it is necessary to know at what extent they are able to take up HA and what’s their contribution to the aquatic environment.
The main aim of present study was to address the paucity of information regarding the possibility of using WH to remove HA from the aquatic environment. We also aimed to identify the effect of HA on pH of media where WH lives, chlorophyll (Chl) content and degradation.
Materials and Methods
Humic Acid (HA)
Humic acid was extracted from cow dung manure using alkaline solution. The extraction and characterisation of the HA has been described elsewhere (Rupiasih and Vidyasagar, 2009).
Plant Medium Preparation
Solutions with 12, 25, 40 and 60 ppm concentrations of HA were prepared in distilled water (DW). A small bucket of 3 L capacity was used to carry out the experiment. It was kept in an open room at room temperature. Six observational groups were formed: group A: WH was kept in DW; group B: WH was kept in river water (RW); for groups C, D, E and F: WH was kept in HA solution of 12, 25, 40 and 60 ppm concentrations, respectively. For each group three samples (total nine plants) were prepared. Also six buckets, one with DW, one with RW and four with different concentrations of HA (12, 25, 40 and 60 ppm) without plants were prepared and were maintained as control, called group A-control, B-control, C-control, D-control, E-control and F-control. The total volume of the medium in each bucket was maintained as 2 L throughout the observation by adding DW in an appropriate quantity.
The Studies of Uptake of HA by Water Hyacinth Plant (WH)
Water hyacinth was collected from a pond in a village. They were cleaned up with tap water several times and rinsed with DW before transferring to the medium. The
UV-Vis absorbtion spectrum of each sample medium was recorded in two wavelengths i.e. 250 nm and 275 nm (characteristics wavelengths of HA) after 1, 3, 5 and 8 days of exposure.
Chlorophyll (Chl) Studies
A. Chlorophyll (Chl) Concentration Studies
Leaves from each group were harvested, washed with DW and then Chl was extracted using “crude method”. Around 1.4 g leaves were crushed with 60 mL of 80%
acetone and then iltered with ilter paper (Whatman
No. 1). Chlorophyll extractions were kept at 4oC for
30 minutes. These Chl extracts were iltered again
and UV-Vis absorbtion spectra were recorded using a UV-Vis spectrophotometer. The Chl-a, Chl-b and total Chl concentrations were calculated by Jeffery and Humphrey method (1995):
Chl-a (mg/L) = 11.93 E664 – 1.93 E647 (1) Chl-b (mg/L) = 20.36 E647 – 5.5 E664
Chl total (mg/L) = 27.8 E652
where E664, E647 and E652 denote absorbance at 664 nm, 647 nm and 652 nm, respectively.
B. Chlorophyll (Chl) Degradation Studies
Fresh leaves were harvested from WH that have been grown in the same pond. Leaves were washed with DW and then Chl was extracted using “crude method” which is described in part A.
A small beaker of 50 mL capacity was used to carry out the experiment. Six observational groups were
formed e.g. group I: beaker was illed with ~40 mL of extracted Chl (as a control); group II: beaker was illed with ~40 mL of extracted Chl and 2 mL of HA solution of 1 ppm concentration; group III: beaker was illed with ~40 mL of extracted Chl and 2 mL of HA solution of 3 ppm concentration; group IV: beaker was illed with ~40 mL of extracted Chl and 2 mL of HA solution of 6 ppm concentration; group V: beaker was illed with ~40 mL of extracted Chl and 2 mL of HA solution of 9 ppm concentration; and group VI: beaker was illed with ~40 mL of extracted Chl and 2 mL of HA solution
of 12 ppm concentration. There were three samples for each group. All samples were sealed and temperature
was maintained at ~4 oC. Temperature was monitored everyday using a digital thermometer with least count 0.1 oC and absorbance were recorded every two days
starting from the irst day extraction till the ninth day.
Statistical Analysis
Student’s t test for “two-tailed tests” was carried out
to determine the statistical signiicance of difference
between control and treated groups in each experiment. The differences were considered for statistical
signiicance at a value of p < 0.05.
Results
The ability of WH to absorb HA in the form of solution was evaluated in terms of absorbance of HA for the medium in which it was grown. The effects of HA on the Chl was evaluated in terms of Chl concentration and degradation.
pH Studies
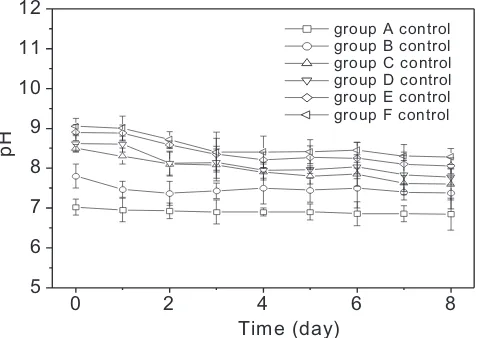
Figure 1 shows changes of pH as function of time for groups A-control to F-control (without WH). pH of medium of group A-control shows almost constant value throughout the observations. Media of groups B-control
to F-control show slight decrease in pH (~0.50) until the
third day then it remains stable. pH value was higher in the solution with higher concentration of HA.
Figure 2 shows changes of pH as function of time for groups A to F (with WH). It shows pH of group A almost constant throughout the observation. It is because DW and WH were the only constituents in the system.
pH of groups B to F show decrease ~1.0-1.50 until
the third day and then remains stable. This indicates that interaction between WH and HA medium has taken place. pH was higher in the solution with higher concentration of HA. When stabilized, the values of pH of media of groups A to F were lower compared
to the respective control media. This shows that WH helps to bring the pH of the medium towards neutral alkaline-acidic condition.
Uptake of HA by Water Hyacinth Plant (WH)
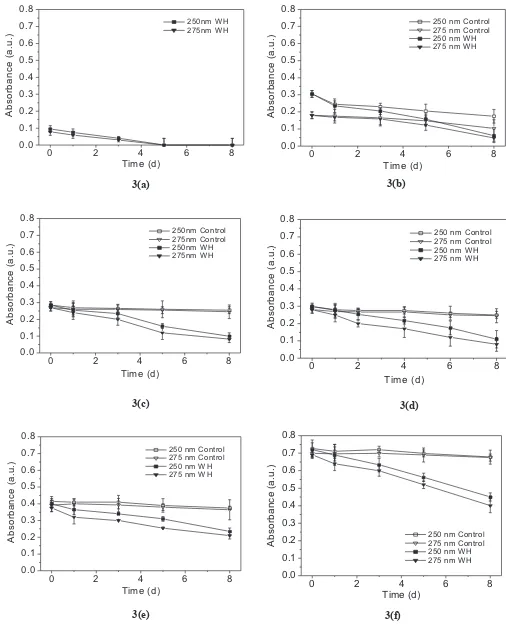
To study the uptake of HA by WH, UV-Vis absorbtion spectra in two wavelengths i.e. 250 nm and 275 nm (which are characteristics wavelengths of HA) are observed. Figure 3a shows the UV-Vis absorbtion at the two wavelengths versus time for medium group A (with
WH). The absorbance values for the irst observation
were very small and decreased with increase in time. Figures 3b-f show the UV-Vis absorbtion versus time of media groups A-control to F-control (without WH) and groups A to F (with WH). For control media (groups B-control to F-control), the absorbance values were
not signiicantly changed throughout the observations.
For media with WH (groups B to F), the absorbance values were higher than group A. The absorbance values decreased with increase in time. This indicated the low concentration of HA in the respective media which decreased with time.
Chlorophyll (Chl) Studies
Chlorophyll (Chl) Concentrations
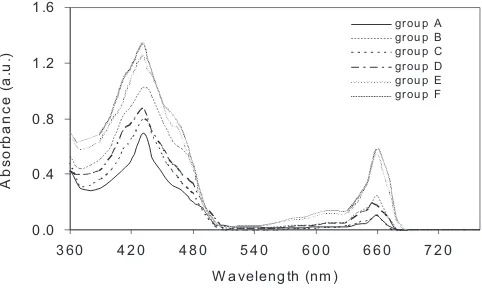
Figure 4 shows the absorbtion spectra of Chl that extracted from leaves of WH that have grown in various media such as DW (group A), RW (group B) and HA with various concentrations (12 ppm, 25 ppm, 40 ppm and 60 ppm) (groups C to F). Two major peaks were
Figure 1: pH of groups A-control to F-control (without water hyacinth plant (WH)) as function of time.
0 2 4 6 8
nm. The absorbance was higher in groups B to F as compared to group A. For groups C to F, the absorbance was increased with increase in the concentration of HA in the media from 12 to 60 ppm. There was no shift in peak positions and no appearance of any additional peak was observed for groups C to F as compared to group A.
Figure 5 shows the amount of Chl-a, Chl-b and total Chl obtained from leaves of WH harvested from groups A to F. The amount of Chl-a, Chl-b and total Chl was more in WH grown in media with HA (groups C-F) as compared to WH grown in medium without HA (group A). This is in agreement with the earlier works (Yang et al., 2004; Pouneva, 2005). The Chl content was found to increase as the concentration of HA in the medium increased from 12 to 60 ppm. The amount of Chl-a, Chl-b and total Chl for the group B is more as compared to group A. This may be because of more nutrients available in the river water.
Chlorophyll Degradations
Figure 6 shows decrease of pH of groups I to VI as a function of time. All samples show decrease in pH throughout the observations. pH values of groups II to VI were higher as compared to group I. This is because of the presence of HA in the medium.
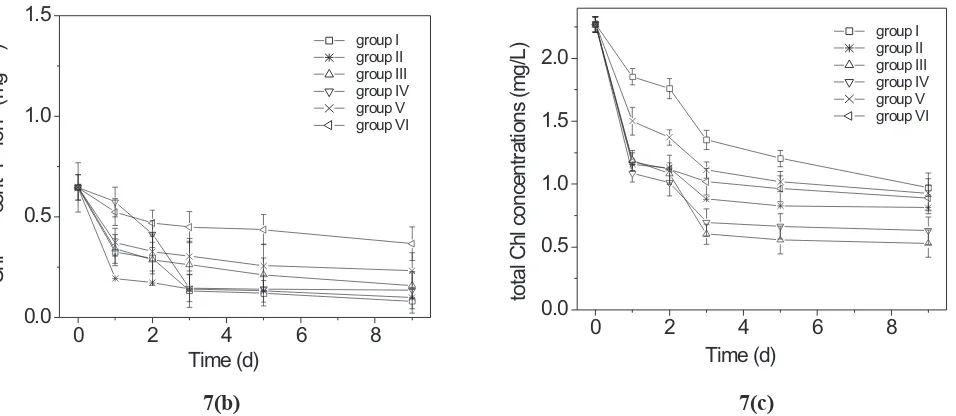
A decrease in Chl-a, Chl-b and total Chl content in groups I to VI were also obtained as shown in Figure 7. Thepercentagedecrease oftheconcentration of Chl-a, Chl-b and total Chl of groups I-VI on the 9th day are listed in Table 1. Appearance of any additional peak was not observed throughout the observations.
0 .0
W H have grown in various m edia
C hl a C hl b tot al C hl
Figure 4: UV-Vis spectra of Chl extracted from leaves of WH that have grown in various media such as
groups A to F.
Figure 5: The concentration of Chl-a, Chl-b and total Chl obtained from leaves of WH harvested from groups
Discussion
The changes of pH of medium in group B-control (without WH) (Figure 1) indicate the occurrence of some process between water, microbes and some organic compounds that were present in the river water. It also showed slight changes in the intensity of
absorbtion of the medium (~0.04) (Figure 3a). Exact
nature of the interaction was not investigated as it is beyond the scope of the present study. The changes of pH of media in groups C-control to F-control (Figure
1), in the irst three days indicate that HA interact with
DW through the redox processes (p < 0.01).
Interaction of HA with the environment in the water medium might be explained by the structure and characteristics of HA. HA are polydisperse. From a three dimensional aspect of these complexes with carbon containing compounds, HA are considered
to be lexible linear polymers that exist as random
coils with cross linked bonds. Peripheral pores in the polymer are capable of accommodating (binding)
natural and synthetic organic chemicals in a lattice type arrangement (Pettit, 2004). The carboxylic acid groups provide these molecules to chelate positive charged multivalent ions (Mg++, Ca++, Cu++, etc.). By chelating the ions, they facilitate the uptake of these ions by several mechanisms, one of which is preventing their precipitation. Another reason seems to be a direct and
positive inluence on their bioavailability (Pettit, 2004).
During this process, the redox balance in the system might have been affected due to which the changes in pH and absorbtion intensity spectra were seen.
pH in group A (with WH) (Figure 2) was stable because DW and WH were the only constituents in the system. The decrease was observed in media groups B to F (with WH). This indicates that interaction between WH and HA medium has taken place.
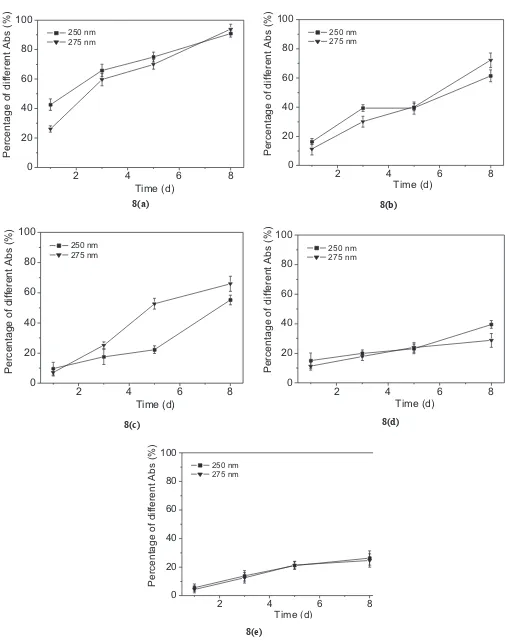
Figures 3a-f show that the intensity of absorbtion for media groups A to F decreased linearly as function of time. UV-Vis absorbtion analysis at the two wavelengths (Figures 8b-e) shows the percentage difference in from groups I to VI as function of time.
2 4 6 8
the respective controls, which increased linearly as a function of time (p < 0.05). On the 8th day, the percentage of HA uptake by WH was around 90-94% for group B; 62-72% for group C; 55-66% for group D; 29-40% for group E and 25-30% for group F. This indicates that the amount of HA taken by WH after 25 ppm is almost constant. micronutrient availability. HA may serve as a complex inorganic plant nutrient. It acts as a storehouse of N, P and S (Frank, 1996). Also as chelating agents, HA is able to chelate aquatic nutrients, improve nutrient uptake and solubilise minerals and make them easily available for the plant. HA can improve metabolism and the yield of crops.
The decrease of pH for groups I to VI as shown in Figure 6 explained that degradation of Chl have occurred in group I (control sample) as well as in groups II to VI (treated samples) as time increased. These results are also supported by the decrease in the absorbtion intensity as well as decrease in the concentrations of Chl-a, Chl-b and total Chl.
The percentage decrease in concentrations of Chl-a, Chl-b and total Chl for groups I to VI (Table 1) showed that for Chl-a and total Chl, the percentage decrease was more in groups II to VI as compared to group I whereas for Chl-b, the percentage decrease was lesser as compared to group I. These indicate that HA acts like a catalyst in the degradation process of Chl-a and total Chl. But HA inhibited the degradation process of Chl-b.
Conclusions
From absorbtion studies, it can be concluded that WH can be considered as one of the several methods to remove HA from an aquatic environment. The changes observed in pH can be explained as WH helps to maintain the stable condition in the aquatic system. HA helps in increasing the concentration of Chl-a, Chl-b and total Chl of WH leaves. HA have more effect on Chl-b. Also, it has been found that HA act as a catalyst in the degradation process of Chl pigments in the aquatic environment.
Acknowledgements
The work was inancially supported by the Ministry of
National Education, Republic of Indonesia, Fundamental Research Grant (Hibah Fundamental) which is gratefully acknowledged. The authors are also grateful to Prof. Pandit B. Vidyasagar, for the helpful discussions.
References
Aaziz Ouatmane, Valeria Dorazio, Mohamed Haidi, Jean-Claude Revel and Nicola Senesi. (2000). Elemental and spectroscopic characterization of humic acids fractionated by gel permeation chromatography. Agronomie, 20: 491-504.
Ana Rita Costa and Maria Norberta de Pinho (2005). Effect of membrane pore size and solution chemistry on the ultrailtration of humic substances solutions. Journal of Membrane Science, 255: 49-56.
Cheng-Fang Lin, Yuh-Jay Huang and Oliver J. Hao (1999). Ultrailtration Processes for Removing Humic substances: Effect of Molecular Weight Fractions and PAC Treatment. Wat. Res., 33(5): 1252-1264.
Chi-Ming Yang, Ming-Chao Wang, Yi-Feng Lu, Ing-Feng Chang and Chang-Hung Chou (2004). Humic Substances Affect the Activity of Chlorophyllase. Journal of Chemical Ecology, 30(5): 1057-1065.
Danuta Slawinska, Krzysztof Polewski, Piotr Rolewski, Patryk Plucinski and Janusz Slawinski (2002). Spectroscopic studies on UVC-induced photodegradation of humic acids. Electronic Journal of Polish Agricultural Universities, Environ. Dev., 5(2). http://www.ejpau.media.pl.
Davis, W.M., Erickson, C.L., Johnston, C.T., Delino, J.J. and J.E. Porter (1999). Quantitative Fourier transform infrared spectroscopic investigation of humic substance functional group composition. Chemosphere, 38(12): 2913-2928. Frank, K.D. and F.W. Roeth (1996). Using Soil Organic Matter
to Help Make Fertilizer and Pesticide Recommendations. In: Soil Organic Matter: Analysis and Interpretation. Soil Science Society of America Journal, Special Publication No. 46: 33.
Kui Zeng, Huey-min Hwang and Hongtao Yu (2002). Effect of dissolved humic substances on the photochemical degradation rate of 1-Aminopyrene and Atrazine. Int. J. Mol. Sci., 3: 1048-1057.
Kuo-Jang Ho, Tsung-Kwei, Liu, Tien-Shang Huang and Fung-Jou Lu (2003). Humic acid mediates iron release from ferritin and promotes lipid peroxidation in vitro: A possible mechanism for humic acid-induced cytotoxicity. Arch Toxicol, 77: 100-109.
to the treatment of water solutions containing humic substances and metal ions. Desalination, 105: 41-49. Mei-Ling Cheng, Huang-Yao Ho, Yi-Wen Huang,
Fung-Jou Lu and Daniel Tsun-Yee Chiu (2003). Humic Acid Induces Oxidative DNA Damage, Growth Retardation and Apoptosis in Human Primary Fibroblasts. The Society for Experimental Biology and Medicine, 228: 413-423. Nouzaki, K., Nagata, M., Arai J., Idemoto, Y., Kuora, N.,
Yanagishita, H., Negishi, H., Kitamoto, D., Ikegami, T. and K. Haraya (2002). Preparation of poltacrylonitrile ultrafiltration membranes for wastewater treatment. Desalination, 144: 53-59.
Pettit, Robert E. (2004). Organic matter, humus, humate, humic acid, fulvic acid and humin: Their importance in soil fertility and plant health. CTI Research.
Pouneva, I. (2005). Effect of Humic Substances on the Growth of Microalgal Cultures. Russian Journal of Plant Physiology, 52(3): 410-413.
Rupiasih, N.N. and P.B. Vidyasagar (2009).Analytical Study of Humic Acid from Various Sources Commonly Used as Fertilizer: Emphasis on Heavy Metal Content. International Journal of Design & Nature and Ecodynamics, 4(1): 32-46.
Shui-Wen Chang Chien, Chun-Chia Huang and Min-Chao Wang (2003). Analytical and spectroscopic characteristics of refuse compost-derived humic substances. Int. J. Appl. Sci. Eng., 1(1): 662-671.
Thomas Meinelt, Kurt Schreckenbach, Klaus Knopf, Andreas Wienke, Angelika Stüber and Christian E.W. Steinberg (2004). Humic substances affect physiological condition and sex ratio of swordtail (Xiphophorus helleri Heckel). Aquat. Sci., 66: 239-245.
9ROXPH 1XPEHU 2FWREHU±'HFHPEHU
&RQWHQWV
(GLWRULDO L
6QDSVKRW LL
6WXG\RI*URXQGZDWHU4XDOLW\LQ(O.KDUJD2DVLV:HVWHUQ'HVHUW(J\SW
+6-DKLQDQG6(*DEHU (QYLURQPHQWDO$XGLWLQJIRU6XVWDLQDEOH'HYHORSPHQWRI,QGLDQ,QGXVWULHV
'37ULSDWK\ %LRORJLFDO'HQLWULILFDWLRQRI*URXQG:DWHU8VLQJ9DULRXV&DUERQ6RXUFHVE\3VHXGRPRQDV
)OXRUHVFHQVDQG3VHXGRPRQDV6WXW]HULLQD+HWURWURSKLF'HQLWULILFDWLRQ5HDFWRU
$UFKQD5&6REWLDQG6.6KDUPD +\GURJUDSK\RI'KDND&LW\&DWFKPHQWDQG,PSDFWRI8UEDQL]DWLRQRQ:DWHU)ORZV
$5HYLHZ
$000DUXI+RVVDLQDQG6KDILTXU5DKPDQ :HOO'ULQNLQJ:DWHU)OXRULGH&RQWHQWDQG'HQWDO)OXRURVLVLQ$O%XWDQD5HJLRQRI
&HQWUDO6XGDQ
+DJR0$EGHO0DJLG$EGHOPRQHP0$EGHOODKDQG1DGLD$<DKLD $VVHVVLQJ'URXJKW6FHQDULRRYHU,QGLDGXULQJ0RQVRRQ±$Q$SSURDFK%DVHGRQ
6WDQGDUGL]HG3UHFLSLWDWLRQ,QGH[
-D\DQWD6DUNDU6DW\DMLW'DWUH*DQHVK7KRUDW6'*RUHDQG$MLW7\DJL $QDO\VLVRI%DFWHULRORJLFDO4XDOLW\RI'ULQNLQJ:DWHU6DPSOHVIURP&KHUWKDOD7DOXN
.HUDOD,QGLD
53UDWDS&KDQGUDQ..LUDQ'LEX'LYDNDUDQDQG3.3UDMLVKD %LRFRQYHUVLRQRI3RXOWU\DQG)LVK:DVWHE\/XFLOLD6HULFDWDDQG6DUFRSKDJD&DUQDULD
/DUYDH
%UDYHUPDQ<HKXGD8UL0DUFKDLP/DULVD*ODWPDQ9ODGLPLU'UDENLQ
$OH[H\&KL]RY*LQ]EXUJ.RVWD<0XPFXRJOXDQG$OH[DQGHU*HOPDQ
$VVHVVPHQWRI+HDY\0HWDO&RQWDPLQDWLRQDQG,WV,QGH[LQJ$SSURDFKIRU3RQG:DWHULQ $QJXO'LVWULFW2ULVVD,QGLD
5L]ZDQ5H]DDQG*XUGHHS6LQJK 6RXQGVFDSHRI%KDGUDN7RZQ,QGLD$Q$QDO\VLVIURP5RDG7UDIILF1RLVH3HUVSHFWLYH
6KUHHUXS*RVZDPL
6KRUW1RWHV
6RIWHQLQJRI+DUG:DWHUE\%HQWRQLWH0LQHUDO
$VKRN.XPDU-KD$UXQ.XPDU-KD$UXQ.XPDU0LVKUD9LQHHWD.XPDULDQG%0LVKUD &RUUHODWLRQEHWZHHQ3K\VLFRFKHPLFDO:DWHU3DUDPHWHUV8VLQJ5HJUHVVLRQ$QDO\VLV$&DVH
6WXG\RI5LYHU5DP*DQJDDW0RUDGDEDG,QGLD
$QLPHVK$JDUZDO0DQLVK6D[HQDDQG0HJKD$JDUZDO