International Conference on Ethics of Business, Economics, and Social Science || 43
THE PRACTICE OF MANDATORY DISCLOSURE IN INDONESIA:
DETERMINANTS AND IMPACT
Andian Ari Istiningrum1
1Sekolah Tinggi Energi dan Mineral (STEM Akamigas), Indonesia Email: [email protected]
Abstract
The primary objective of this research is to determine the factors that have association with mandatory disclosure and stock return. This research investigated 47 manufacturing companies listed in the Indonesia Stock Exchange in 2012. Mandatory disclosure in this research used items required to be disclosed under IAS 16 and IAS 17. The data analysis used the path analysis by setting two structural equation models. The research proved a significantly positive association of company age with mandatory disclosure in contrast to company size and company profitability. Moreover, company size, company profitability, and mandatory disclosure have a significant positive association with stock return.
Keywords: Stock Return, Mandatory Disclosure, Company Age, Company Size, Profitability
INTRODUCTION
Globalization drives investors to make investment and capital allocation decisions to many foreign companies. It is necessary for the investors to diversify their portfolio risk by investing their funds to the international markets. This then leads to a significant increasing number of investors that hold both equity and debt securities of foreign companies (Kieso, Weygandt, & Warfield, 2011). Globalization also provides benefits for the companies to raise funds. The companies have a lot of flexibilities to choose the place to issue equity and debt securities.
To make a good investment decision, investors need a relevant and faithful financial statement. This can be achieved if financial statements among companies in the world can be compared. Therefore, it is important to have a high quality international accounting standards used by countries in the world. The International Accounting Standard Board (IASB), as an international standard-setting organization, issued International Financial Reporting Standards (IFRS) that are used by most foreign companies. IFRS now have been already implemented by more than 12.000 public companies in over 100 countries (Tomaszewski & Showerman, 2010).
Started from 1 January 2012, all foreign and domestic companies listed in the Indonesia Stock Exchange must implement IFRS in preparing financial statements.
The full disclosure of information is deemed necessary for the investors to make capital allocation decision. However, managements basically have an intention to maximize profit for their benefits. Managements as the preparers of financial statements have greater opportunities to achieve personal benefit, such as bonuses and incentives. To reach their goal, managements sometimes hide the information for the investors (Alanezi & Albuloushi, 2010; Darrough, 1993; Healy & Palepu, 2001). This situation will adverse the investors because there will be information asymmetry between the investors and companies. Therefore, the regulatory agencies have to force the companies to disclose the information at the minimal level with the purpose to reduce the information asymmetry between managements and investors (Cooke, 1989).
The implementation of IFRS helps the investors to have relevant and faithful information. IFRS requires the companies to enhance transparency by disclosing more qualitative and quantitative information to the investors. The extent of disclosure asked by IFRS closes to the extent of full disclosure so the level of information asymmetry will decrease (Cahyati, 2011). Previous study proved a negative correlation between the companies disclosing more information and the level of earning management (Bachtiar, 2003). Thus, the more the information disclosed by the companies is, the less the earning management occurred in the company will be.
The earning managements have occurred in Indonesia. Most of companies whose managements conduct earning managements in Indonesia usually have a low level of compliance to mandatory disclosure. PT Kimia Farma Tbk, for example, overstated its net income for IDR 32.668 billion. The managements of PT Kimia Farma TBK did not disclose the correct amount of net income which was only IDR 99.594 billion (Syahrul, 2002). Another example is PT Petromine Energy-the subsidiary of PT Bakrie & Brothers Tbk. This company enclosed the information regarding the purchase of fuel for IDR 1.37 trillion to AKR Corporindo, so the amount of cost of goods sold was understated (Maharani & Budiasih, 2016).
International Conference on Ethics of Business, Economics, and Social Science || 45 Mandatory disclosure significantly affects the effectiveness of capital market (Akhtaruddin, 2005) that can increase if the companies provide complete information to the investors. Mandatory disclosure helps the companies to market their shares, to increase their reputation, and to reduce agency costs (Meek, Roberts, & Grey, 1995). It also has a significant effect on company value (Popova et al., 2013). In their research, company value was measured by stock return and they found a positive and significant effect of mandatory disclosure on the stock return. Therefore, mandatory disclosure will help the investors to predict the stock return they will get later. That finding provided a significant benefit because stock return in Indonesia is difficult to predict due to the fluctuation of share prices. The stock return of manufacturing sector in Indonesia decreased 70.63% in 2008 and then increased significantly for 55.29% in 2009 (Istiningrum & Suryati, 2014). Since stock return is not stable, more researches on the antecedents of stock return, such as company size, company profitability, and company mandatory disclosure should be conducted. Even though there has been a research regarding the association between mandatory disclosure and stock return, more researches should be conducted to get more consistent result about the impact of mandatory disclosure on stock return. It is due to the fact that most researchers focus only on the association between voluntary disclosure and share price anticipation of earnings or stock return (Hussainey, Schleicher, & Walker, 2003; Healy, Hutton, & Palepu, 1999; Inchausti, 1997).
Based on the above background, this research was conducted with an aim to determine the association of company size, company age, and company profitability with mandatory disclosure and stock return. These general aims are then divided into three specific objectives as follows: (i) to determine whether company size, company age, and company profitability individually associates with mandatory disclosure, (ii) to determine whether company size, company profitability, and mandatory disclosure individually associates with stock return, and (iii) to determine whether company size, company age, and company profitability affect mandatory disclosure and as a consequence affect stock return.
LITERATURE REVIEW
Mandatory Disclosure
Globalization enhances the awareness of investors to demand relevant and faithful information. The companies should provide the information asked by the investor so that they can easily raise capital to fund their operation. Disclosure is the tool that can be used by managers to provide information to the investors. It can be classified into mandatory
disclosure and voluntary disclosure/ Nandatory disclosure is a companys obligation to
disclose a minimum amount of information in corporate reports (Owusu-Ansah, 1998). Adina & Ion (2008) added that mandatory disclosure refers to the aspects and information which must be published as a consequence of the existence of some legal or statutory stipulations, capital markets, stock exchanges commissions or accounting authorities regulations. Voluntary disclosure, meanwhile, is a provision of additional information when
mandatory disclosure is unable to provide a true picture about companys value and managers performance )Qopova et al., 2013).
Managers have an intention to maximize their wealth. To achieve that purpose, managers often make a decision to gain net income in a short period and ignore the long term
activities that maximize the investors wealth )Xolk ' Uearney- 3112*. This can be done by the managers because they have more information than the investor (Healy & Wahlen, 2000; Scott, 2000). As a result, the manager behavior will adverse the investors. Mandatory disclosure, therefore, is important to reduce the information asymmetry between managers and investors. Since the information gap between managers and investors decreases, the agency costs can be minimized.
International Conference on Ethics of Business, Economics, and Social Science || 47
Stock Return
One of the purposes of this research is to determine the association of mandatory disclosure with stock return. Stock return is the income obtained from stock investment activities (Hartono, 2010). The government policies affect stock return (Samsul, 2008). One of the government policies is in terms of the requirement for the companies to have high compliance of mandatory disclosure. In addition, managers that have a good performance are more likely to disclose more complete information. By doing this, it is expected that markets will catch this good news and give a positive reaction characterized with the increase of stock prices (Inchausti, 1997). Disclosing more information also eliminates the information asymmetry between managers and investors so it is more likely that the stock price will increase. A previous research found a positive effect of the mandatory disclosure on the stock return (Popova et al., 2013). Based on the above arguments, the hypothesis is suggested as follows:
H1 : Mandatory disclosure has a positive association with stock return.
Company Size
Company size is measured by the logarithm of total asset (Alanezi & Albuloushi, 2010; Bova & Pereira, 2012). Some big companies tend to disclose more information to the investors. Previous researches proved a positive association between company size and mandatory disclosure (Akhtaruddin, 2005; Barako, Hancock, & Izan, 2006; Cooke, 1989; Glaum & Street. 2003). The big companies have more human resources with accounting and finance backgrounds, so it is easier for them to provide mandatory disclosure and to produce a high quality financial statement. The variety in human resources also helps the big companies to manage the costs, compete with other companies, and raise fund. All these positive aspects will be disclosed by the big companies in their financial statement (Ahmed & Nicholls, 1994; Naser, 1998). The costs of providing the detailed information and the risks of competitive disadvantages are lower than the benefits the big companies gain (Arcay & Vazquez, 2005). Mandatory disclosure enables big companies to use the detailed information to make investment in acquiring fixed asset and in creating innovation )Call ' Gosters- 2;95*/ Jn addition, the benefits gained by the big companies will be a threat for the small companies (Depoers, 2000). Compared to the small companies, the big companies tend to have more strategic position in the capital market (Singhvy & Desai, 1971). Based on the above arguments, the hypothesis is suggested as follows:
H2a : company size has a positive association with mandatory disclosure.
marginal capabilities so their stock price tends to be more sensitive to the economic change. Moreover, small companies face many difficulties to grow in an unhealthy economic condition (Sugiarto, 2011). Based on the above arguments, the hypothesis is suggested as follows:
H2b : company size has a positive association with stock return
Company Age
Company age is measured by the length of the companies listed on the stock market (Alanezi & Albuloushi, 2010). The mature companies have more experiences in providing a high quality financial statement since they have already had knowledge regarding the type of information needed by the investors to make some capital allocation decisions. Thus, the longer the companies listed on the stock market, the more experiences the companies gain to meet the information asked by the investors, and the lower the costs to process and produce this kind of information (Owusu-Ansah, 1998). In addition, the mature companies are encouraged to provide complete information due to two reasons: (i) the need to have more investors, and (ii) the need to maintain reputation and credibility (Popova, et al., 2013). In contrast to the mature companies, the young companies often meet many obstacles in their process to provide complete information to the investors. Those obstacles include: (i) The lack of competitive advantages so they tend to restrict the provision of information, (ii) The high costs to get, process, and produce complete information, and (iii) The lack of track record so this creates difficulties for them to rely on public opinion (Owusu-Ansah, 1998). Based on the above arguments, the hypothesis is suggested as follows:
H3 : Company age has a positive association with mandatory disclosure
Company Profitability
Company profitability is one of company characteristics playing an important role for the investors because the profitability shows the company performance (Alanezi & Albuloushi, 2010). Company profitability can be measured by return on equity which is the net income divided by total equity (Bova & Pereira, 2012). The high profitability generated by the companies will encourage managers to disclose more information because the managers expect to get high bonuses by disclosing more information (Inchausti, 1997). Moreover, companies with high profitability tend to provide complete information to show to the investors that they have good performances. Providing complete information makes the companies with high profitability easy to get fund from the investors (Kurniawan, 2013). Based on the above arguments, the hypothesis is suggested as follows:
H4a : Company profitability has a positive association with mandatory disclosure.
International Conference on Ethics of Business, Economics, and Social Science |||| 4949 perform well during the operation and their stock prices increase. As a result, stock return will increase (Kusumo, 2011). Previous research found a positive association of profitability towards stock return (Octora, Salim, & Petrolina, 2003; Dewi, 2008; Nugraha, 2005). The higher the profitability of the company, the higher stock returns that will be received by the investors. Based on the above arguments, the hypothesis is suggested as follows:
H4b4b : Company profitability has a positive association with stock return.
METHODOLOGY
Research Model
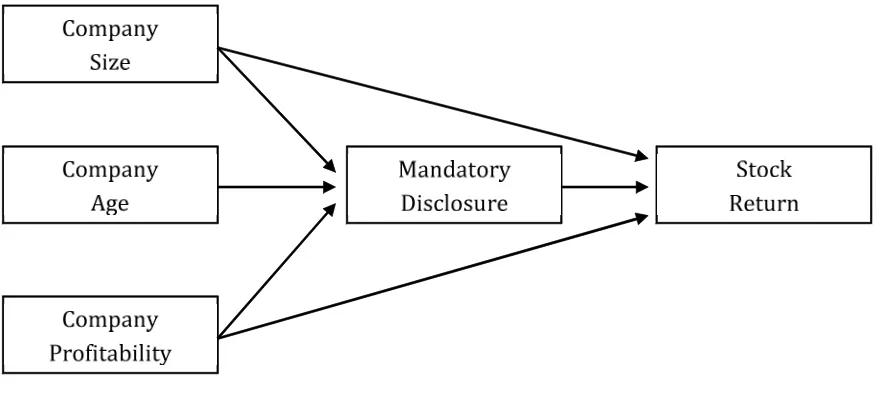
The research model to test all hypotheses in this research is shown in Figure 1.
Figure 1. Research Model
Mandatory disclosure in this research means items required by IAS 16 (fixed assed) and IAS 17 (leasing) that must be published by the companies. IAS 16 was used in this research because of the high proportion of fixed assets used in the manufacture companies; whereas IAS 17 was used for being the standard that the manufacture companies had the lowest level of compliance (Utami et al., 2012). Table 1 shows the number of items in IAS 16 and IAS 17 that must be disclosed by the companies.
Table 1. Items of Disclosure in IAS 16 and IAS 17
IAS Title Number of Items
IAS 16 Fixed Assets 2828
IAS 17 Leasing 2121
Research Variables
Population and Sample
The population used in this research was manufacture companies as listed in the Indonesia Stock Exchange in 2012. The reasons why manufacture companies were chosen as the research population included: (i) the manufacture companies tend to disclose more information to the investors, and (ii) the manufacture companies need more funds to acquire fixed assets (Utami et al., 2012). Of 129 companies as the population, 47 companies were chosen as the sample of this research. The criteria used to choose the sample was (i) the company published financial statement for the year 2012, (ii) the company distributed cash dividend for the year 2012, and (iii) the company published data related to the research variables for the year 2012. The data was gathered from the 2012 financial statement published by each company. The reason of choosing the year 2012 as a research period is that the year 2012 is the first year of the IFRS implementation in Indonesia. It was interesting to determine the level of compliance to mandatory disclosure in the first year of the implementation of international standards.
Table 2. Research Variables
Variables Type of Variable Operational Definition Stock Return Endogenous Variable (41,/ '.4520
Å &?
à &?(ý "? &?(ý while:
Pt= current stock price
Pt-1= previous stock price
Dt= current cash dividend
(Hartono, 2010;
m = actual number of relevant
disclosure items )mn*
n = number of items expected to be disclosed
(Aljifri, 2008) Company Size Exogenous Variable logarithm of total asset
(Alanezi & Albuloushi, 2010; Bova & Pereira, 2012) Company Age Exogenous Variable the length of the companies
listed on the stock market (Alanezi & Albuloushi, 2010) Company Profitability Exogenous Variable Net Income / Total Equity
International Conference on Ethics of Business, Economics, and Social Science || 51
Data Analysis
The data analysis used path analysis and IBM Statistics SPSS 19. Path analysis requires that data must meet these requirements: there is neither multicollinearity between independent variables nor heteroscedasticity, and data should meet normality and linearity assumptions. Afterwards, the model for path analysis was set. There were two structural equation models set based upon Sunyoto (2011) and Sarwono (2007) models as shown below:
Eisc ? ¥Eisc Tize , ¥Eisc Bge , ¥Eisc Qrofit, ¢1
Seturn ? ¥Seturn Tize , ¥Seturn Eisc , ¥Seturn Qrofit , ¢2
with these additional information: Size = Company Size
Age = Company Age
Profit = Company Profitability Disc = Mandatory Disclosure Return = Stock Return
The first structural equation model was developed to test H2a, H3, and H4aregarding whether company size, company age, and company profitability individually had a positive association with mandatory disclosure. The second equation model was used to test H1, H2b, and H4b regarding whether company size, mandatory disclosure, and company profitability individually had a positive association with stock return. The t-test was used to prove whether the research hypothesis was accepted or rejected. The research hypothesis is accepted if the value of significance is less than the value of alpha 0.05 (Sarwono 2007; Sunyoto 2011). Finally, the test to prove whether mandatory disclosure was an intervening variable was conducted using Sobel Test, a test to determine whether a mediator functions as an intervening variable between independent variable and dependent variable (Preacher & Leonardelli, 2006). The research hypothesis is accepted if the t value > t table = 1,65 (Ghozali, 2011). The t-value was calculated by using formulae:
3*+Å ¤+þ3*þÂ*þ3+þ Â 3*þ3+þ ; tvalue= ab/sab
with these additional information:
a = raw (unstandardized regression coefficient for the association between independent variable and mediator
b = raw coefficient for the association between the mediator and the dependant variable
sa = standard error of a sb = standard error of b
sab = error standard for indirect influence (Ghozali, 2011)
RESULTS AND DISCUSSION
Descriptive Statistics
companies is 62.40%. This means that the average of manufacture companies in the first year implementation of IFRS did not meet the criterion asked by Bapepam-Lk.
Table 3. Descriptive Statistics
Variable N Minimum Maximum Mean Deviation
Standard
Return 47 -0.90 3.55 0.1117 0.69568
Disclosure 47 0.44 0.85 0.6240 0.10666
Size 47 5.11 8.33 6.5713 0.72162
Age
The assumption tests were conducted to both the first and the second structural equation model. The first test was normality test that was conducted by using Kolmogorov-Smirnov Test. The result of normality test is shown in Table 4. It can be seen from Table 4 that the significance values for the first and the second structural equation model are higher than 0.05. Thus, normality assumptions are met.
Table 4. The Result of Normality Test
Unstandardized Residual Asymp. Sig (2-tailed)
The 1ststructural equation model 0.649
The 2ndstructural equation model 0.241
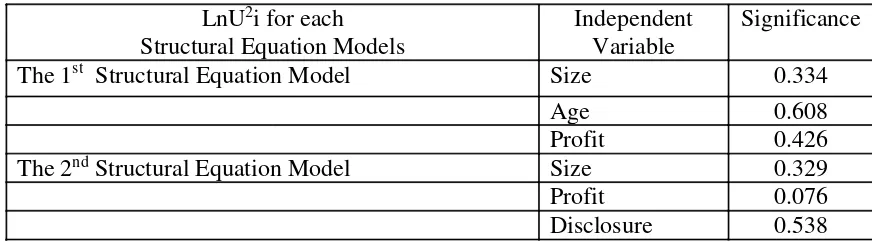
The second test is heteroscedasticity test. The test was conducted using Park Test. Table 5 shows the result of heteroscedasticity test. As shown in Table 5, no heteroscedasticity for all structural equation models since each significance value is higher than 0.05
Table 5. The Result of Heteroscedasticity Test
LnU2i for each Structural Equation Models
Independent Variable
Significance
The 1st Structural Equation Model Size 0.334
Age 0.608
Profit 0.426
The 2ndStructural Equation Model Size 0.329
Profit 0.076
Disclosure 0.538
International Conference on Ethics of Business, Economics, and Social Science || 53 independent value for both the first and the second structural equation model were less than 10. Therefore, it can be concluded that there are multicollinearity among independent variables in the first structural equation model and the second structural equation model.
Table 6. The Result of Multicollinearity Test
. Independent Variable Tolerance VIF
The 1ststructural equation model Size 0.997 1.003
Age 0.927 1.078
Profit 0.925 1.081
The 2ndstructural equation model Size 0.992 1.008
Disc 0.964 1.037
Profit 0.968 1.033
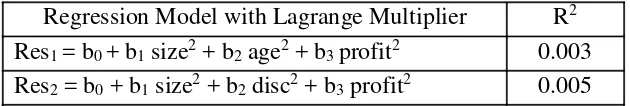
The last assumption test is linearity test conducted using Lagrange Multiplier Test. Table 7 shows the R2value for Res
1= b0+ b1size2+ b2age2+ b3profit2and Res2= b0+ b1 size2+ b2disc2+ b3profit2. For the first structural equation model, the R2= 0.003 with the amount of data was 47, so the value of x2= 47 x 0.003 = 0.141. This x2value was compared with the x2table at df51 and ¡ 1/16/ Uhe value of x2table was 55.76. Since the x2was less than the x2 table, the linearity assumption for the first structural equation model was met. Then, for the second structural equation model, the R2= 0.005 with the amount of data was 47, so the value of x2= 47 x 0.005 = 0.235. This x2value was compared with the x2table at
df51 and ¡ 1/16/ Uhe value of x2table was 55.76. Since the x2was less than the x2table, the
linearity assumption for the second structural equation model was met as well.
Table 7: Result of Linearity Test
Regression Model with Lagrange Multiplier R2 Res1= b0+ b1size2+ b2age2+ b3profit2 0.003 Res2= b0+ b1size2+ b2disc2+ b3profit2 0.005
Hypothesis Test: The First Structural Equation Model
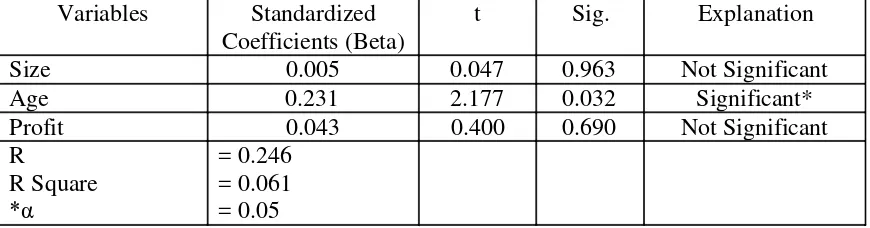
The first structural equation model was used to test H2a, H3, and H4a regarding whether company size, company age, and company profitability individually had a positive association with mandatory disclosure. Table 8 provides information regarding the result of data processing for the first structural equation model.
The first structural equation model that can be set from Table 8 is: Disc = 0.005 Size + 0.231 Age + 0.043 Profit + 0.939
It can be shown from Table 8 that the beta value for size variable was 0.005 indicating
that 1/6& variation in companies mandatory disclosure was explained by the variation in
the companies size/ Iowever- this effect was not significant since the significance value
association with mandatory disclosure. The result supports the research by Alanezi & Albuloushi (2010), Aljifri (2008), Glaum & Street (2003), Owusu-Ansah & Yeo (2005), and Popova et al. (2013). The big companies usually have more human resources with accounting and finance qualifications. However, those human resources may not ready to face the convergence of IFRS in the first year of IFRS implementation in Indonesia. IFRS requires more information to be disclosed in the financial statement (Cahyati, 2011). IAS 16 regulates that it is better for the companies to value their fixed assets by using fair value rather than historical cost. This is due to the reason that fair value reflects the truth value of fixed assets in the date of financial statement. It is necessary for the companies to have human resources that have an ability to determine the fair value of the fixed assets. Having such kind of human resources is a complex task for the companies due to the high costs to train the employees or to rent the appraisals (Cahyati, 2011). In addition, the factor that
influences Jndonesias companies to provide more disclosure in the beginning year of JGST
implementation was the time (Silviana, 2014). The human resources need more time to understand the IFRS since its paradigm is different from the previous accounting standard used in Indonesia (US GAAP). The IFRS is a principle-based standard, whereas US GAAP is a rule-based standard. The principle-based standard enables the companies to provide more relevant information that closes to the condition of the companies. However, this standard requires more professional judgments to gather the more relevant information. The
companies accountants need more time to understand and provide professional judgments-
so they can provide more disclosure regarding the fixed asset controlled by the companies (Silviana, 2014).
Table 8. Result of the First Path Analysis
Variables Standardized Coefficients (Beta)
t Sig. Explanation
Size 0.005 0.047 0.963 Not Significant
Age 0.231 2.177 0.032 Significant*
Profit 0.043 0.400 0.690 Not Significant
R
R Square
+¡
= 0.246 = 0.061 = 0.05
Table 8 reveals that the beta value for the age variable was 0.231 indicating that
34/2& variation in companies mandatory disclosure was explained by the variation in the
International Conference on Ethics of Business, Economics, and Social Science || 55 used to mandatory disclosure and the level of compliance to mandatory disclosure increases over time.
Table 8 also shows that the beta value of profitability variable was 0.043 showing
that 5/4& variation in the companies mandatory disclosure is explained by the variation in
the companies profitability/ Iowever- this effect was insignificant since the significance
value was 0.690 > 0.05. Therefore, H4awas rejected indicating that the company profitability has no association with mandatory disclosure. The result is consistent with the research from Akhtaruddin (2005), Aljifri (2008), Latridis (2008), Owusu-Ansah & Yeoh (2005), and Popova et al. (2013). The implementation of corporate governance in Indonesia requires the companies to be more transparent and disclose more information in their financial statement. There is a tendency in Indonesia that the companies with high and low profitability attempt to apply good governance by following the mandatory disclosure regulated in the accounting standard (Mintara, 2008). In addition, both companies with high and low profitability tend to provide more information. The high profitability companies are likely to disclose complete information because they want their good performance to be shown to public so that it will be easier to get fund from the investors (Kurniawan, 2013). The low profitability companies also attempt to provide more information because they will get penalized if they hide their poor performance (Popova et al., 2013).
Hypothesis Test: The Second Structural Equation Model
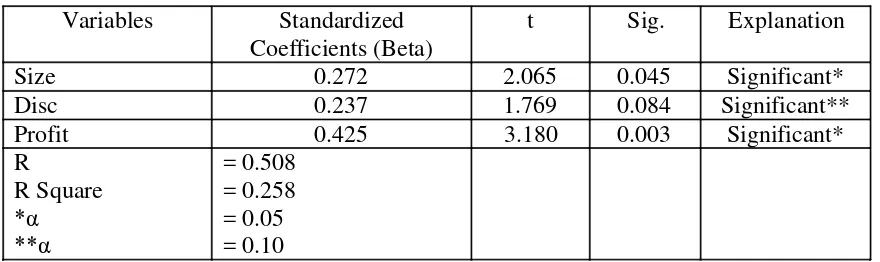
The second structural equation model was used to test H1, H2b, and H4bregarding whether mandatory disclosure, company size, and company profitability individually had a positive association with stock return. Table 9 provides information regarding the result of data processing for the second structural equation model.
Table 9: The Result of the Second Path Analysis
Variables Standardized
The second structural equation model that can be set from Table 9 is: Return = 0.272 Size + 0.237 Disc + 0.425 Profit + 0.742
As shown in Table 9, the beta value for size variable was 0.272 indicating 27.2%
variation in companies stock return was explained by the variation in the companies size/
more assets controlled by the company, the higher the stock return that will be gained by the investors. The result supports previous research from Daniel & Titman (1997), Farma et al. (1995), Sugiarto (2011), and Widyastuti (2007). The big companies usually have more resources to conduct an operation efficiently and effectively. This condition raises the stock prices and increases the stock return.
Table 9 shows that the beta value for the disclosure variable was 0.237 indicating
that 34/8& variation in companies stock return was explained by the variation in the
companies' mandatory disclosure. The effect was significant since the significance value was 0.084 < 0,10. Therefore, H1was accepted showing that the company mandatory disclosure has a positive association with stock return. The higher the level of compliance to mandatory disclosure, the higher the stock returns will be gained by the investors. The result is consistent with the research from Healy et al. (1999) and Popova et al. (2013). The information asymmetry between investors and managers reduces due to the broad mandatory disclosure provided by the companies. This will maintain the reputation of the companies, so their stock prices increase followed by the increase of the stock return.
Table 9 also reveals that the beta value of profitability variable was 0.425 showing that
53/6& variation in the companies stock return was explained by the variation in the
companies profitability/ Uhis effect was significant since the significance value was 1/114
< 0.05. Therefore, H4bwas accepted indicating that the company profitability has a positive association with mandatory disclosure. The higher the profitability of the companies, the higher the stock returns will be gained by the investors. The result is consistent with previous research from Octora et al. (2003), Dewi (2008), and Nugraha (2005). The stock prices of the companies having high profitability tend to increase due to the good performance showed by the companies. In addition, companies with high profitability often distribute the dividend to the stockholders. As a result, the stock return increases
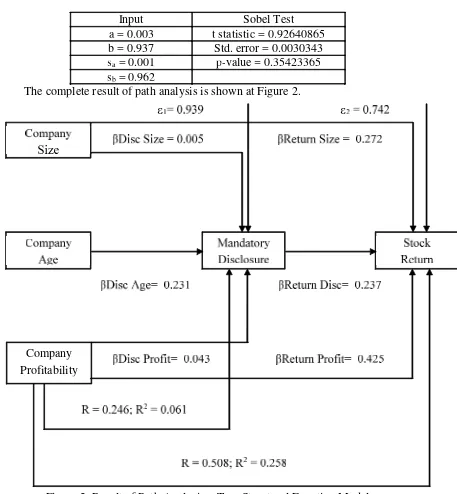
Sobel Test
The next test is to determine whether mandatory disclosure is a mediator: (i) between company size and stock return, (ii) between company age and stock return, and (iii) company profitability and stock return. Since H2a was rejected, mandatory disclosure was not a mediator between company size and stock return. In addition, mandatory disclosure was not a mediator between company profitability and stock return because H4a was rejected. Therefore, the only hypothesis that can be set is:
H5 = company age has the indirect association with stock return through mandatory disclosure.
International Conference on Ethics of Business, Economics, and Social Science |||| 5757 < t-table 1.96, so H5was rejected. This meant that mandatory disclosure was not a mediator between company age and stock return.
Table 10. Result of Sobel Test
Input Sobel Test
a = 0.003 t statistic = 0.92640865 b = 0.937 Std. error = 0.0030343 sa= 0.001 p-value = 0.35423365 sb= 0.962
The complete result of path analysis is shown at Figure 2.
Figure 2. Result of Path Analysis•Two Structural Equation Model
CONCLUSION
Based on the research results, it was found that mandatory disclosure did not function as a mediator between independent variables including company size, company age, and company profitability and a dependent variable including stock return. It did because there was no association between company size and company profitability with mandatory
disclosure. Sobel Test also provided evidence that there was no indirect association between company age and stock return through mandatory disclosure, even though the statistical results proved that company age was significantly associated with mandatory disclosure and mandatory disclosure was significantly associated with stock return. Since mandatory disclosure directly affects stock return, it is necessary for the companies to disclose information as regulated by accounting standards in Indonesia. Then, company age is a significant factor affecting mandatory disclosure, so the investors can recognize the mature manufacturing companies listed at Indonesia Stock Exchange as the place to find complete and transparent information. In addition, since company size and company profitability directly have a positive association with stock return, the investors can recognize the big manufacturing companies and the high profitability manufacturing companies as the places to invest.
Some limitations are found in this research including: (i) the research was only conducted for one period of financial statements, so there is a possibility that the results do not reflect the level of compliance to mandatory disclosure in the implementation of IFRS. It is advised to lengthen a research period in the next research to get the more precise result regarding mandatory disclosure in IFRS implementation era, (ii) the number of samples used in this research was only 47 manufacturing companies, so there is a possibility that the results do not reflect the condition in manufacturing companies. It is advisable to increase the number of samples and to expand the scope of research to other industries, (iii) the subjectivity of providing score to determine whether the companies disclose the information or not is a matter of concern. Therefore, it is necessary to work together with the practitioners such as auditors to minimize the subjectivities.
REFERENCES
Abd Elsalam, O. H., & Weetman, P. (2003). Introducing international accounting standards to an emerging capital market: relative familiarity and language effect in Egypt. Journal of International Accounting, Auditing, and Taxation,12(1), 63-84.
Adina, P., & Ion, P. (2008). Aspect regarding corporate mandatory and voluntary disclosure. Annals of the University of Oradea: Economic Science,3(1), 1407-1411.
Ahmed, K., & Courtis, J.K. (1999). Associations between corporate characteristics and disclosure levels in annual reports: a meta-analysis. British Accounting Review, 31(1), 35-61.
Ahmed, K., & Nicholls, D. (1994). The impact of non-financial characteristics on mandatory disclosure compliance in developing countries: the case of Bangladesh. International Journal of Accounting,19(3), 62-77.
Akhtaruddin, M. (2005). Corporate mandatory disclosure practices in Bangladesh. The International Journal of Accounting,40, 399-422.
International Conference on Ethics of Business, Economics, and Social Science || 59 Ali, M., Ahmed, K., & Henry, D. (2004). Disclosure compliance with national accounting standard by listed companies in South Asia. Accounting and Business Research, 34(3), 183-199.
Aljifri, K. (2008). Annual report disclosure in a developing country: the case of the UAE. Advances in Accounting, Incorporating Advances in International Accounting,24, 93-100.
Arcay, M. R. B., & Vazquez, M. F. M. (2005). Corporate characteristics, governance rules and the extent of voluntary disclosure in Spain. Advances in Accounting, 21, 299-331.
Bachtiar, Y. S. (2003). Hubungan antara manajemen laba dengan tingkat pengungkapan laporan keuangan )Qublished masters thesis*/ Vniversity of Jndonesia- Eepok- Indonesia.
Ball, R., & Foster, G. (1982). Corporate financial reporting: a methodological review of empirical research. Journal of Accounting Research,20(Suppl), 161-234.
Banz, R. W. (1981). The relationship between return and market value of common stock. Journal of Financial Economics,9, 3-18.
Barako, D., Hancock, P., & Izan, H. (2006). Factors influencing voluntary corporate disclosure by Kenyan companies.Corporate Governance: an International Review, 14(2), 107-125.
Benjamin, T. Y., An-Yeung, P. K., Kwok, M. C. M., & Lau, L. W. C. (1990). Non compliance with disclosure requirements in financial statement: the case of Hongkong companies.The International Journal of Accounting,25, 99-112.
Bova, F., & Pereira, R. (2012). The determinants and consequences of heterogeneous IFRS compliance levels following mandatory IFRS adoption: evidence from a developing country. Journal of International Accounting Research, 11(1), 83-111.
Cahyati, A. D. (2011). Peluang manajemen laba pasca konvergensi IFRS: sebuah tinjauan teoritis dan empiris.Jurnal Riset Akuntansi dan Komputerisasi Akuntansi,2(1), 1-7.
Chou, G. K., & Gray, S. J. (2010). Family ownership, board independence, and voluntary disclosure: evidence from Hong Kong. Journal of International Accounting, Auditing, and Taxation,19, 93-109.
Choi, F. (2005).International accounting. New Jersey: Prentice Hall.
Cooke, T. E. (1989). Disclosure in the corporate annual report of Swedish companies. Accounting and Business Research,19(74), 113-124.
Daniel, K., & Titman, S. (1997). Evidence on the characteristics of cross sectional variation in stock return.Journal of Finance,21, 1-31.
Darrough, M. N. (1993). Disclosure policy and competition: cournot vs bertrand. The Accounting Review,68(3), 534-561.
Depoers, F. (2000). A cost-benefit study of voluntary disclosure: some empirical evidence from French listed companies.The European Accounting Review,9(2), 245-263.
Indonesia)Qublished undergraduates thesis*/ Vniversitas Tebelas Maret, Surakarta, Indonesia.
Farma, E., Kenneth, F., & French, R. (1995). Size and book to market factors in earning and returns.Journal of Finance,50, 131-155.
Ghozali, I. (2011).Aplikasi analisis multivariate dengan program IBM SPSS 19. Semarang: Badan Penerbit Universitas Diponegoro.
Glaum, M., & Street, D. L. (2003). Compliance with the disclosure requirements of
Hermanys new market< JBT versus VT HBBQ/ Journal of International Financial Management and Accounting,14(1): 64-100.
Hartono, J. (1998).Teori portofolio dan analisis investasi. Yogyakarta: BPFE.
Healy, P. M., & Palepu, K. G. (2001). Information asymmetry, corporate disclosure, and the capital market: a review of the empirical disclosure literature. Journal of Accounting and Economics,31, 405-440.
Healy, P. M., Hutton, A. P., & Palepu, K. G. (1999). Stock performance and intermediation change surrounding sustained increases in disclosure. Contemporary Accounting Research, Fall, 485-520.
Healy, P.M., & Wahlen, J.M. (2000). A review of the earnings management literature and its implications for standard setting.Accounting Horizons,13(4), 365-383.
Hussainey, K., Schleicher, T., & Walker, M. (2003). Undertaking large-scale disclosure studies when AIMR-FAF ratings are not available: the case of prices leading earnings.Accounting and Business Research,33(4), 275-294.
Inchausti, B. G. (1997). The influence of company characteristics and accounting regulations on information disclosed by Spanish firms.The European Accounting Review,1(1), 45-68.
Istiningrum, A. I., & Suryati (2014). Pengaruh residual income dan market to book ratio terhadap stock return pada industri manufaktur. Jurnal Ilmu Manajemen, 11(3), 1-20.
Kieso, D. E., Weygandt, J. J., & Warfield, T. D. (2011).Intermediate accounting(IFRS ed.). USA: John Wiley & Sons.
Kurniawan, Y. A. (2013).Faktor-faktor yang mempengaruhi luas pengungkapan sukarela pada laporan tahunan perusahaan di Bursa Efek Indonesia (Published
undergraduates thesis*/ Btmajaya Vniversity- Zogyakarta- Indonesia.
Kusumo, R. M. G. I. (2011).Analisis pengaruh rasio keuangan terhadap return saham pada perusahaan non bank LQ 45 )Qublished undergraduates thesis*/ Eiponegoro University, Semarang, Indonesia.
Latridis, G. (2008). Accounting disclosure and firms financial attributes< evidence from the UK stock market.International Review of Analysis,17, 219-241.
International Conference on Ethics of Business, Economics, and Social Science || 61 Malone, D., Fries, C., & Jones, T. (1993). An empirical investigation of the extent of corporate financial disclosure in the oil and gas industry. Journal of Accounting, Auditing, and Finance,8(3), 249-273.
Marston, C. L., & Shrives, P. J. (1991). The use of disclosure indices in accounting research: a review article.British Accounting Review,23(23), 195-210.
Meek, G. K., Roberts, C.B., & Gray, S. J. (1995). Factors influencing voluntary annual report disclosures by US, UK, and Continental European multinational corporation.Journal of International Business Studies, 26(3), 555-572.
Mintara, Y. H. (2008). Pengaruh implementasi corporate governance terhadap pengungkapan informasi (Unpublished undergraduates thesis*/ Vniversitas Jslam Indonesia, Yogyakarta, Indonesia.
Naser, K. (1998). Comprehensiveness of disclosure of non-financial companies listed on the Amman financial market. International Journal of Commerce and Management, 8(1), 88-119.
Nugraha, B. (2005). Pengaruh tingkat pengembalian investasi (return on investment) terhadap harga saham pada PT Astra Agro Lestari Tbk)Qublished undergraduates thesis). Universitas Komputer Indonesia, Jakarta, Indonesia.
Octora, M., Salim, Y., & Petrolina, T. A. (2003).Analisa pengaruh penilaian kinerja dengan konsep konvensional dan konsep value based terhadap rate of return. Jakarta: Ikatan Akuntan Indonesia.
Owusu-Ansah, S. (1998). The Impact of corporate attributes on the extent of mandatory dsclosure and reporting by listing companies in Zimbabwe.International Journal of Accounting,33(5), 605-631.
Owusu-Ansah, S., & Yeoh, J. (2005). The effect of legislation on corporate disclosure practices.Abacus,41(1), 92-109.
Popova, T., Georgakopoulos, G., Sotiropoulos, I., & Vasileiru, K. Z. (2013). Mandatory disclosure and its impact on the company value. International Business Research, 6(5), 1-16.
Prawinandi, W., Suhardjanto, D., & Triatmoko, H. (2012). Peran struktur corporate governance dalam tingkat kepatuhan mandatory disclosure konvergensi IFRS. Retrieved from http://asp.trunojoyo.ac.id/wp-content/uploads/2014/03/067-CG-21.pdf
Preacher, K.J. and G.J. Leonardelli. (2006). Calculation for the Sobel Test: an interactive
calculation tool for mediation test. Retrieved from
http://www.psych.ku.edu/preacher/sobel/sobel.htm
Samsul, M. (2008).Pasar Modal dan Manajemen Portfolio. Jakarta: Erlangga.
Sarwono, J. (2007).Analisis jalur untuk riset bisnis dengan SPSS. Yogyakarta: Andi.
Scott, R. W. (2000).Financial accounting theory(2nded.) University of Water: Prentice Hall International, Inc.
Silviana, Y. H. K. (2014).Perbedaan tingkat pengungkapan antara perusahaan asing dan domestik dengan adanya konvergensi IFRS )Qublished undergraduates thesis*/ Atmajaya University, Yogyakarta, Indonesia.
Setianto, A. (2014). Penerapan IFRS dan hubungannya dengan komparabilitas pengungkapan aset tetap pada laporan keuangan perusahaan (Unpublished
undergraduates thesis*/ Eiponegoro Vniversity- Temarang- Jndonesia/
Sugiarto, A. (2011). Analisa pengaruh beta, size perusahaan, DER, dan PBV ratio terhadap return saham.Jurnal Dinamika Akuntansi,3(1), 8-14.
Sunyoto, D. (2011).Riset bsnis dengan analisis jalur SPSS. Yogyakarta: Gava Media.
Syahrul, Y. (2002). Bapepam: Kasus Kimia Farma Merupakan Tindak Pidana. Retrieved from http://www.tempo.co.id/hg/ekbis/2002/11/04/brk,20021104-36,id.html.
Tomaszewski, S. G., & Showerman, S. (2010). IFRS in the United States: challenges and opportunities.Review of Business,2, 59-71.
Utami, W. D., Suhardjanto, D., & Hartoko, S. (2012).Investigasi dalam konvergensi IFRS di Indonesia: tngkat kepatuhan pengungkapan wajib dan kaitannya dengan mekanisme corporate governance. Retreieved from http://asp.trunojoyo.ac.id/wp-content/uploads/2014/03/066-CG-20.pdf
Wallace, R. S. O. (1987). Disclosure of accounting information in developing countries: a
case study of Oigeria )Vnpublished Qh/ Es dissertation*/ Vniversity of Fxter- VL/
Wallace, R. S. O., & Naser, K. (1995). Firm-spesific determinants of comprehensiveness of mandatory disclosure in the corporate annual reports of firms on the Stock Exchange of Hongkong. Journal of Accounting and Public Policy, 14, 311-368.
Wallace, R. S. O., Naser, K., & Mora, A. (1994). The relationship between the comprehensiveness of corporate annual reports and firm characteristics in Spain. Accounting and Business Research,25(97), 41-53.
Widyastuti, T. (2007). Pengaruh karakteristik perusahaan terhadap manajemen laba dan dampaknya pada return saham.Akuntabilitas,7(1), 38-44.