Journal of Chemical and Pharmaceutical Research, 2016, 8(1):565-570
Research Article
CODEN(USA) : JCPRC5
ISSN : 0975-7384
Development and validation of thin layer chromatography-densitometry
method for analysis of mefenamic acid in tablet
Harrizul Rivai, Wery Kunia Putri and Fithriani Armin
Faculty of Pharmacy, Andalas University, Padang, West Sumatra, Indonesia
_____________________________________________________________________________________________
ABSTRACT
Mefenamic acid is routinely used as tablet dosage forms. Thin layer chromatography (TLC) promotes for higher separation efficiencies, shorter analysis time, lower amounts of mobile phase, and efficient data acquisition and processing. There are various analytical methods for their estimation of mefenamic acid but till date there is no TLC method for its analysis. The paper presents the development and validation of a new TLC method for analysis of mefenamic acid in tablet. Separation was performed on silica gel 60 F254 plates. The mobile phase is comprised of chloroform: methanol (9.0: 0.1, v: v). Densitometry evaluation of the separated zones was performed at 320 nm. The drug was satisfactorily resolved with RF values of 0.55 ± 0.03. The accuracy and reliability of the method was assessed by evaluation of linearity (50-300 µg/mL), precision intra-day and inter-day RSD values were always less than 2, accuracy (102.45 % ± 1.36% for Sample A and 100.28 % ± 1.90 % for Sample B) in accordance with ICH guidelines. The proposed method is new, accurate and precise. Therefore, it is suitable for determination of mefenamic acid in tablet for analytical and pharmaceutical purposes.
Keywords: mefenamic acid, thin layer chromatography, densitometry, validation
_____________________________________________________________________________________________
INTRODUCTION
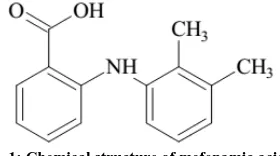
Mefenamic acid is a non-steroidal anti-inflammatory drug used to treat pain, including menstrual pain. It is typically prescribed for oral administration. Mefenamic acid has molecular formula C15H15NO2 and molecular weight 241.29
g/mol. Chemically, mefenamic acid is 2-[(2,3-dimethyl phenyl) amino] benzoic acid as presented in Fig. 1. It is metabolized to 3-hydroxymethyl mefenamic acid and further oxidation to a 3-carboxy mefenamic acid may occur. The chemical properties for mefenamic acid are white to grayish-white microcrystalline powder, melting point 230 - 231 oC with effervescence, practically insoluble in water; soluble 1 in 185 mL of ethanol, 1 in 150 ml of chloroform, and 1 in 80 mL of ether; soluble in solutions of alkali hydroxides [1].
Fig. 1: Chemical structure of mefenamic acid
566
The aim of this study is performing very simple method in terms of mobile phase and program to analysis mefenamic acid in tablet, and validation of method in according to ICH guideline [7].
EXPERIMENTAL SECTION
Materials, chemicals and equipment
Mefenamic acid standards were obtained from PT Indofarma (Jakarta, Indonesia). Tablets of mefenamic acid were procured from retail pharmacies (Padang, Indonesia). Methanol, chloroform, glacial acetic acid and ether were obtained from E. Merck and of analytical grade. A Camag TLC system equipped with a sample applicator Namomat 4, twin trough plate development chamber, TLC Scanner III, Reprostar and Wincats 4.02, integration software (Switzerland). Pre-coated silica gel 60 F254 TLC aluminum plates were obtained from E. Merck, Jakarta (Indonesia).
Preparation of standard solution
Weigh accurately 25.3 mg mefenamic acid and was dissolved in 20 mL chloroform in 50 mL volumetric flask. This solution was sonicated for 15 minutes at 30 oC and then added chloroform up to mark to get the strength of 506 µg/mL mefenamic acid.
Method Development
Mefenamic acid solution was prepared using chloroform as solvent. The TLC plates were pre washed with methanol and activated by keeping at 115°C for about 30 minutes. Solutions of 2.0 µL were applied on the TLC plates as using Camag Nanomat 4. Application positions were at least 10 mm from the sides and 10 mm from the bottom of the plates. Mobile phase components were mixed prior to use and the development chamber was left to saturate with mobile phase vapor for 15 minutes before each run. Mobile phase components were listed in Table 1.
Table 1: Component of mobile phase used in TLC of mefenamic acid analysis
Component of mobile phase Ratio Rf Methanol : Chloroform : Acetic acid 8 : 10 : 0.2 0.87 Methanol : Chloroform : Acetic acid 3 : 7 : 2 drops 0.85 Dichloromethane : Methanol : Acetic acid 4 : 1 : 2 drops 0,86 Dichloromethane : Methanol 2 : 3 0,78 Dichloromethane : Methanol 4 : 1 0,78 Dichloromethane 1 0,88
Chloroform 1 0,30
Chloroform : Methanol 9.9 : 0.1 0.55
Development of the plates was carried out by the ascending technique to a migration distance of 8 cm. The plates were dried by hair dryer.
Densitometry scanning was done in absorbance mode at 320 nm using a deuterium lamp. The slit dimensions were set at 6 x 0.30 mm, the scanning speed at 20 mm/s and data resolution at 100 m/step. Single wavelength detection was performed because we are dealing with main component analysis and not impurities determinations where scanning at the individual λ values would be preferred.
These conditions were transferred to the TLC system and the results were evaluated with the aim of achieving an optimum separation between spots (Rs ≥ 2) and a migration of spots with Rf values between 0.32 and 0.55 in order to ensure separation reproducibility.
Method Validation Linearity
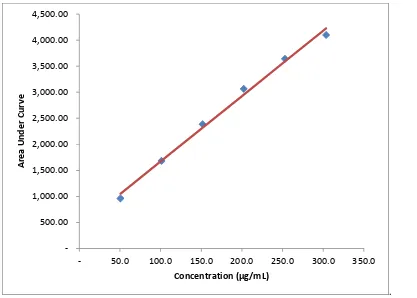
A stock solution with 506 µg/mL of mefenamic acid was prepared in chloroform. The volume of 1, 2, 3, 4 and 5 mL of stock solution were introduced by measuring pipette into separate 10 mL volumetric flask and then diluted with chloroform up to the mark. These solutions contain 50.6, 101.2, 151.8, 202.4, 253.0 µg/mL of mefenamic acid. A volume of 5 µL of each solution was applied on the TLC plate. This was done in triplicate and repeated for three days. For each concentration, the applied spot were evenly distributed across the plate to minimize possible variation along the silica layer. The linearity was evaluated visually by looking at the calibration curve of mefenamic acid.
Precision
was assessed by spotting 101.2, 202.4 and 253.0 µg/mL of mefenamic acid solution, and three times. From the peak areas, the percentage RSD was determined.
Accuracy
The accuracy of the method was assessed by determination of the recovery of the method at three different concentrations (40%, 80% and 120% concentration) by addition of known amount of standard to the placebo. Solutions were prepared in triplicate and analyzed. This procedure was repeated for three consecutive days. Calibration curves to estimate the concentration of drug per spot were measured daily on the same plates as the samples. The accuracy was determined and expressed as percentage recovery.
Analysis of tablet samples
The method was used for quantization of mefenamic acid procured from local pharmacy. For sample preparation, chloroform was used as solvent for extraction and dilution. Twenty tablets containing mefenamic acid were milled well and weighed accurately. Portions of powder equivalent to 10 mg of mefenamic acid was weighed accurately and introduced into a 50 mL volumetric flask. The mixture was diluted up to 50 mL volume with chloroform; mixed well and filtered through Whatmann filter paper No 41 to obtain the sample stock solution. Further 5 µ L of the test solution was applied on the pre-coated silica gel 60 F254 plate and from the peak area obtained; the amount of
mefenamic acid in tablet was calculated using the calibration graph.
For the determination of mefenamic acid, sample solutions were prepared in triplicate and analyzed according to the method procedure. Sample and standard solutions were spotted on the same plate.
Reproducibility
Reproducibility is assessed by means of an inter-laboratory trial. Reproducibility should be considered in case of the standardization of an analytical procedure, for instance, for inclusion of procedures in Pharmacopoeias. These data are not part of the marketing authorization dossier.
Repeatability
Repeatability should be assessed using a minimum of 9 determinations covering the specified range for the procedure (e.g., 3 concentrations /3 replicates each).
RESULTS AND DISCUSSION
During the stage of method development different mobile phases were tried and the mobile phase comprising of chloroform and methanol (9.9: 0.1, v: v) was confirmed. Component of mobile phases used in TLC of mefenamic acid analysis were listed in Table 1. This table showed that Rf value 0.55 was the best mobile phase for TLC of mefenamic acid analysis by using silica gel 60 F254 plate.
568
.
Fig. 2: Calibration curve of mefenamic acid
Table 2: Evaluation of interday precision of mefenamic acid
Concentration added (µg/mL) Day Area Under Curve Concentration obtained (µg/mL) SD RSD
Table 3: Evaluation of intraday precision of mefenamic acid
Concentration added (µg/mL) Time on a day Area Under Curve Concentration obtained (µg/mL) SD RSD
101.2
Recovery studies were carried out for estimation of the accuracy of the proposed method. These studies were carried out using standard addition method at three concentration levels. The obtained results were summarized in Table 4. The low RSD value (< 2) indicated the suitability of the method for routine analysis of mefenamic acid in pharmaceutical tablets.
Table 4: Standard addition method for the recovery studies
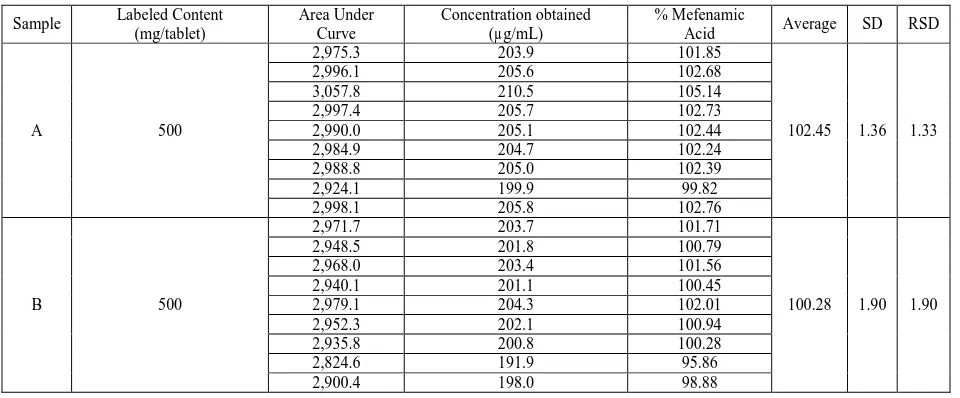
% confirms that the assay value lies within the limit specified in the Indonesian Pharmacopoeia [2].
CONCLUSION
570
Table 5: Analysis of commercial tablets containing mefenamic acid
Sample Labeled Content (mg/tablet)
Area Under Curve
Concentration obtained (µg/mL)
% Mefenamic
Acid Average SD RSD
A 500
2,975.3 203.9 101.85
102.45 1.36 1.33
2,996.1 205.6 102.68
3,057.8 210.5 105.14
2,997.4 205.7 102.73
2,990.0 205.1 102.44
2,984.9 204.7 102.24
2,988.8 205.0 102.39
2,924.1 199.9 99.82
2,998.1 205.8 102.76
B 500
2,971.7 203.7 101.71
100.28 1.90 1.90
2,948.5 201.8 100.79
2,968.0 203.4 101.56
2,940.1 201.1 100.45
2,979.1 204.3 102.01
2,952.3 202.1 100.94
2,935.8 200.8 100.28
2,824.6 191.9 95.86
2,900.4 198.0 98.88
Acknowledgements
The authors thank to Head of Central Laboratory, University of Andalas, Padang 25168, West Sumatra, Indonesia for facilities of this work.
REFERENCES
[1] AC Moffat, MD Osselton and B Widdop (Eds.). Clark’s Analysis of Drugs and Poisons, Fourth Edition, Pharmaceutical Press, London, 2011, 1617.
[2] Kementerian Kesehatan Repulik Indonesia. Farmakope Indonesia, Edisi 5, Kementerian Kesehatan RI, Jakarta,
2014, 151-152.
[3] Riyanto and A Anshori. Anal. Bioanal. Electrochem, 2014, 6(2), 159 – 169.
[4] FF Al-qaim, MP Abdullah, MR Othman and WM Khalik. Int. J. Chem. Sci., 2014, 12(1), 62-72.
[5] NA Alarfaj, SA Altamimi and LZ Almarshady. Asian Journal of Chemistry, 2009, 21(1), 217-216.
[6] MY Khuhawar. TM Jehangir and FMA Rind. Jour. Chem. Soc. Pak., 2001, 32(4), 226-228.