Proceeding of International Conference Future of Food Factors
Method Validation of Alkyl Parabens Content
in Soy-sauce
Dias Indrasti1.2, Hanifah Nuryani Lioe1, Taufik1, Dede R. Adawiyah1,2
IDepartment Food Science and Technology, Faculty of Agricultural and Engineering Technology, Bogor Agricultural University, IPB Darmaga Campus,
PO BOX 220, Bogor 16002, Indonesia
2Southeast Asian Food and Agricultural Science and Technology Center - Bogor Agricultural University, JI. Puspa No.1IPB Darmaga Campus, Bogor, Indonesia
ABSTRACT
Alkyl p-hydroxybenzoates (alkyl parabens) is acidic food additive preservative prevents the microbial growth . Addition of alkyl parabens in food must meet the safety requirement from Codex. The objective of the study was to do method validation in analysis of the alkyl (methyl-, ethyl, propyl-, butyl -) parabens content in soy-sauce. The method used was applied High Performance Liquid Chromatography (HPLC) technique. Performance of the method was measured by several parameters . The R2 value of linearity for all alkyl para ben was above 0.990. Limit of detection for methyl-, ethyl-, propyl-, and butyl paraben were 0.15, 0.13, 0.12 and 0.12 Ilg/ml, respectively . Limit of quantification for methyl-, ethyl-, propyl-, and butyl paraben were 5.00, 7.95, 8.17, and 8.30 ppm, respectively. Recovery of all alkyl parabens were above 87% and the coefficient of variation were below 11%. The method showed good specificity, accuracy, and precision. The method was valid based on those parameters and could be used as a routine laboratory method.
Keywords: Preservatives, parabens, method validation, soy-sauce, HPLC
INTRODUCTION
Parabens or p-hydroxybenzoic acids are group homologous series of hydroxybenzoic acid, differing in the ester group, including methyl-, ethyl-, propyl-, butyl-, heptyl-, and benzyl-group (Figure 1). It has been used singly or
in combination as an antimicrobial preservative in food products,
pharmaceutical, and cosmetics formulations. The parabens are stable over the
ruuu .:>UJeW unu LJ,UOI/ry
pH range and soluble in water. They are relatively safe to use (non-iritating, non-sensitizing, and low toxicity), not carcinogenic, not mutagenic, not teratogenic or embryotoxic and are negative in the uterotropic assay (Soni et ai, 2005). Parabens also occur naturally in foods. Methyl paraben has been reported as a constituent of cloud berry, yellow passion fruit juice, white wine,
botrytised wine, and Bourbon vanilla, and recently, propyl para ben has been detected in the aerial part of the plant Stocksia brahuica (Family: Sapindaceae) (Ali et ai, 1998).
o
II
HO
C-O-R
Figure 1. Chemical structure of parabens, where R = methyl (CH3), ethyl (C2HS), propyl C3H7}, butyl (C4HS)
Use of alkyl parabens as food additives must meet food safety requirement. The United State Food and Drug Administration (US FDA) has classified methyl and propyl paraben as Generally Recognized as Safe (GRAS)
for direct addition to food. Heptyl para ben is allowed by the FDA for direct addition to fermented malt beverages in amounts maximum 12 ppm and in non-carbonated soft drinks and fruit in various foods. FDA has also approved methyl-, propyl- and butyl paraben as synthetic flavoring substances and adjuvants for addition to foods at minimum quantity to beverages. The Joint
FAa/WHO Expert Committee on Food Additives(JECFA} suggested the group Acceptable Daily Intake (ADI) for the methyl-, ethyl-, and propyl- esters of p-hydroxybenzoic acid as 0-10 mg/kg body weight/day (JECFA, 1974). Ishiwata et al. (1997) reported the highest detection rate of parabens in Japan was soy sauce with the average concentration was 34.2 mg/kg as p-hydroxybenzoic acid.
A laboratory analysis was needed in order to determine parabens
content in food products. There were some methods for determination of parabens in cosmetics, food products and pharmaceuticals (Wang and Chang,
Proceeding of International Conference Future of Food Factors
factors for assuring precise and accurate analyses (Zel et ai, 2008) . The objective of this research was to do the method validation of alkyl parabens in soy-sauce using High Performance Liquid Chromatography (HPLC) instrument. Method validation was done by evaluating a series of method performance characteristic in addition to precision and accuracy: analytical selectivity, analytical specificity, linear ran ge, limit of detection, limit of quantification, and recovery .
MATERIALS AND METHODS
Raw Materials
One brand of commerc ial soy-sauce was used as food matrix and was purchased from market in Bogor, Indonesia . Chromatographic grade of
acetonitrile and methanol were obtained from Merck (Germany). Analytical grade of potassium dihydrogen phosphate, acetonitrile, ethanol, and silica gel 60 pellet were obtained from Merck (Merck, Germany). The standards of
methyl paraben, ethyl para ben, propyl paraben, and butyl paraben were obtained from Agency of Drug and Food Control -Republic of Indonesia, Jakarta .
Preparation of Sample and Standards
Soy-sauce sample was digested, homogenized, and weight as much as
2.5 g. Sample was extracted three times with 25 ml of ethanol (80%) . Extract was diluted to 100 ml using ethanol (80%) and filtered. A 20 ml of filtrate was
eluted through the solid phase extraction (SPE) column contain silica 60. Eluted sample then filtered using membrane filters 0.45 11m. Final filtrate was placed in a small vial for further analysis. The paraben standards were diluted in ethanol in several conce.ntrations before injecting into the separation
instrument.
HPLC Configuration
The method used in this research was modification from The United States Department of Agriculture (USDA) method using High Performance
Liquid Chromatography (HPLC) technique . An Agilent model 1200 series HPLC
Food Safety and Quality
USA) was used for the analysis of paraben compounds. An Eclips Xdb C18 column (15 cmx4.6 mmX5 11m; Supelco, USA) was used in separation process. A degassed and filtered mixture of 0.05 M potassium phosphate, pH 6.80, and acetonitrile (65:35 v/v) was used as mobile phase. The flow rate was maintained at 1.0 ml/min with sample loop at 20 111. All separations were carried out at ambient temperature.
RESULTS AND DISCUSSION
Specificity of Alkyl Parabens
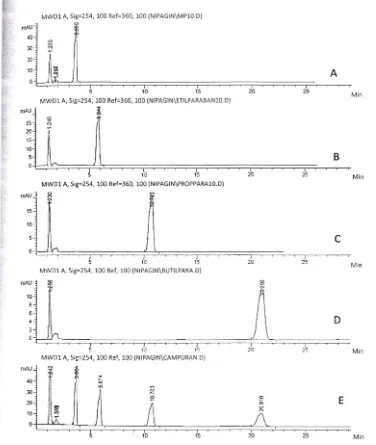
The analytic specificity refers to the ability of a method to detect only the analyte of interest (Walton, 2001) . Specificity of methyl-, ethyl-, propyl-, and butyl paraben standards were examined by the HPLC method and the responses observed. Injection was done firstly for each single standard, followed by four standards injection simultaneously. Figure 1 part A-D shows
sample chromatograms obtained from the analysis of individual paraben standards . Every standard was gave single peak in each chromatogram. A
chromatogram of simultaneous injection of four parab en stand ards was give n in the part E of Figure 1.
It shows that each single standard was come up in different retention time with similar order with the individual standard injection. The methyl paraben was come up first, followed by ethyl-, propyl-, and butyl paraben .
As comparison data, the alkyl parabens standards were also ad de d to the food samples (soy-sauce) and unspiked soy-sauce used as a co ntrol. Specificity of four parabens standards in unspiked and spiked soy-sauce was
given in Figure 2. In Figure 2 part A clearly shows that there was no peak of the alkyl parabens standards detected in chromatogram for soy-sauce without spiking. Using the same method, the chromatogram of spiked parabens
pointed the presence of the alkyl paraben standards with the same patt ern to the simultaneous standards injection in Figure 1 (E) . Based on those re sults, HPLC-MWD method used in this study (from extraction to clean-up step s) was
Proceeding of International Conference Future of Food Factors
MWDl A, Sig=254, 100 Ref=360, 100 (NIPAGIN\MP10.D)
40
30 セ@
セ@
10
A
5 10 15 20 25
Min MWD1 A, Sig=254, 100 Ref=3 60, 100 (NIPAGIN \ETILPARABAN10.D)
mAU
li
25 セ@
セ@
"
セ@
l
15 10
5 B
10 15 20 25 Min
MWDl A, Sig=254, 100 Ref=360, 100 (NIPAGIN\PROPPARAlO.D)
セャゥ@
セ@
c
,
I
,
,
,
,
5 10 1" 20 25 M in
MWDl A, Sig=254, 100 Ref, 100 (NIPAGIN\BUTILPARA.D)
OlAU 10
D
1(' QセG@ 20 25 Min
MWDl A, Sig=254, 100 Ref, 100 (NIPAGIN\CAMPURAN .D)
mAU
,.
40
.,
.,;
...
30 R
セ@
..
J
l\
10
li
0
E
[image:5.600.72.448.60.505.2]5 10 15 20 25 Min
Figure 1. The chromatogram of HPLC-MWD for alkyl paraben standards (A-methyl paraben, B-ethyl paraben, C-propyl para ben, D-butyl paraben) detected in different retention time, so that could be analyze simultaneously as shown in part E
Food Safety and Quality
Linearity
The linearity or linear range of the method defines the effective working range of the test (Walton, 2001) . This range was validated by evaluating a set of reference (standard) solutions or by creating a series of dilutions (a m inimum 5 samples) that range from an analyte concentration approaching the lowest detection limit to one with a concentration nearing the expected upper limit of the working range (Lumsden, 2000) .
mAU
30
20
10
m AU
40
30
2 0
10
o
MWD1A, Si9=254.100 Ref= 360.100 (STDBENZOAn OA. D)
!'. 10 \:'
MW 01 A, Si9=254.100 Ref= 360.100 (STD BENZOAn1 .0)
セ@
.,
セ@
,/\ ,
10 15
A
Mi n
B
20 Min
Figure 2. The chromatogram of HPLC-MWD of sa mple (sw ee t soy-sauce) without spike (A); and the chromatogram HPLC-MWD alkyl parabens standards (methyl-, ethy l-, propyl-, and butyl paraben) spiked to the samples (8). Alkyl paraben s w ere detected as separate individual peaks
[image:6.595.84.429.202.585.2]Proceeding of International Conference Future of Food Factors
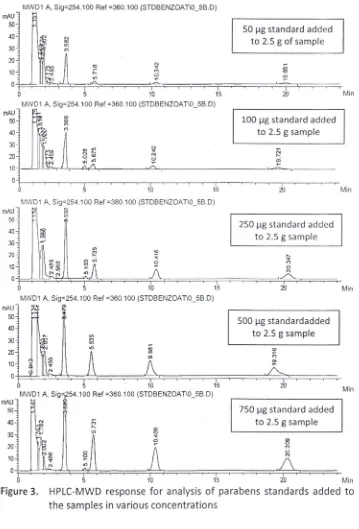
examined by the HPLC method and the responses measured. Figure 3 shows the chromatograms obtained from the response of HPLC-MWD instrument.
MWDI A, Sig=254.100 Ref =360.100 (STDBENZOAT\0_5B.D)
mAU
50
40
30
20
10 iセ@ セ@
N
...
(')o
50 セァ@ standard add ed to 2.5 g of sample
セ@
<;;
セ@
Nセ@
Pゥ]セセセセセセク]セセセセセセセセセ]]セセセセセセセ セ セ@
o 5 10 15 20
MWDI A, Sig=254.1 00 Ref =360 .100 (STDBENZOAT\0_5BD)
100 セァ@ standard added to 2.5 g sample
rnA:
\
N
....
en
30
`セ N@
",onセ@
20 Ll"O\ セセ@ N
QPQ⦅Ml
セl セ セᄋᄋ セセセセセ
Gaセッョセ@
______セlセセセ
ᄋLM
_ _ _ _ _ _ _ _ _ _ _ _ _ _ _ _ _ _セセMN@
_ _ _ _ _ _ __ mAU 50 40 30 20 10 mAU 50 40 30 20 1010 15
MWD1 A, Sig=254 100 Ref =360. 100 (STDBENZOAT\0_5BD)
, セ@
OIl
セ@
,OIl
( 12 <0
;;
i セ」ョ@
ャセ@
co
セNa@
0o 5 10 15
MWDI A. Sig=254 .100 Ref =360. 100 (STDBENZOAT\0_5B.O)
セ@
en
A
,20
250 セァ@ standard added to 2.5 g sample
....
セ@
0
N
20
500 セァ@ standardadded to 2.5 g sample
'!!.
..,
セ@
Lセ@ ,
20
750 セァ@ standard added to 2.5 g sample
[image:7.595.80.439.105.634.2]S
'"
A
Min Min Min Min o Figure 3.5 10 15 20 Min
HPLC-MWD response for analysis of parabens standards added to the samples in various concentrations
The four parabens standards added to the sample were in proportion to concentration added. In each case, a linear relationship between peak height and concentration was observed. Higher the spiked parabens standards concentration will make the peak area in chromatogram higher.
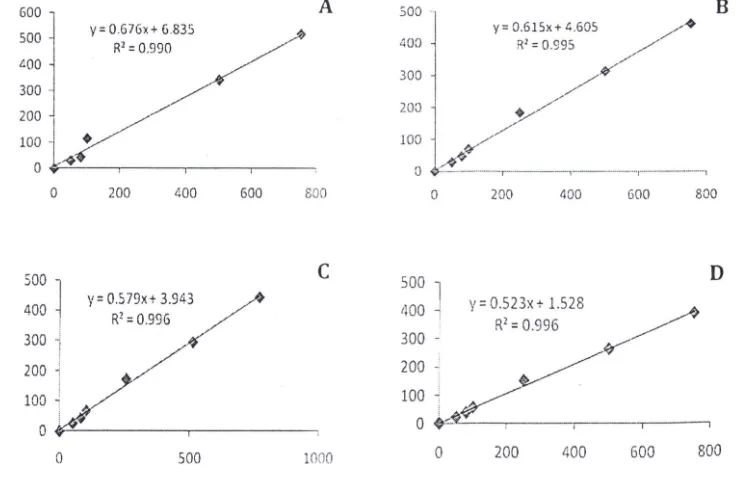
The analytical range (linear range) of methyl-, ethyl-, propyl-, and ethyl paraben were evaluated during this study. Regression analysis of data for each component gave the value for slope, intercept and correlation coefficient for each calibration curve. The linear range of the alkyl parabens were obta ined in range of 50-755 j.lg/2.5 g or 20-300 Ilg/g sample. The regression curves of standard parabens linearity were shown in Figure 4. Each figure showed the R2
value more than 0 .990. It means that the method has good linearity. These curves were also used as standard curve or cal ibration curve fo r MDL (method 'detection limit) and recovery .
600 A
sao y= 0.676x+ 6.835 セ@ R' = 0.990 /
-tOO /
300 · /
200
I
/ /
100
-I
+/a
セ T B@
,
o 200 400 600
500
1
400
i
y =0.579x + 3.9Rl =0 .99G li3 / /300 -:,' ,,/
;
/ -Y
800
c
セセセ@
J / /
o
'V----,-- - ----,
o
500 1000500 .
40D
300
20 0
100
a
y = 0.6 15x + 4.605 R' = 0 .995
200 400
B
600 800
D
500
1
1100 ; y = 0.523x + 1.528 セ@
300
セ@
RI = 0.996vセ@
200 -セ@
100 l セ@
o
セセ L@,
[image:8.600.74.442.298.539.2]o 200 400 600 800
Proceeding of Internatioi;a{ Conference Future of Food Factors
Instrument limit of Detection (LoDinstrument)
The limit of detection (LoD) is defined by The International Union of Pure and Applied Chemistry (IUPAC) as the smallest quantity or the lowest concentration of analyte in a sample that can be detected with reasonable
certainty. This test would be necessary for trace analysis. The limit of detection and analytical selectivity are related, but are not synonymous. Sensitivity is related to precision and refers both to a test's ability to detect small quantities of the analyte and to detect small differences between samples (Walton, 2001) . A 'sensitive' methodology has a high level of analytical sensitivity and a low limit of detection.
LoDinstrument of alkyl parabens were determined by performing seven injection of 0.8 Ilg/ml methyl-, ethyl-, propyl-, and butyl paraben standards solution, respectively, to the HPLC-MWD with same condition. The standard deviation was calculated and LoD was defined as 3 times of the standard deviation. LOD illustrates the limit detection of HPLC-MWD in detection of
each alkyl paraben. LoDinstrument of methyl-, ethyl-, propyl-, and butyl paraben was 0.15,0.13,0.12, and 0.12 Ilg/mL, respectively.
Method Detection limit (MOL) or limit of Quantification (LoQ)
Method detection limit (MOL) is based on. a sample, which have gone through the entire sample preparation scheme prior to analysis. This test is
performed based on different types of sample matrices. It takes into account the LoD, the performance of the operator, the performance of the method itself and the effect of the matrix on the analyte of interest. The 'limit of
quantitation' (LoQ) is strictly the lowest concentration of analyte that can be determined with an acceptable level of repeatability precision and trueness (Eurachem, 2000).
Determination of LoO was similar with the procedure for LoD
determination. The analysis used paraben standards solution added to the sample in concentration of 20
Ilg/g
or 20 ppm . The standard deviation was calculated and LoO was defined as 5 times of the standard deviation. There were the lowest concentrations of paraben that can be reported. The LoO for methyl-, ethyl-, propyl-, and butyl paraben was 5.00, 7.95, 8.17, and 8.30 ppm,respectively. The value below the LoO is reported as undetected. From the
rOoa !:iaJety and Quality
result indicates that the method could be used to detect the presence of parabens in very low concentration.
Accuracy and Precision
Accuracy is defined as the closeness of the agreement between the measured value of an analyte and its true value (Walton, 2001). Method accuracy can be determined in three ways: by comparing the performance of the candidate method with that of a definitive or reference method (gold standard), by performing a recovery experiment, or by comparing the candidate method with the established method that is being replaced (Koch and Peters, 1999). The determination of accuracy in this study was done by recovery experiment. This experiment estimates the ability of an analytical method to correctly measure an analyte when a known amount of the analyte is added to sample.
Precision is defined as the reproducibility of result obtained by testing identical sampel (Walton, 2001) . Imprecision reflects the amount of variation inherent in the method and may be both positive and negative. Imprecision is
quantitated by calculating the mean, standard deviation (SD), and coefficient of variation (CV) of data collected from an analytical run. The CV calculated as the SD multiplied by 100 and divided by mean value.
Recovery analysis was done in two different concentrations; represent
low and high concentration of parabens in sample . Concentration used to represent low concentration was 200
Ilgjg
and to represent high concentration was 1000Ilgjg.
Each concentration was injected seven times to the HPLC method. Recovery and coefficient of variation (CV) of alkyl parabens analysiS were listed in Table 1 as follow.The recovery of simultaneous alkyl parabens was 87-99 .8% and the CV
was 4.5-10.7%. The result showed good accuracy and precision as revealed by
Proceeding of International Conference セ Gオエオイ・@ of Food Factors
Simultaneous determination of alkyl parabens by the HPLC method
Spike 200 Ilg/g Spike lOOOllg/g
Standard Recovery Coefficient Recovery Coefficient
of variation of variation
(%)
(%) (%) (%)
Methyl para ben 99.8 10.7 88 .2 5.9
Ethyl para ben 94.5 5.8 87 .3 5.0
Propyl para ben 97.3 5.9 89.8 4 .5
Butyl para ben 95 .7 6.3 87.1 4 .5
AOAC 80-110 < 15 80-110 < 15
REFERENCES
Ali Z, Ahmad VU, Zahid M, Tareen RB . 1998. Benzoic acid derivatives from Stocksia brahuica . Phytochemistry 48 :7.
Al i MS, Chaudhary RS, Takieddin MA. 1999 . Simultaneousdetermination of metronidazole benzoate, methylparaben, and propylparaben by
high-performance liquid chromatography. Drug Development and Industrial
Pharmacy 25:1143-1147.
Driouich R, Takayanagi T, Oshima M, Motomizu S. 2000. Separation and determination of haloperidol, parabens and some of thei r degradation products by micellar electrokinetic chromatography. Journal
Chromatography 903,:271-278 .
FDA. 1973. Methyl paraben and propyl paraben. Affirmation of GRAS status of direct human food ingredients. Federal Register 38:20048-20050.
Food Safety and Quality
JECFA. 1974. 17th Report of the Joint FAO/WHO Expert Committee on Food Additives. World Health Organization Technical Report Series 539.
Koch DO, Peters T. 1999. Selection and evaluation of methods. In Burtis, C.A.,
Ashwood, eNセ@ (eds). Tietz Textbook of Clinical Chemistry (ed 3). pp 320-335. Philadelphia, PA, Saunders.
Kreuz OM, Howard AL, Ip D. 1999. Determination of indinavir, potassium . sorbate, methylparaben, and propylparaben in aqueous pediatric suspensions. Journal Pharmaceutical Biomedical Analysis 19:725-735.
Labat L, Kummer E, Dallet P, Dubost JP. 2000. Comparison of high-performance liquid chromatography and capillary zone electrophoresis for the determination of parabens in a cosmetic product. Journal Pharmaceutical Biomedical Analysis 23:763-769.
Lin Yu H, Chou Shin S, Sheu F, Shyu Yuan T. 2000. Simultaneous determination of sweeteners and preservatives in preserved fruits by micellar electrokinetic capillary chromatography. Journal of Chromatographic Science 38:345-352.
Lumsden JH. 2000. Laboratory test method validation . Rev Med Vet 151: 623-630.
Soni MG, Carabin IG, Burdock GA. 2005. Review safety assessment of esters of
p-hydroxybenzoic acid (parabens). Food and Chemical Toxicology ' 43:985-1015.
Walton RM. 2001. Validation of laboratory test and methods . Seminars in Avian and Exotic Pet Medicine 10(2):59-65.
Wang SP, Chang Cl. 1998. Determ ination of parabens in cosmetic products by
supercritical fluid extraction and capillary zone electrophoresis . .
Analytica Chimica Acta 377 :85-93.
Zel J, Mazzara M, Savini C, Cordeil S, Camloh M, Stebih 0, Cankar K, Gruden K, Morisset 0, Van den Eede G. 2008. Method Validation and Quality Management in the Flexible Scope of Accreditation : An Example of ·
Laboratories Testing for Genetically Modified Organisms. Food Anal.