Comparative genome sequencing of
Drosophila
pseudoobscura
: Chromosomal, gene,
and
cis
-element evolution
Stephen Richards,
1,15Yue Liu,
1,2,3Brian R. Bettencourt,
4Pavel Hradecky,
4Stan Letovsky,
4Rasmus Nielsen,
5Kevin Thornton,
5Melissa J. Hubisz,
5Rui Chen,
1Richard P. Meisel,
6Olivier Couronne,
8,12Sujun Hua,
9Mark A. Smith,
4Peili Zhang,
4Jing Liu,
1Harmen J. Bussemaker,
10Marinus F. van Batenburg,
10,13Sally L. Howells,
1Steven E. Scherer,
1Erica Sodergren,
1Beverly B. Matthews,
4Madeline A. Crosby,
4Andrew J. Schroeder,
4Daniel Ortiz-Barrientos,
11Catharine M. Rives,
1Michael L. Metzker,
1Donna M. Muzny,
1Graham Scott,
1David Steffen,
1David A. Wheeler,
1Kim C. Worley,
1Paul Havlak,
1K. James Durbin,
1Amy Egan,
1Rachel Gill,
1Jennifer Hume,
1Margaret B. Morgan,
1George Miner,
1Cerissa Hamilton,
1Yanmei Huang,
4Lenée Waldron,
1Daniel Verduzco,
1Kerstin P. Clerc-Blankenburg,
1Inna Dubchak,
8Mohamed A.F. Noor,
11Wyatt Anderson,
14Kevin P. White,
9Andrew G. Clark,
5Stephen W. Schaeffer,
7William Gelbart,
4George M. Weinstock,
1and Richard A. Gibbs
11
Human Genome Sequencing Center and Department of Molecular and Human Genetics,
2Program in Structural and
Computational Biology and Molecular Biophysics, and
3W.M. Keck Center for Computational Biology, Baylor College of Medicine,
Houston Texas 77030, USA;
4FlyBase–Harvard, Department of Molecular and Cellular Biology, Harvard University, Biological
Laboratories, Cambridge, Massachusetts 021383, USA;
5Department of Biological Statistics and Computational Biology, and
Department of Molecular Biology and Genetics, Cornell University, Ithaca, New York 14853, USA;
6Intercollege Graduate Degree
Program in Genetics,
7Department of Biology and Institute of Molecular Evolutionary Genetics, The Pennsylvania State University,
University Park, Pennsylvania 16802, USA;
8Lawrence Berkeley National Laboratory, Berkeley, California 94720, USA;
9
Department of Genetics, Yale University School of Medicine, New Haven, Connecticut 06520, USA;
10Department of Biological
Sciences and Center for Computational Biology and Bioinformatics, Columbia University, New York, New York 10027, USA;
11
Department of Biological Sciences, Louisiana State University, Baton Rouge, Louisiana 70803, USA;
12U.S. Department of
Energy Joint Genome Institute, Walnut Creek, California 94598, USA;
13Swammerdam Institute for Life Sciences, University of
Amsterdam, The Netherlands;
14Department of Genetics, University of Georgia, Athens, Georgia 30602, USA
We have sequenced the genome of a second
Drosophila
species,
Drosophila pseudoobscura
, and compared this to the
genome sequence of
Drosophila melanogaster
, a primary model organism. Throughout evolution the vast majority of
Drosophila
genes have remained on the same chromosome arm, but within each arm gene order has been extensively
reshuffled, leading to a minimum of 921 syntenic blocks shared between the species. A repetitive sequence is found
in the
D. pseudoobscura
genome at many junctions between adjacent syntenic blocks. Analysis of this novel repetitive
element family suggests that recombination between offset elements may have given rise to many paracentric
inversions, thereby contributing to the shuffling of gene order in the
D. pseudoobscura
lineage. Based on sequence
similarity and synteny, 10,516 putative orthologs have been identified as a core gene set conserved over 25–55
million years (Myr) since the
pseudoobscura
/
melanogaster
divergence. Genes expressed in the testes had higher amino
acid sequence divergence than the genome-wide average, consistent with the rapid evolution of sex-specific proteins.
Cis
-regulatory sequences are more conserved than random and nearby sequences between the species—but the
difference is slight, suggesting that the evolution of
cis
-regulatory elements is flexible. Overall, a pattern of
repeat-mediated chromosomal rearrangement, and high coadaptation of both male genes and
cis
-regulatory
sequences emerges as important themes of genome divergence between these species of
Drosophila
.
15Corresponding author.
E-mail [email protected]; fax (713) 798-5741.
[Supplemental material is available online at www.genome.org. The annotated whole genome project has been
deposited into DDBJ/EMBL/GenBank under the project accession AADE00000000. The version described in this
paper is the first version, AADE01000000. The sequences of the proximal and distal Arrowhead breakpoints have
been deposited in GenBank with accession nos. AY693425 and AY693426. The following individuals kindly provided
reagents, samples, or unpublished information as indicated in the paper: P.J. de Jong and K. Osoegawa.]
Comparative genome sequencing is an important tool in the on-going effort to annotate and analyze genes, cis-regulatory ele-ments, and architectural features of genomes. A single genomic sequence provides a wealth of information about the number and location of genes, but the experimental confirmation of ge-netic function and regulation can be a painstaking process. The structure of the genetic code facilitates identification of con-served protein-coding regions (Nekrutenko et al. 2002), whereas approaches such as “phylogenetic footprinting” (Boffelli et al. 2003) may aid the identification of functional noncoding ele-ments. A recent small-scale study of fourDrosophilaspecies (Berg-man et al. 2002) suggested that the sequence divergence between
Drosophila pseudoobscuraandDrosophila melanogasteris appropri-ate for the identification ofcis-regulatory regions. Such a com-parison also provides support for gene predictions, allows con-served protein-coding sequences to be identified, and is a major rationale for theD. pseudoobscuragenome sequencing project.
Comparative genomic sequencing can also provide insights into the evolutionary mechanisms of genome rearrangement, which is of special interest in these species. Selection may favor inversions, because they maintain epistatic combinations within the inverted segment (Dobzhansky 1949; Charlesworth and Charlesworth 1973; Wu and Beckenbach 1983; Otto and Barton 2001), or selection may favor rearrangements that reorganize genes into clusters of coordinately expressed genes (Roy et al. 2002; Spellman and Rubin 2002; Lercher et al. 2003). Once es-tablished in populations, chromosomal inversions may play a role in the formation of new species (Noor et al. 2001; Navarro and Barton 2003).
Drosophilahas been a model system for studying the evolu-tion of chromosomes and gene order (Sturtevant and Tan 1937; Sturtevant and Novitski 1941). Chromosomal rearrangements have negative fitness consequences in many organisms because of the deleterious effects of segmental aneuploidy resulting from chromosomal segregation (reciprocal translocations and transpo-sitions) or recombination (pericentric inversions) (Swanson et al. 1981). InDrosophila, however, special features of meiosis avoid the negative fitness effect for one class of rearrangements— paracentric inversions (inversions with both breakpoints on the same chromosome arm). In male meiosis there is no crossing over and hence no recombinant aneuploid dicentric/acentric ga-metes. In female meiosis, where crossing over does occur, the dicentric/acentric recombinant chromosomes are directed into polar bodies rather than the functional gamete (Sturtevant and Beadle 1936). As a result, paracentric inversions are highly poly-morphic within populations of mostDrosophilaspecies (Sperlich and Pfriem 1986), and some of these inversions become fixed during speciation.
Sturtevant and Dobzhansky discovered a wealth of naturally occurring chromosomal inversion polymorphisms inD. pseudo-obscura, predominantly on the third and X-chromosomes (Stur-tevant and Dobzhansky 1936), through an examination of sali-vary chromosomes (Painter 1934). Ten of these arrangements are widely distributed and abundant. Dobzhansky first used paracen-tric inversion events to reconstruct relationships amongD.
pseu-doobscura and Drosophila persimilis third chromosomes (Dobzhansky and Epling 1944). Genes within theD. pseudoob-scurachromosomal inversions are likely targets of selection as the polymorphic gene arrangements form stable geographic clines (Dobzhansky and Epling 1944), from altitudinal clines in certain populations (Dobzhansky 1948a), exhibit seasonal cycling (Dobzhansky 1948a) and exhibit high levels of linkage disequi-librium (Schaeffer et al. 2003). More than 300 inversions have been detected across the six chromosomal arms ofD. melanogas-ter(Lemeunier and Aulard 1992), but only two arrangements per chromosome are widely distributed and abundant. An obvious question, therefore, is what is the mechanism responsible for differences in the distribution of inversions in different Dro-sophilagenomes?
Random breakage (Ohno 1973; Nadeau and Taylor 1984), transposon-mediated recombination (Krimbas 1992; Caceres et al. 1999; Mathiopoulos et al. 1999; Evgen’ev et al. 2000; Casals et al. 2003), and fragile breakpoints (Novitski 1946; Pevzner and Tesler 2003) have been suggested as possible mechanisms for generating paracentric inversions in natural populations, but there is little definitive evidence. Our study provides a unique opportunity to explore the origin of these rearrangements by examining sequences at junctions of synteny blocks between the two species.
Genome sequence of
D. pseudoobscura
We sequenced the genome of D. pseudoobscura using a whole genome shotgun method. In all, 2.6 million sequence reads were produced and assembled into a high-quality draft genome se-quence (the numbers of reads from libraries of different insert sizes are summarized in Supplemental Table S1). The sequence is comprised of 8288 contigs (average length 16.3 kb, N50 51.9 kb) joined by paired end read information into 755 scaffolds with an N50 of 1.0 Mb, covering a total of 139 Mb (Supplemental Table S2). Although the total number of reads attempted suggests a 13⳯coverage, the actual read coverage within the assembly is 9.1⳯. A description of the N50 scaffold best reflects the quality of the sequence. Fifty percent of the sequence is in scaffolds longer than scaffold contig 2803–contig 3631, the N50 scaffold. The N50 scaffold is 994,609 bp in length and is comprised of 15,143 sequence reads in 26 contigs. Of the sequence reads 2927 are from the 2.7-kb library, 7565 from the 3.4-kb library, 4413 from the 6.3-kb library, 178 are fosmid end sequences, and 19 BAC end sequences. The average Phred (Ewing and Green 1998; Ewing et al. 1998) quality score of the consensus contig sequence is 86.8, with 908,521 bp (91.3%) having the highest Phred Score of 90 and only 1198 bp (0.1%) having a Phred score <20. The total estimated length of the gaps is 15,143 bp or 1.5% of the scaffold sequence length. The quality of the sequence has been further assessed by comparison with a small amount of finished se-quence. From this comparison an error rate of 0.26⳯10ⳮ4was
estimated—see Methods for further information on this assess-ment.
(Muller 1940) (see Methods, ‘Anchoring sequence scaffolds to chromosomes’). These ultra-scaffolds have an N50 of ∼12 Mb,
with Muller elements C and E covered by single ultra-scaffolds, Muller element B comprising four ultra-scaffolds, and Muller el-ements A and D having five and six ultra-scaffolds, respectively.
Genome size
The chromosome arms ofD. pseudoobscuraare∼17% larger than
those ofD. melanogastersequence version 3 (Celniker et al. 2002) with the exception of Muller element C, which is approximately the same size (the sizes of the chromosome arms are shown in Supplemental Table S3). The assembly contains 156 Mb of se-quence in scaffolds with >1 contig of at least 1 kb, with 17 Mb of this in the form of reptigs (contigs produced from the separate assembly of highly repetitive sequence, then merged with the main assembly). We estimate the euchromatic portion to be∼131
Mb, based on the extent of the genome covered by and between scaffolds >100 kb anchored to chromosomes. This set of se-quence scaffolds is∼18% longer than the finishedD. melanogaster
euchromatic sequence and forms the basis of the data in Supple-mental Table S3. Much of the remaining sequence consists of small contigs resistant to scaffolding and anchoring. InD. mela-nogaster, many such small contigs mapped to heterochromatic regions of the genome, and we expect the same will be true of
D. pseudoobscura.
To compare unique sequence between the two genomes, we identified distinct 16-mer sequences within the assemblies. We found 111.9 Mb and 102.3 Mb of unique sequence in the
D. pseudoobscura and D. melanogaster assemblies, respectively. Thus, the additional sequence is not predominantly due to repeat expansion, unless such repeats are old enough to have signifi-cantly diverged from one another. To determine whether the relative additional sequence resides in a small number of large differences or a large number of smaller differences, we compared orthologous pairs of intergenic lengths in regions where syntenic order was conserved. The total length of these regions is 65 Mb in
D. pseudoobscuraand 59 Mb inD. melanogaster—∼11% longer in
D. pseudoobscura. The increase in length appears to be fairly evenly distributed over many intergenic regions and not due to a small number of large sequence insertions. The frequency of or-thologous intergenic and intron length ratios is shown in graphi-cal form in Supplemental Figure S1. The mean ratio of the or-thologous intronic length pairs is very close to zero, indicating that intron length is not the source of the increased size of the genome. The orthologous intergenic pairs analyzed show an in-creased length of∼17% inD. pseudoobscurarelative toD.
mela-nogaster.
Genome coverage
A biologically relevant measure of genome size is the gene con-tent. InD. melanogasterrelease 3.1, 13,676 genes have been an-notated in the euchromatic portion of the assembly (Misra et al. 2002). Others in the heterochromatic portion of the assembly bring the total gene content ofD. melanogasterto∼14,000. More
than 90% of these genes can be putatively found using TBLASTN to search theD. pseudoobscuraassembly. Of this number, 10,516 are likely orthologs (see annotation and gene prediction). The genome coverage of the assembly was additionally estimated by comparison with the 1.1 Mb total finished sequence: 96.3% was contained in the assembly. A search for a set of 22,347D. pseu-doobscuraEST sequences found that 96.2% could be aligned to the assembly. Together, these data indicate that the draft
se-quence included >96% of the euchromatic genome inD. pseudo-obscura.
Syntenic map
A map summarizing the syntenic regions betweenD. pseudoob-scuraandD. melanogasteris extremely useful in the identification of orthologous genes, for the identification of chromosomal re-arrangements, and the seeding of genome alignments. As protein sequences provided more robust similarity signals than noncod-ing sequences, the initial syntenic map was based on TBLASTN comparison of release 3.1 D. melanogaster protein predictions (one chosen for each gene) to the D. pseudoobscura“freeze 1” genomic sequence. In most cases, theD. pseudoobscurasequence match was the best TBLASTN hit to a givenmelanogasterprotein. Semiautomatic inspection was used to refine the initial set of matches. Occasionally, a less strong TBLASTN hit was selected as the “valid” match if it resided in the expected linkage location, closing a gap in a run of D. melanogaster–D. pseudoobscura syn-tenic conservation. Matches that were inconsistent with synsyn-tenic data, where other data were consistent with the true match fall-ing into a sequence gap, were rejected as false positives. The syntenic relationships of theD. melanogasterprotein toD. pseu-doobscurasequence anchor points described by these BLAST hits were then manually inspected to define and refine the order of syntenic blocks. Synteny blocks were defined as runs of consecu-tiveD. melanogasterprotein sequence–D. pseudoobscuragenomic sequence pairs. Within a syntenic block, gaps were permitted (since there are genes that fall into sequence gaps) and an occa-sional gene out of order was also permitted (if it fell within five genes of its expected location). Gene duplications in one species could be perceived as synteny breaks. Gene duplications were not considered in the derivation of synteny blocks.
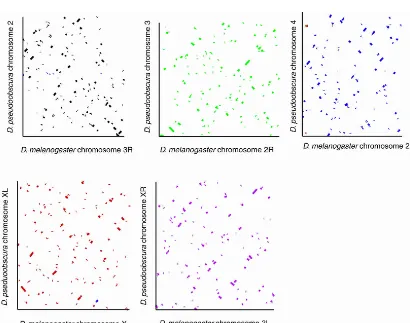
Figure 1 shows the synteny blocks of the chromosomes are short and extremely mixed, but the great majority of syntenic sequences are found on the same Muller element inD. pseudoob-scuraas they are inD. melanogaster. Thus, as expected, the ma-jority of the chromosomal rearrangements between theD. pseu-doobscura and D. melanogaster lineages have been confined to related chromosome arms. The average number ofD. melanogas-tergenes in a syntenic block is 10.7, corresponding to∼83 kb. The
length distribution of syntenic blocks on different Muller ele-ments is shown in Supplemental Figure S2.
Alignment with
D. melanogaster
We produced several alignments ofD. pseudoobscuraandD. me-lanogaster, and focused on a BLASTZ alignment filtered by com-parison with our syntenic map (see Methods). The number of bases that could be aligned (alignability) of the different chro-mosome arms betweenD. pseudoobscuraandD. melanogaster av-erages∼48% and is shown for the five large chromosome arms in
that amino acid identities of orthologs between the two species on Muller elements A and D are not markedly different from the other chromosomes. Possibly, the haploid nature of the X-chromosome in males allows faster accumulation of differences than in the autosomes.
Annotation and gene prediction
Using TBLASTN we identified 12,179 regions of theD. pseudoob-scuragenome containing a putative ortholog of aD. melanogaster
gene. These regions were compared to the locations of gene mod-els produced by three separate gene prediction programs (see Methods). Of the 12,179 regions containing an ortholog of aD. melanogaster gene, 9946 overlapped a D. pseudoobscura gene model predicted by one or more of the prediction programs and for which the proteins in the two species were reciprocal best hits. These 9946 gene models are annotated in the GenBank sub-mission, and the remaining 2233 gene loci have been annotated in the GenBank submission as gene loci identified by TBLASTN analysis but lacking gene models. Despite being a draft sequence, only 9.6% of the gene models contain sequence gaps. A total of 19.9% of the gene models align to the entire orthologous D. melanogaster gene model, while the remaining 80% of the D. pseudoobscura gene models align to an average of 92% of the orthologousD. melanogastergene model. A frequency histogram
of the percent identity within alignments of orthologous pro-teins is shown in Supplemental Figure S10. The mean amino acid identity for all of the gene pairs was 77%, with a mode around 85%. These gene models provide an excellent starting point for further annotation of the D. pseudoobscura genome. A modest amount of EST sequence is available inD. pseudoobscura. Of the 12,179 gene loci, 3859 overlap with one or more ESTs regardless of the strand, among them 3592 overlapping with one or more ESTs on the same strand. Unfortunately, the only cDNAs so far sequenced are from a non-normalized embryonic library; thus, without additional tissues or normalization, we expect little in-crease in this coverage.
This analysis of gene loci leaves two interesting sets of genes. First, there are 1485 (10.9% of all gene models)D. melanogaster
gene models in FlyBase without associatedD. pseudoobscuragene loci. We believe that the majority of these 1485 “orphaned”
D. melanogastergenes haveD. pseudoobscuraorthologs, but they fail to be identified either because theD. pseudoobscuraortholog is located within a sequence gap in the current WGS assembly, or because there is no supporting synteny evidence. Of the remain-der (which we expect are at most 500 genes), this set no doubt contains rapidly evolving genes whose sequence similarity is too low for our TBLASTN cutoffs, and possibly novel genes that have arisen since theD. pseudoobscura–D. melanogasterdivergence. The
reverse set ofD. pseudoobscuragene predictions withoutD. mela-nogaster counterparts cannot currently be assessed. The three gene prediction programs produced 14,646 gene predictions (many of these are overlapping between the three programs) that did not correspond to a TBLASTN-identified putative ortholog to a D. melanogaster gene model. The majority of these are GENSCAN and TWINSCAN predictions as these do not require a
D. melanogasterprotein like GeneWise. We expect that most of these are invalid predictions, but that some will turn out to be novel genes not present inD. melanogaster, while some others will turn out to haveD. melanogasterorthologs that have thus far escaped annotation by FlyBase. Additional data are required to distinguish between invalid predictions and true genes unique to
D. pseudoobscura. Until such data are present, we are reluctant to speculate further on the gene set unique toD. pseudoobscura.
Chromosomal evolution
Comparison of theD. pseudoobscuraandD. melanogastergenome sequences identifies conserved linkage blocks and the associated rearrangement breakpoints in the two lineages. Despite strong conservation of sequence blocks within the five orthologous chromosome arms, each chromosome arm has experienced ex-tensive internal shuffling, much of which can be interpreted as the result of a sequential series of paracentric inversions (Fig. 1). No large interarm translocations were observed (with one pos-sible exception), consistent with previous small-scale analyses (Ranz et al. 2001). D. pseudoobscurascaffold 7059_2327 had a mixture of best hits from genes located at the base of 2L and 2R inD. melanogaster. This exception may therefore reflect a class of pericentric inversions whose breaks are so proximal on each arm that recombination does not overlap the inversion, allowing them to be tolerated without loss of fitness. A similar pericentric inversion has been observed within themelanogasterspecies sub-group in Drosophila erecta, Drosophila teissieri, and Drosophila yakubabased on chromosome banding patterns (Lemeunier and Ashburner 1976), and it is possible that theD. melanogastergene distribution between proximal 2L and 2R is not ancestral.
Single gene transpositions between Muller elements were observed, and in some cases a lack of introns in one ortholog indicates that these arose through retrotransposition events. Analysis of 27 well-defined retrotransposition events showed that 11 were from the D. melanogaster X-chromosome to a
D. pseudoobscuraautosome versus possible other directions (prob-ability < 0.01, 2 test), suggesting that gene movement away from the X-chromosome is favored, consistent with observations made by Betran et al. (2002). Thus far, transcripts from seven of the 11 D. melanogaster genes derived from the X to autosome transpositions have been found only in testis-derived EST librar-ies and absent from other EST collections derived from other tissues. This is consistent with the hypothesis that the selective pressure favors testis-specific gene movement to autosomes, en-suring gene expression despite X inactivation during spermato-genesis (Betran et al. 2002).
Chromosomal rearrangements
Transposable or repetitive elements may be involved in the gen-esis of rearrangements inDrosophilachromosomes through re-combination between offset copies of an element in reverse ori-entation (Potter 1982; Collins and Rubin 1984; Engels and Pres-ton 1984; Blackman et al. 1987; Lim 1988; Krimbas 1992; Lyttle and Haymer 1992; Sheen et al. 1993; Ladeveze et al. 1998;
Caceres et al. 1999; Mathiopoulos et al. 1999; Evgen’ev et al. 2000; Casals et al. 2003). The differences in gene order observed between D. melanogasterand D. pseudoobscurareflect the rear-rangement history since the two species diverged from a com-mon ancestor (known rearrangements since the species diverged are depicted in Supplemental Fig. S6). Genes can move to differ-ent chromosome arms either through transpositions or pericen-tric inversions or can be shuffled within chromosomal arms via paracentric inversions. In all of these cases, junctions between adjacent syntenic blocks contain rearrangement breakpoints that have occurred in either theD. pseudoobscuraorD. melanogaster
lineage. Most of the rearrangement breakpoints are interspecific inversions long ago fixed in one or the other lineage, but eight breakpoints on Muller element C are the result of four inversion mutations that converted the ancestral D. pseudoobscura Tree Line arrangement into the Arrowhead arrangement (the chromo-some arrangement in theD. pseudoobscurastrain whose genome was sequenced).
A total of 921 rearrangement breakpoints were identified in the comparison of theD. pseudoobscuraandD. melanogaster ge-nomes. This number is likely an underestimate as breaks caused by scaffold ends were excluded if the map location of the next scaffold was not known. It has been estimated that 460 inver-sions have occurred in the two lineages (Ranz et al. 1997). We compared the sequences within the rearrangement breakpoints to determine (1) if breakpoints shared common sequence ele-ments; (2) if shared sequences are similar to known transposable elements; (3) if the distribution of common sequence elements is correlated with the presence of inversion polymorphism; and (4) if sequences between breakpoints are similar between species. This analysis did not include a comparison toAnopheles gambiae
because the intra- and interchromosomal rearrangements be-tweenD. melanogasterand the mosquito genomes have been too extensive (Zdobnov et al. 2002).
Identification of intraspecific inversion breakpoints
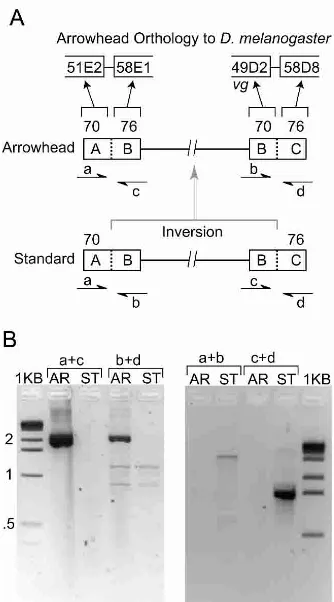
PCR was used to identify the two breakpoints for the inversion that converted the Standard gene arrangement into the Arrow-head gene arrangement. The vestigial gene is located near the distal Standard to Arrowhead breakpoint based on in situ hybrid-ization (Fig. 2; Schaeffer et al. 2003). Using the synteny map described above, a break in conserved gene order between
D. pseudoobscura and D. melanogaster, located 17 kb 3⬘of the vestigial gene (Schaeffer et al. 2003) was confirmed as the distal Arrowhead breakpoint with a PCR amplification that spanned the breakpoint (Fig. 2). The proximal Arrowhead breakpoint was also mapped with conserved linkage information and verified with PCR analysis (Fig. 2).
Dobzhan-sky 1946; Schaeffer et al. 2003); however, it will require further work to identify which genes or combination of genes within the inverted regions are the targets of selection.
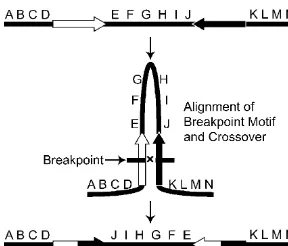
The junctions between syntenic blocks for the proximal and distal Arrowhead breakpoints, as defined by their flanking syn-tenic blocks, are 20 and 5 kb in length, respectively. Comparison of the two junctions revealed two, short repeat sequences of 128 and 315 bp (“breakpoint motifs”) (Fig. 3). The breakpoint motifs are in reverse orientation relative to each other, suggesting that pairing followed by ectopic exchange led to the Arrowhead gene arrangement. The breakage event between elements was stag-gered, at opposite ends of repeats p1F and d1B (Fig. 3). The simi-larity among the 13 copies of the 128-bp repeat vary between 49.6% and 96.9%, while similarity among the three copies of the 315-bp repeat 2 varies between 83.7% and 86% (alignments are shown in Supplemental Fig. S7). The sequences show no
signifi-cant similarity to any known Drosophilatransposable element sequence, and we have been unable to detect coding function for either a transposase or a reverse transcriptase near the breakpoint motifs.
Analysis of interspecific breakpoints
Junctions between syntenic blocks from the six Muller elements were extracted from D. pseudoobscura and D. melanogaster ge-nomic sequence. The location and motif presence of each junc-tion is listed in Supplemental Table S9. Juncjunc-tions without in-ferred gaps have an average length of 5.6 kb, and tend to be A/T-rich sequences with a mean A+T content of 60%. These junc-tion statistics are shown by Muller elements in Supplemental Table S4.
The breakpoint motif found at the two Arrowhead break-points ofD. pseudoobscurais also found at other synteny break-points. A BLAST analysis of each breakpoint junction sequence against the set of all breakpoint junctions found that >60% of the sequences had at least one High-scoring Segment Pair (HSP) to one other breakpoint within the genome (E-value, 1⳯10ⳮ5
) (Supplemental Table S5); this similarity is largely due to the breakpoint motif. Each chromosomal arm had at least one break-point that had an HSP to >40% of breakbreak-point sequences, sup-porting the idea that the breakpoint motif constitutes a single repetitive element family that has numerous degenerate copies in theD. pseudoobscuragenome. The higher frequency of the break-point motif within the junction sequences on Muller elements C and E led to higher breakpoint similarity than Muller elements A, B, and D when a nonparametric Kruskal-Wallis test was used. The distribution of match fractions for breakpoints on the five major Muller elements is shown in Supplemental Figure S8. The inter-breakpoint match frequency for Muller element F is not pre-sented because only seven breakpoints were identified on this chromosome. This analysis shows that D. pseudoobscura break-points tend to have similar sequences; however, the repeat is not restricted to the two chromosomes segregating for inversions withD. pseudoobscura. A similar analysis of breakpoint junctions inD. melanogasterfailed to detect an abundant repeat sequence (Supplemental Fig. S8).
Distribution of the breakpoint motif
The breakpoint motif is found at other locations in the genome, but the frequencies are much reduced (Table 1). The breakpoint motif is found at the highest frequencies at junctions between syntenic blocks (33.8%–42.6%), at moderate frequencies in non-coding sequences (10.3%–15.3%), and at minimal frequencies in coding regions (0.4%–0.8%). The motif frequencies in break-points and noncoding sequences of the Muller element F are high relative to the other chromosomal arms. This may reflect the small numbers of sequences on the Muller element F, the dot chromosome, or more likely, that the heterochromatic nature of the chromosome allows a greater accumulation of repetitive el-ements (Sun et al. 2000). These observed frequency differences are significantly different from each other with2heterogeneity tests (S.W. Schaeffer, unpubl.). These data suggest that the break-point motif is nonrandomly distributed in the genome and is enriched in breakpoints.
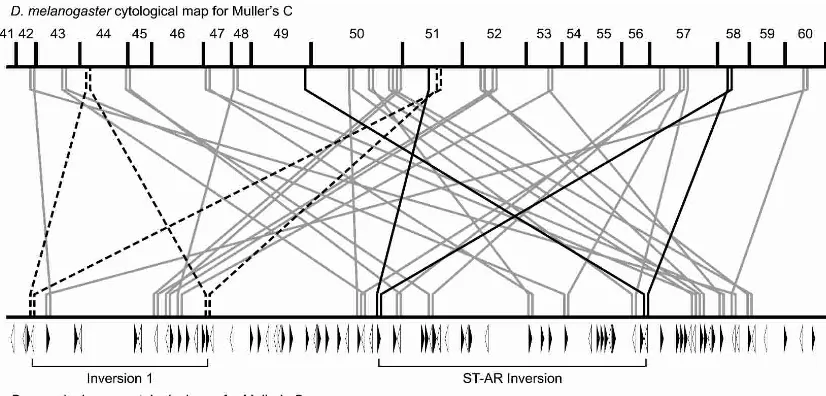
We asked whether breakpoint motifs are associated with paracentric inversions on Muller element C (Fig. 4). In all, 80 junctions between syntenic blocks on Muller element C contain the motif. Of those, 18 motifs are within the boundaries of two
ancestral syntenic blocks and can be hypothesized to generate simple two-break rearrangements. The other 62 motif-containing junctions were likely involved in multiple rearrangement events where exchanges involved a motif within an ancestral syntenic block and a motif at a pre-existing conserved linkage junction. The high frequency of motifs at pre-existing conserved linkage junctions suggests that reconstructing the rearrangement history betweenD. pseudoobscuraand D. melanogasterwill be difficult, because breakpoints have been used multiple times. In addition, this observation suggests that the estimate of 460 rearrangements is likely to be an underestimate of the true number of rearrange-ments that have occurred during the D. pseudoobscura and
D. melanogasterlineages. Figure 4 also shows the orientations of the breakpoint motifs (indicated by open and filled triangles), which alternate more frequently than expected at random based on a runs test (ts= 2.20,P< 0.05) (Sokal and Rohlf 1981).
The interbreakpoint sequence similarity is not solely due to the breakpoint motif seen in the Standard to Arrowhead break-points. Transposable elements and repetitive sequences were found in the junctions between syntenic blocks, but the junc-tions were not enriched for these known transposable elements. For example, someD. pseudoobscurabreakpoints had sequences similar to the mini-me element (Wilder and Hollocher 2001), which uses reverse transcriptase for retrotransposition (S.W. Schaeffer, unpubl.). Themini-meelement is found at a lower fre-quency at breakpoints than the breakpoint motif (3.4% vs. 38.9%) and is not found at significantly different frequencies between breakpoints and noncoding regions with 2 heteroge-neity tests.
A phylogeny of the breakpoint motifs, shown in Supple-mental Figure S9, which are 85% identical on average, has many long terminal branches. This suggests that the breakpoint motif
Figure 3. Structure of the repeats within the breakpoints that converted the Standard gene arrangement into the Arrowhead arrangement. The heavy line at the bottom indicates Muller element C, and the tick marks indicate the locations of the proximal and distal breakpoints for the Arrowhead inversion. The black histograms at thetopindicate the frequency that a BLAST High-scoring Segment Pair (HSP) included a particular nucleotide in BLASTN comparison of each breakpoint to the entire genome (E-valueⱕ1⳯10ⳮ5). Two repeat families of 128 and 315 bp (open and filled boxes,
respectively) are shown within the two breakpoint regions within the detail regions at thetopof the figure. The individual repeats were labeled with a three-letter designation, where the first letter indicates proximal or distal, the number indicates the repeat family, and the last letter indicates the distinct repeat copy. Larger repeats can be generated from the small repeats such as the 443-bp repeat created by the adjacent 128- and 315-bp repeats. The dashed box indicates the putative repeat unit involved in the rearrangement event, and the triangles indicate the approximate location of the DNA breaks with respect to the repeat motif.
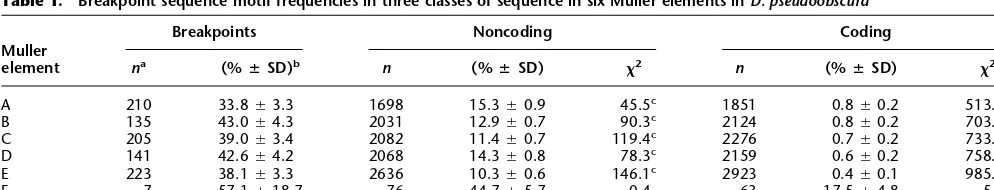
Table 1. Breakpoint sequence motif frequencies in three classes of sequence in six Muller elements inD. pseudoobscura
Muller element
Breakpoints Noncoding Coding
na (%
ⴣSD)b n (%
ⴣSD) 2 n (%ⴣSD) 2
A 210 33.8Ⳳ3.3 1698 15.3Ⳳ0.9 45.5c 1851 0.8
Ⳳ0.2 513.6c
B 135 43.0Ⳳ4.3 2031 12.9Ⳳ0.7 90.3c 2124 0.8Ⳳ0.2 703.0c
C 205 39.0Ⳳ3.4 2082 11.4Ⳳ0.7 119.4c 2276 0.7Ⳳ0.2 733.4c
D 141 42.6Ⳳ4.2 2068 14.3Ⳳ0.8 78.3c 2159 0.6
Ⳳ0.2 758.0c
E 223 38.1Ⳳ3.3 2636 10.3Ⳳ0.6 146.1c 2923 0.4
Ⳳ0.1 985.8c
F 7 57.1Ⳳ18.7 76 44.7Ⳳ5.7 0.4 63 17.5Ⳳ4.8 5.9c
aThe total number of sequences within each category.
bThe percentage of sequences within each category that matched the conserved sequence motifⳲstandard deviation. The three categories are
breakpoints, sequences at the boundary of two conserved linkage groups; noncoding, sequences that are not breakpoints or coding; and coding, sequences of protein-coding genes including introns.
cProbability of the 2value for the heterogeneity test with one degree of freedom isⱕ0.05 after applying a Bonferroni correction for multiple
has rapidly radiated throughout theD. pseudoobscura genome. Breakpoint motifs fail to form monophyletic clusters by chromo-some or region of origin, rejecting the idea that these elements are unique to a particular chromosome or have diversified based on their chromosome of origin. Also, breakpoint motifs from the same local genomic region are not more similar than sequences separated by longer distances. In fact, the two motifs that were the most similar in this subset of sequences are from different chromosomes.
Conservation of genes between
D. pseudoobscura
and
D. melanogaster
To investigate the conservation of genes betweenD. pseudoob-scuraandD. melanogaster, we examined both the nucleotide and amino acid sequences of orthologous genes. Using the filtered global BLASTZ alignment and D. melanogaster3.1 gene model annotations (Misra et al. 2002), we were able to investigate the conservation of gene features between D. pseudoobscura and
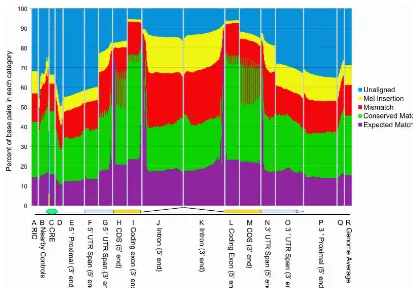
D. melanogaster. Figure 5 shows the degree of sequence conserva-tion in promoter regions, upstream regions, untranslated regions (UTRs), coding regions, introns, and other gene features, aver-aged over a large number of orthologous D. pseudoobscura–D. melanogastergene feature pairs. (The number of gene feature pairs analyzed for each category varies from 2300 to 43,000 as shown in Supplemental Fig. S11.) The average identity of coding se-quence at the nucleotide level is∼70% for the first and second
base pair of the codon, and 49% for the wobble base. Intron sequences are ∼40% identical, UTRs 45%–50%, and
protein-binding sites from the literature 63%. Within our genome align-ment, 46% of totalD. melanogasterbase pairs are identical, and 71.3% ofD. melanogasterbase pairs are in aligned regions. We also examined sequence conservation at the protein level. Supplemental Figure S10 depicts the percent amino acid identity of aligned orthologous protein sequences as a frequency histo-gram for alignments for four sets of proteins—all, male-specific,
transcription factors, and proteins with functions in the nervous system. The majority of protein sequences show >70% amino acid identity, with a mode around 85%.
Male-specific proteins are less conserved than others
In contrast to the overall mode of 85% amino acid identity, pro-teins with ESTs derived from testis-specific libraries had a mean amino acid identity of just 60%. This suggested that there might also be an excess of testis-specific genes for which orthologs might not be found because of overly rapid divergence. We searched forD. melanogastergenes for which no ortholog could be found in the entireD. pseudoobscurasequence set including unassembled sequence reads. We focused on cases in which the syntenic neighbors of theD. melanogasterorthologs of the miss-ingD. pseudoobscuragene were present. We found 75 such genes, 20 of which contained no introns, suggesting they might be the result of a retrotransposition event. It is impossible to ascertain the origins of this class of genes without additional data, but of the 20 intronlessD. melanogastergenes not found inD. pseudo-obscura, 11 were male specific, based on representations in testis-derived EST libraries and absence from EST libraries testis-derived from other tissues (2-value = 59.7, df = 1,p< 0.00001). Furthermore, in 761 cases in which putative orthologous genes with testis-specific derived ESTs could be identified, the mean identity was
∼15% more divergent than for other orthologs (p< eⳮ75)
(Supplemental Fig. S10).
Evolutionary analysis of divergence of orthologous gene pairs
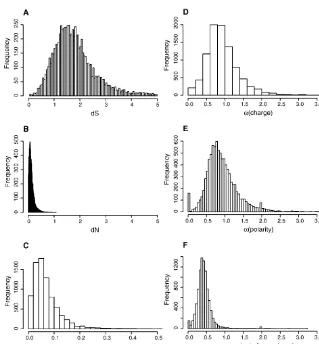
Coding regions of genomes have a built-in contrast between si-lent, synonymous sites and amino-acid-replacing nonsynony-mous sites that allow a variety of evolutionary inferences. The median number of synonymous substitutions per synonymous site betweenD. pseudoobscuraandD. melanogasterwasdS= 1.79,
and the median number of nonsynonymous substitutions per nonsynonymous site wasdN= 0.14, with a skewed distribution
around both values (Fig. 6). Estimates of mediandSfor XL, XR,
and the autosomes were 1.82, 1.75, and 1.81, indicating that silent positions have suffered multiple hits per site. XR had a significantly lower dS by a nonparametric Kruskal-Wallis test
(H= 14.39,P< 0.001). Median values ofdNfor XL, XR, and the
autosomes were 0.118, 0.105, and 0.108, and XR is again signifi-cantly lower (H= 9.92,P= 0.007). This is a surprise, as one might expect the translocation of the Muller element D from an auto-some to the X (to form XR) would result in an acceleration in evolution on this arm.
As the high level of synonymous divergence between D. pseudoobscuraversusD. melanogastergene sequences resulted in low power and low reliability to detect positive selection using thedN/dSratio, an alternative test was required. We fitted
substi-tution models that split the nonsynonymous substisubsti-tution rate into two bins (radical vs. conservative as defined in Zhang 2000), each with its own rate parameter (see Methods). After controlling for several factors that can influence this test (Dagan et al. 2002;
Smith 2003), we use a rate ratio of radical to conservative amino acid substitutions >1 to identify an accelerated rate of radical changes. The set of genes such that the probability a false positive is <5% (the 5% false discovery rate set) were identified from the
P-values associated with the likelihood ratio test. There were 27 genes in the polarity 5% FDR set and 44 genes in the 5% FDR set for charge, providing rather conservative sets of genes showing excess rates of radical amino acid substitution (these genes are listed in Supplemental Tables S6 and S7). The list includes several transcription factors and activators, trithorax group genes, genes involved in innate immunity, cytochrome P450s, and chorion genes, reflecting a diverse set of biological functions that may have faced positive selection.
Conservation of known regulatory elements
To investigate conservation ofcis-regulatory elements (CREs), we collected a set of experimentally characterized regulatory sites
Figure 5. Averaged conservation of different segments of a “prototypical gene.” Conservation statistics were computed over thousands of aligned pairs of regions of various types, aligned at different reference points. At each position we compute the fraction of aligned pairs that have identical bases at that position (green + purple tiers), have mismatched bases (red),melanogasterbases aligned to deleted bases inpseudoobscura(yellow), or are unaligned in our synteny-filtered BLASTZ alignment (blue). The purple tier shows the fraction of bases that would be expected to match by chance given the base composition at that position in both species. The expected match is <25% because of the inclusion of unaligned and deleted sequences; if these are removed, the baseline is∼28% because of the slight AT richness of the genome. The vertical panels correspond to different segments of a prototypical
curated by the FlyBase project from published papers. We re-stricted our attention to sites of length <50 bp that seemed likely to correspond to individual CREs. Our collection comprised 142 sites over 30 genes, characterized using a variety of experimental methods, ranging from in vitro binding assays to detection of a mutational phenotype. Of these sites, 63% were upstream of their respective gene, 25% were internal to the gene, and 6% were downstream of their respective gene; all of the sites were analyzed. The modal position of the sites was 2 kb from the putative transcription start site, and the median length was 14 bp. At least 83% of the sites were described as protein-binding sites and the remainder were characterized as regulatory sites, although many of these are likely to be protein-binding sites as well.16
In order to assess whether these regulatory elements were more conserved than expected by chance, we needed some way
to estimate the expected sequence similar-ity in the absence of functional constraints. One difficulty is that since conservation sta-tistics vary in different parts of the genome, and in different regions around genes (see Fig. 5), a test of CRE conservation must con-trol for the effects of the local genomic re-gion. We therefore created two sets of con-trol sites for comparison with the CRE set: random intergenic control (RIC) sites, matched to the CREs for size but randomly positioned in noncoding intergenic se-quence, and nearby sites, systematically off-set from each CRE by offoff-sets fromⳮ250 to +250 bp in increments of 50 bp. Our expec-tation was that the contrast with nearby sites might be overly conservative, because these may overlap other known or un-known functionally constrained sites, whereas the comparison with RICs might not be stringent enough, since it would de-tect neighborhood as well as CRE-specific effects. The three sets of sites enabled three pairwise contrasts between the distributions of percent identity values, for which we used the Kolmogorov-Smirnov test for com-parison of distributions (see distribution in Fig. 7, results in Table 2). All three contrasts were statistically significant.17 Figure 7
shows that the CRE percent identity distri-bution has an excess of values >80% and a reduction of values around 50% compared to nearby sites, presumably as a result of stabilizing selection. It suggests that regions with 75%–100% conservation would be most promising for detecting regulatory el-ements, using conservation-directed motif search or discovery methods such as those described by Grad et al. (2004). However, it is worth noting that the mean conservation in aligned CREs of 72%18
amounts to∼10
identical bases in 14, whereas the nearby sites, at∼66% identical, would be expected
to have 9.24 identical bases in 14. That difference, though sta-tistically significant, amounts to <1 bp of excess conservation per site. Such a slight difference in conservation would appear to offer scant hope of identifying CREs through pairwise sequence conservation alone in these species. Additional information, such as knowledge of gene expression patterns and known mo-tifs, as in Grad et al. (2004), or genome sequences of additional related species, as in Kellis et al. (2003), will be needed.
Discussion
Evolutionary model of genomic rearrangement
A striking feature of conservation betweenD. melanogasterand
D. pseudoobscurais the overwhelming degree of conservation of
16To the best of our knowledge, a comprehensive curated collection of
ex-perimentally determinedcis-regulatory element information does not exist at the present time; such a resource would be of great value for analyses such as this.
17The magnitude of thep-values is in part a function of the different set sizes
and should not be viewed as an estimate of the magnitude of the effect.
18This figure corresponds to 51.3% identity for all sites, because∼70% of sites
are at least partially aligned. Figure 6. Distributions ofdN,dS, and radical and conservative amino acid changes. (A)
Distri-bution ofdSand (B) distribution ofdN(numbers of synonymous substitutions per synonymous site
and of nonsynonymous substitutions per nonsynonymous site). (C) Distribution of the ratio=dN/
dSfor themelanogaster–pseudoobscuracomparison of 9184 inferred orthologous protein-coding
genes. (D–F) Distributions of␣, the ratio of rates of substitution that are radical to those that are conservative, based on 9184 alignments of orthologous protein-coding genes inD. pseudoobscura
gene synteny. This contrasts with theA. gambiae–D. melanogaster
comparison, where there is a tendency for far weaker arm con-servation. Thus, although the basic mechanism favoring para-centric rearrangements appears to be a dipteran-wide phenom-enon, over longer evolutionary time (250–300 Mya since the di-vergence ofAnophelesandDrosophila, compared with 25–55 Mya since the divergence of D. melanogaster and D. pseudoobscura) (Beckenbach et al. 1993; Russo et al. 1995; Tamura et al. 2003) there is clearly a breakdown of synteny (Zdobnov et al. 2002). Perhaps scaffold 7059_2327 with its mixture of proximally lo-cated genes fromD. melanogaster2L and 2R arms is a hint at one mechanism that can, over long evolutionary time, lead to exten-sive reshuffling of genes between arms of a chromosome.
Previous investigations have identified specific cases of transposons and repetitive sequences at inversion
break-points (Lyttle and Haymer 1992; Caceres et al. 1999; Mathiopou-los et al. 1999; Evgen’ev et al. 2000; Casals et al. 2003), and in other cases, repetitive elements have not been seen at inver-sion breakpoints (Wesley and Eanes 1994; Cirera et al. 1995). This study provides evidence that repetitive sequences can effect rearrangements on the genome scale, and may be the cause of the majority of inversions. Several pieces of evidence are con-sistent with the breakpoint motif being causal in the genera-tion of chromosomal rearrangements in the D. pseudoobscura
lineage. The breakpoint motifs at opposite ends of the Arrowhead inversion are in reverse orientation, consistent with a mecha-nism where ectopic exchange generates an inversion event (Fig. 8). The conserved sequence motif is virtually absent from intron and coding sequences. This suggests that strong purifying selec-tion has acted to prevent the accumulaselec-tion of this sequence within introns. An alternative explanation is that intron se-quences are inaccessible either because of a nucleotide com-position unfavorable for motif insertion, or because the introns are in an unfavorable location with respect to chromatin struc-ture. If the conserved motif serves as the target for rearrange-ments, then inversions that use elements within a gene would cause loss-of-function mutations that would be quickly removed from populations (Charlesworth et al. 1992). Repeated se-quences have also been detected at conserved linkage break-points among trypanosome species (Ghedin et al. 2004). The analysis of repeat structures within breakpoints should be viewed with caution. Each breakpoint sequence should be viewed as a composite of repetitive sequences. The breakpoint motif repre-sents the largest family of repeats within the D. pseudoobscura
genome detected to date, but other repeats within junctions of conserved lineage may contribute to the process of genomic re-arrangement.
One problem with the high frequency of the breakpoint motif is that ectopic exchange between elements in the same orientation would lead to deletion mutations. The lack of puri-fying selection on the breakpoint motif has allowed for its rapid decay through the accumulation of nucleotide and indel substi-tutions. These data are consistent with the “dead-on-arrival” el-ements of Drosophila virilisthat preferentially delete sequence (Petrov et al. 1996; Petrov and Hartl 1998). As a consequence, few
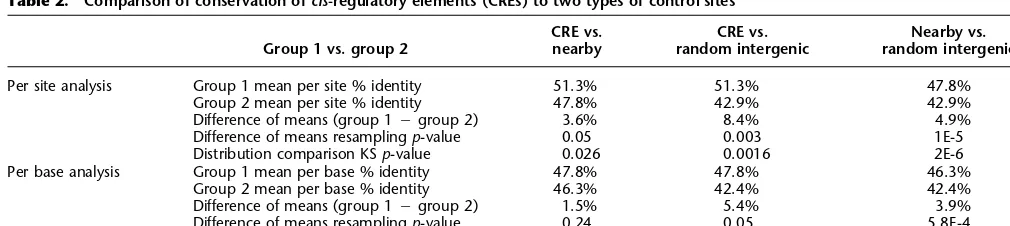
Table 2. Comparison of conservation ofcis-regulatory elements (CREs) to two types of control sites
Group 1 vs. group 2
CRE vs. nearby
CRE vs. random intergenic
Nearby vs. random intergenic
Per site analysis Group 1 mean per site % identity 51.3% 51.3% 47.8%
Group 2 mean per site % identity 47.8% 42.9% 42.9%
Difference of means (group 1ⳮgroup 2) 3.6% 8.4% 4.9%
Difference of means resamplingp-value 0.05 0.003 1E-5
Distribution comparison KSp-value 0.026 0.0016 2E-6
Per base analysis Group 1 mean per base % identity 47.8% 47.8% 46.3%
Group 2 mean per base % identity 46.3% 42.4% 42.4%
Difference of means (group 1ⳮgroup 2) 1.5% 5.4% 3.9%
Difference of means resamplingp-value 0.24 0.05 5.8E-4
For each CRE 20 RICs were generated by randomly choosing sites of the same length as the CRE, on the same chromosome and strand, and rejecting any that overlapped a known gene. Then 10 nearby control sites were generated for each CRE by adding positive and negative (i.e., 3⬘and 5⬘) offsets of 50, 100, 150, 200, and 250 bp to the coordinates of each true CRE. Percentage identities for all CRE and control sites were computed relative to reference alignment, on both a per site and per base basis. Unaligned bases, mismatchs, andD. melanogasterinsertions contributed zeros to % identity results;D. pseudoobscurainsertions were ignored. The distributions of % identity values were clearly not normal, thus we avoided using tests such as thet-test that assume normality. We compared the per site and per base mean % identities of each group using a resampling test, in which thep-value of the observed difference was estimated as the frequency (over a million trials) in which a value as large or larger than the observed CRE mean was observed in an equal-sized sample of control sites. Similarly, thep-value of the difference between the two control sets was estimated using a randomization test (over a million trials) in which the sets mixed and then repartitioned into corresponding mock control sets. We compared the distributions using the Kolmogorov-Smirnov test, which measures the likelihood that samples came from the same continuous distribution. Figure 7. Smoothed distributions of percent identity values for the
intact elements are capable of ectopic exchange. Molecular evo-lutionary studies of homologous breakpoint motifs will be nec-essary to test the element degradation hypothesis. The conclu-sion that the conserved sequence element causes paracentric in-versions should be tempered as other possible explanations for the coincidence of the breakpoint repeat and inversion break-point may exist.
One can speculate about why breakpoint repeat elements are found only inD. pseudoobscura. Perhaps a new repetitive DNA element has been introduced in theobscuragroup lineage. Dro-sophila subobscurais a close relative ofD. pseudoobscura, and five of the six chromosomal elements are segregating for paracentric inversions in European populations (Krimbas 1992). It will be interesting to determine if the repeat motif is present at the breakpoints ofD. subobscurarearrangements.
The distribution of the breakpoint motif was not restricted to theD. pseudoobscurachromosomes with the major rearrange-ment polymorphisms. The genome-wide distribution of this re-petitive element suggests that all chromosomes are capable of rearrangements, but has no bearing on the fixation of such in-versions in the population. Rare inin-versions have been described on the other chromosomal arms both within D. pseudoobscura
(Dobzhansky 1944) and betweenD. pseudoobscuraandD. persi-milis(Tan 1935).
Fixed inversion differences between the species may play a significant role in the formation of new species because inver-sions prevent the spread of incompatibility genes between dif-ferent chromosomal backgrounds (Noor et al. 2001; Navarro and Barton 2003). By reducing rates of crossover, chromosomal in-versions act as a barrier to gene flow, allowing Dobzhansky-Muller incompatibility genes to be fixed in different gene ar-rangement backgrounds, greatly enhancing the possibility of speciation (Noor et al. 2001; Navarro and Barton 2003). In
Drosophila, hybrid male sterility genes appear to be involved in the process of speciation. In fact, we find that D. pseudoob-scuragenes with testis expression show a significant decrease in identity with theirD. melanogasterorthologs. It will be interest-ing to determine if genes within inverted regions, and par-ticularly those with male-specific expression, are associated with the sterility of male hybrids ofD. pseudoobscuraandD. per-similis.
Conservation of known
cis
-regulatory regions
D. pseudoobscurawas chosen as the second fly species to be se-quenced in part because it appeared to have the appropriate de-gree of sequence divergence fromD. melanogasterto locatecis -regulatory sequences (Bergman et al. 2002). We were somewhat surprised at the overall low level of conservation of knowncis -regulatory regions. Bergman et al. (2002) used clusters of these conserved noncoding sequences to identify enhancer sequences in theapterousgene. However, when known regulatory regions are examined, the conservation signal is not striking. Others have come to a similar conclusion using different alignment methods (Emberly et al. 2003). Alignment ofCaenorhabditis el-egansandCaenorhabditis briggsaehas also suggested that many conserved noncoding regions will not be due tocis-regulatory sequences, increasing the noise in the conservation signal of these elements (Stein et al. 2003). Alignments of additional spe-cies of intermediate divergence may improve the detection of known regulatory elements as in Kellis et al. (2003), assuming the elements are conserved.
The lack of a clear conservation ofcis-regulatory sequences suggests that simple models of sequence divergence in regulatory regions may be naive. Ludwig et al. (1998) observed that theD. pseudoobscura evestripe 2 enhancer was functional inD. melano-gasterdespite significant differences between the regulatory pro-tein-binding sites. In contrast, chimeric evestripe 2 promoters had improper expression patterns, suggesting that stabilizing se-lection was acting on the enhancer (Ludwig et al. 2000), where “…selection can maintain functional conservation of gene ex-pression for long periods of evolutionary time despite binding site turnover.” TheD. pseudoobscuratranscription factor proteins are 17% diverged from theirD. melanogasterorthologs (Supple-mental Fig. S5), different enough to allow variation of binding specificity. Evidence ofcis-regulatory binding site conservation is encouraging; however, it is clear theD. pseudoobscura–D. melano-gastersequence comparisons will not identify binding sites alone. Instead, approaches like phylogenetic shadowing (Boffelli et al. 2003) that make use of a multiple alignment with species of intermediate divergence show more promise, owing to the re-duced chance of binding site turnover between more recently diverged species. A recent paper (Berman et al. 2004) suggests the identification of binding-site clusters to reduce false positives when identifying regulatory regions.
Impact of the
D. pseudoobscura
sequence
on the
D. melanogaster
annotation
The sequence ofD. pseudoobscurawill have a substantial impact on gene predictions in other species, most notablyD. melanogas-ter. This will include direct conservation evidence for the validity of current predictions, modification of predictions based on con-served sequences with hallmarks of open reading frames such as third position variation, and support for ab initio predictions, which in previous annotation efforts were rejected as being too unreliable (Misra et al. 2002).
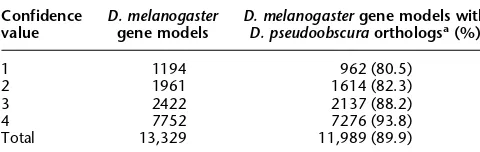
The first of these benefits from comparative analysis be-tween these two flies, is the additional supporting evidence for the currentD. melanogastergene model set. FlyBase uses a simple confidence scoring system in which one point is given for a gene prediction being supported by at least one instance of each of the following four sources of evidence: full-length cDNA sequence, EST sequence, similarities to known proteins, and ab initio pre-dictions. Thus, the most evidence-based gene models are
signed 4 points and the weakest accepted gene models have 1 (typically an ab initio prediction) (Misra et al. 2002). Of the 13,329 D. melanogaster Release_3.1 genes that were analyzed here and that remain in FlyBase, 11,989 have a putative ortholog inD. pseudoobscura(using a less stringent definition not requir-ing a gene model inD. pseudoobscurasequence). Table 3 describes the distribution of these putative orthologs by confidence value category. For the 1164 least supported gene models (confi-dence value of 1), 80.5% now have support based on orthology. For the confidence value 2 and 3 groups, the majority of gene models lack full-length cDNA evidence, and hence the con-servations between the D. melanogaster and pseudoobscura
genes are likely to permit significant improvement in the de-tails of the gene models. Even for the most fully supported gene models (confidence value of 4), the conservation between
D. melanogasterandpseudoobscurais likely to aid in the identi-fication of the actual translation start and of alternative coding exons.
Finally, it should be noted that identification of putative orthologs is 89.9% overall, and as expected goes up from 80.5% for the predictions with the least supporting evidence to 93.8% for those with the most. Hence, the majority of evenD. melano-gasterab initio predictions accepted as valid gene models by Fly-Base are likely to represent real expressed genes.
Methods
Strain selection
The availability of an isogenic or highly inbred strain is a critical factor to simplify the whole genome shotgun assembly problem. As the required balancer chromosomes are not available in
D. pseudoobscurato produce an isogenic strain, an inbred strain was used. The sequenced strain was derived from a Mesa Verde, Colorado isolate collected in 1996 (W. Anderson, unpubl.). A population cage was set up in 1997 from eight iso-female lines. After∼50 generations, inbred lines were established using a single
virgin male and female for each line. A single brother–sister in-breeding procedure was repeated for an additional 14 genera-tions, when a single line (MV-25) was selected on the basis of its viability. Cytological examination of the larval polytene chro-mosomes confirmed both the identity of the species and that the stock was homozygous for the Arrowhead inversion on the third chromosome. To avoid contamination with DNA from gut con-tents, and possible issues of unequal representation of the ge-nome in larval polytene chromosomes, embryos were used for the isolation of genomic DNA for sequencing library production. The sequencing strain is available from the Tucson Drosophila
Species Stock Center.
Library production
High-molecular-weight Genomic DNA was isolated from purified embryonic nuclei. pUC18 subclone libraries were constructed as described previously (Andersson et al. 1996). A BAC library (CHORI-226) and fosmid library (CHORI-1226) were prepared by and are available from BACPAC resources (Oakland, CA; http:// bacpac.chori.org/). These large insert libraries were constructed from the same inbred MV-25 strain that was used for the prepa-ration of the subclone libraries.
Sequencing and assembly
A total of 2.6 million high-quality sequence reads were produced from WGS sequencing libraries of ∼3 and 6 kb in pUC18
sub-clones, as well as additional reads from fosmids (40 kb) and BACs (130 kb) (Supplemental Table S1). DNA sequencing reactions were performed using BigDye version 3.1 (Applied Biosystems), and analyzed on ABI 3700 sequencing machines. These reads were assembled using the Atlas suite of assembly tools (Havlak et al. 2004). The Atlas suite identifies relatively small groups of reads that contain sequence overlap, assembles these groups in-dividually, and uses paired-end information to join the resulting contigs into large scaffolds. All 2.6 million sequence reads were compared to each other for overlap using Atlas-overlapper. Pu-tative overlaps were confirmed by banded dynamic program-ming alignment around the seed overlaps. Groups of sequence reads were then selected for local assembly by analysis of the sequence read overlaps using Atlas-binner, and individual assem-blies were performed on the BCM-HGSC computer cluster. Paired-end sequence information was used with the Atlas-scaffolder program to generate larger scaffolds. This approach generated scaffolds with an N50 of 0.995 Mb and contigs within those scaffolds with an N50 of 51 kb (Supplemental Table S2). The total length of the sequence contained in scaffolds of this main assembly is∼136 Mb. A complete description of the
assem-bly process will be described elsewhere.
Certain sequence reads were resistant to assembly using this approach. Some lacked sufficient sequence overlap to be placed into a contig. Other sequence reads overlapped too many other sequences, and were assembled in a high-stringency repeat assembly. “Reptigs” from this repeat assembly were integrated into the main assembly on the basis of paired end sequence in-formation. All of the sequence data are available on the BCM-HGSC Web site (http://hgsc.bcm.tmc.edu/projects/drosophila/). The annotated whole genome project has also been deposited into DDBJ/EMBL/GenBank under the project accession AADE00000000. The version described in this paper is the first version, AADE01000000.
Polymorphic sequence
Despite multiple generations of inbreeding the strain ofD. pseu-doobscura selected for sequencing still displayed a low level of sequence polymorphism. Because DNA was isolated from mul-tipleD. pseudoobscuraembryos, the assembly contained polymor-phic sequences that do not assemble because of the presence of high-quality discrepancies including insertions and deletions. The sequence identity of these polymorphic regions ranges from 92% to 98% in short regions preventing assembly. In all, 6.4 Mb of sequence overlapped but did not assemble because of the pres-ence of these discrepancies. It is possible to determine that a particular region contains strain polymorphisms, as opposed to repetitive regions in the genome, by using measures of sequence coverage and careful analysis of paired end sequence informa-tion. In cases in which similar sequences were identified in the assembly with high-quality discrepancies, further analysis
sug-Table 3. Number ofD. melanogastergene models having
D. pseudoobscuraorthologs Confidence
value
D. melanogaster
gene models
D. melanogastergene models with
D. pseudoobscuraorthologsa(%)
1 1194 962 (80.5)
2 1961 1614 (82.3)
3 2422 2137 (88.2)
4 7752 7276 (93.8)
Total 13,329 11,989 (89.9)
aUsing a relaxed definition of orthology, not requiring aD. pseudoobscura