Dynamic Business
Network Analysis for
Correlated Stock Price
Movement Prediction
Wenping Zhang, City University of Hong Kong
Chunping Li, Tsinghua University
Yunming Ye, Harbin Institute of Technology
Wenjie Li and Eric W.T. Ngai, Hong Kong Polytechnic University
A novel business
network-based model
can help predict
directional stock
price movements
by considering both
influential business
relationships and
Twitter sentiment.
of related firms situated in a business net-work based on the structural embeddedness theory1 and the extended five forces model.2 According to the latter,1 a firm’s rival, sup-plier, and complementary forces are among the most significant factors that influence its competitiveness and hence its ultimate busi-ness performance. In contrast, the structural embeddedness theory posits that a firm’s specific position in an interfirm network in-fluences its competitive behavior due to the firm’s unique access to external assets and in-formation through the network.1 These the-ories provide the theoretical underpinnings for designing a business network-based model to predict firms’ performance—that is, their stock performance.
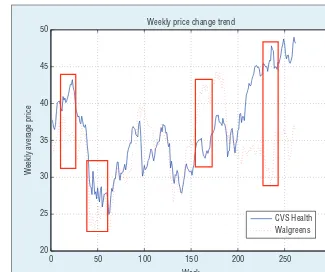
To illustrate the intuition of our business net-work-based approach for predicting directional
stock price movements, Figure 1 plots the stock price movements of two consumer staple ri-vals (CVS Health and Walgreens) from 2008 to 2012. After taking into account the move-ments caused by industry-wide factors, we can easily observe that when significant changes in CSV Health’s stock price occur, Walgreen’s stock price sometimes moves in the opposite direction.
In real-world settings, a firm’s performance can be influenced by multiple competitors, collaborators, and other hidden factors simul-taneously, which means a simple correlation analysis model might not be effective enough to predict stock price movements. This is what led to our design for the energy cascad-ing model (ECM). We also recognized the great difficulty of predicting arbitrary stock movements in realistic settings, which is why
A
lthough considerable research is devoted to analyzing individuals’
be-havior in social networks, few studies analyze firms’ performance with
respect to business networks. Our work aims to bridge this gap. In particular,
we focus on analyzing and predicting the directional stock price movements
we had the ECM focus on predicting the middle term (weeks or months) movements of related stocks. In other words, given the known movements of some stocks, our model only tries to predict the directional movement (up or down) of related stocks based on their business relationships as captured in a business network. By focusing on just one specific type of stock predic-tion task, our work differs drastically from previous studies and could lead to a more accurate prediction (see the “Related Work in Stock Performance Prediction” sidebar).
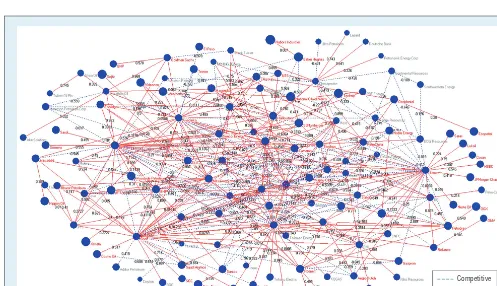
We also acknowledge another re-search challenge in that business net-works are dynamic: relationships among firms change periodically. For-tunately, successful research on au-tomated business network mining3 shows that it becomes technically feasible to automatically or semiau-tomatically construct large-scale busi-ness networks based on financial text corpora such as online financial news articles, investors’ comments, and ex-perts’ financial reports. In particular, “dynamic” business networks of dif-ferent periods can be built instantly by feeding the corresponding finan-cial text corpora into a business net-work discovery system. Accordingly, a large-scale network-based prediction of directional stock price movements of related firms is feasible under the emerging trend of big data analytics in online social media. Figure 2 is an ex-ample of a dynamically mined business network using the seeding companies classified according to the energy (EN) sector of the S&P 500 index.
A Network-Based Prediction Model
One possible way to analyze the im-pact of firms’ relationships on their stock price movements is to apply standard correlation analysis to each pair of firms. For example, the stock
volatility of firm X is predicted ac-cording to the Pearson correlation co-efficient between firms X and Y, and the known stock volatility of firm Y. The problem of such an approach is that only one direct business relation-ship between two firms is considered each time. Consequently, the predic-tion could be inaccurate due to a par-tial view of a firm’s relationships with other firms. Accordingly, we designed the ECM to capture the states of firms and the propagation of business in-fluence (directional stock movement) from a source firm to a targeted firm through other intervening firms in a business network. The propagation of such an “influence” from a source firm to the targeted firm is simulated by the flow of “energy” from a source node vito a sink node vjin the ECM.
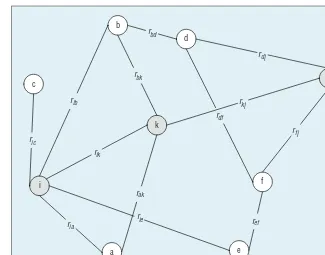
Figure 3 shows a simplified view of an ECM network. Each node of the ECM has one of three internal states: inactive, positively activated (for ex-ample, triggered by positive Twitter
sentiments about a firm), and nega-tively activated (for example, triggered by negative Twitter sentiments about a firm). A positively activated node tends to strengthen the positive business in-fluence that passes through it, whereas a negatively activated node tends to weaken the positive business influence passing through. This characteristic captures our intuition that a performing firm (as reflected by its positive senti-ments) tends to play the role of a strong partner or competitor for its associ-ates, whereas an underperforming firm (as reflected by its negative sentiments) tends to be a weak partner or competi-tor because the firm itself is in trouble. An inactive node simply transmits the external energy to other neighboring nodes.
The ECM’s Computational Details
Two types of energies are propagated in an ECM network: positive energy repre-sents an upward stock price movement
Figure 1. Stock price movements of CVS Health and Walgreens between Jan-2008 and Dec-2012. When significant changes in CSV Health’s stock price occur, Walgreen’s stock price sometimes moves in the opposite direction.
0 50 100 150 200 250 300
20 25 30 35 40 45
Week
Weekly average price
P R E D I C T I V E A N A L Y T I C S
I
n the past, researchers believed that stock price move-ments were random and unpredictable due to the effi-cient-market hypothesis, which stated that current stock prices already fully reflect available information about the value of the firm, hence analysis or prediction based on this information is meaningless.1 However, recent researchfind-ings suggest that stock price movements might not simply follow a random walk process, and stock volatility is predict-able to a certain extent.2 Moreover, some empirical studies
have revealed that a firm’s relationships with other firms can have a direct influence on its strategic competitiveness and hence its business performance.3 These empirical
find-ings shed light on how to design a computational model that can predict certain aspects of stock movements. For in-stance, the AZFintext system achieves an accuracy of around 57 percent in directional stock price movement prediction.4
Candidate computational models that capture the propa-gation of influences among firms in an interfirm network are the spreading activation model (SAM)5 and the
inde-pendent cascade model (ICM).6 However, once a node is
activated in either the SAM or the ICM, it can’t be re- activated. For directional stock price movement prediction, we were not only interested in inferring whether a node is activated but also in evaluating the degree of influence
on a node given the simultaneous influence from multiple direct and indirect nodes. Moreover, we needed to consider different types of influences as they propagated in a net-work. Unfortunately, these features aren’t supported by the classical SAM or ICM.
References
1. E.F. Fama, “The Behavior of Stock-Market Prices,” J. Business, vol. 38, no. 1, 1965, pp. 34–105.
2. A.W. Lo and A.C. MacKinlay, A Non-Random Walk Down Wall Street, Princeton Univ. Press, 2011.
3. R.Y.K. Lau et al., “Web 2.0 Environmental Scanning and Adaptive Decision Support for Business Merger and Acquisi-tion,” MIS Quarterly, vol. 36, no. 4, 2012, pp. 1239–1268. 4. R.P. Schumaker and H. Chen, “Textual Analysis of Stock Market
Prediction Using Breaking Financial News: The AZFinText System,” ACM Trans. Information Systems, vol. 27, no. 2, 2009, article no. 12
5. A.M. Collins and E.F. Loftus, “A Spreading-Activation Theory of Semantic Processing,” Psychological Rev., vol. 82, no.6, 1975, pp. 407–428.
6. K. Saito, R. Nakano, and M. Kimura, “Prediction of Informa-tion Diffusion Probabilities for Independent Cascade Model,”
Zagreb: In Knowledge-Based Intelligent Information and Engineering Systems, 2008, pp. 67–75.
Related Work in Stock Performance Prediction
Competitive
Collaborative
or positive sentiments about a firm, whereas negative energy signals a down-ward stock movement or negative senti-ments about a firm. Moreover, the type of link between two nodes (firms) can be either positive (cooperative business relationship) or negative (competitive business relationship). The type of en-ergy as represented by the correspond-ing sign is “flipped” accordcorrespond-ing to the type of link that it passes through. For a positive link (cooperative), the type (sign) of energy that it cascades remains the same. However, the type (sign) of en-ergy is reversed when it passes through a negative link (a competitive busi-ness relationship). This feature of the ECM aims to capture our intuition that a competitor’s gain is likely the focal firm’s loss. When energy cascades within the ECM, it’s assumed that this energy is propagated from a source node to a sink node through multiple propaga-tion paths. In addipropaga-tion, energy can’t pass through a node twice (that is, a loop) in each propagation path.
Definition 1 (business network). A business network is a weighted un-directed graph G= (V, E) that com-company comi is associated with another company comj through the business relationship with type type (ei,j ∈ R), where R = { “collabora-tion,” “competition”}. The weight of an edge denoted ri,j∈ [−1,0) ∪ (0,1] represents the strength of a specific type of business relationship and sat-isfies the conditions type (ei,j) = “col-laboration” => ri,,j∈ (0, 1] and type (ei,j) =“competition” => ri,,j∈ [−1,0).
Definition 2 (propagation path). Let Pi,j be the set of all possible propaga-tion paths from a source node vi to
a sink node vj; a propagation path pi,j ∈Pi,j is a directed acyclic path that comprises a sequence of a node pair such as (vi, vi+1), (vi+1, vk), …, (vk+1,
vj). The length of a propagation path denoted len(pi,j) is defined by len(pi,j) =|{pi,j}|.
Definition 3 (ECM). Given a busi-ness network and a set of source nodes, the total net energy cascad-ing to a sink node is determined by the energy propagated from all the source nodes through all the prop-agation paths. During energy cas-cading, the type of energy can be changed according to the nodes and the edges attached to a propagation path.
In the ECM, a trigger (such as a downward or upward stock price move-ment) is propagated from the source node vi to the sink node vj through the set of all possible propagation paths Pi,j. The net energy received by the sink node
vj through one of the propagation paths pi,j∈Pi,j is derived according to the fol-node vi induced according to the sen-timents of the corresponding firm. For the source node vi, the initial exter-nal energy enext∈ [−1,1] is defined by a downward or upward stock price movement. For subsequent nodes such as vk, the external energy enext is esti-mated based on the previous step (the energy cascaded via an incoming edge). According to previous studies in eco-nomics,4 smaller firms that have limited access to resources are much more eas-ily influenced by external forces. In con-trast, larger firms that can access more diverse sources of resources tend to be
i
P R E D I C T I V E A N A L Y T I C S
less influenced by external forces. Ac-cordingly, the adjustment factor tp(vi) is applied to strengthen or weaken the external energy when it’s absorbed by different types (large or small) of firms. The size of a firm denoted size(comi) is determined according to its mar-ket capitalization, and the average size of a business sector avgsize(sectori) is derived from the average market capitalization of a specific business sec-tor. More specifically, if size(comi) > avgsize(sectori) is established, tp(vi) < 1 is returned; otherwise, tp(vi) ≥ 1 is true.
The total energy Eng(vi, vj, enext) ∈ [−1,1] that’s cascaded from the source node vito the sink node vj through all the propagation paths Pi,j is defined by
Eng v v eni j ext tiating nodes (firms), the total net en-ergy TNEng(Vset, vj, ENext) ∈ [−1,1] is estimated according to the sentiment score derived from the corresponding firm comk. In particular, we analyze the sentiment of each firm extracted from Twitter via the publicly available API provided by Topsy (http://topsy.com).
Moreover, a publicly available sentiment lexicon named OpinionFinder (http:// mpqa.cs.pitt.edu/opinionfinder/) is ap-plied to identify the opinion expres-sion oe in each stock tweet and predict its sentiment polarities. According to opinion leadership theory,5 an expert or a leader’s opinions are more influential than the opinions contributed by an or-dinary member in a social circle. Because Topsy classifies the author of a tweet as “highly influential” (3), “influential” (2), and no label (1), we assign a weight wa(oe) ∈ {1,2,3} to each opinion expres-sion oe according to the specific type of author who contributes the tweet. For all the unclassified financials articles, wa(oe) equals 1. Let OEk+ and OEk− be the set of positive and the set of negative opinion expressions for the firm comk, respectively. The term strength(oe) ∈ {1,2} represents the strength of an opinion expression oe. In particular, an opinion expression is assigned the score of 1 if it contains a “weak” sentiment indicator defined according to Opin-ionFinder. If an opinion expression oe contains a “strong” sentiment indica-tor, its strength is strength(oe) = 2. The sentiment score (the internal energy) of the firm comk is derived according to the
kwa oe strenght
oe OE
kwa oe strenght oe
oe OE
In the ECM, because the external energy enext propagated through dif-ferent paths might be countervailed, the total net energy TNEng(Vset, vj, ENext) received by the sink node vj
is applied to predict the stock price movement of the corresponding firm comj. If TNEng(Vset, vj, ENext) >ξ+ is established, node vj is likely to be pos-itively activated, resulting in an up-ward stock price movement. On the other hand, if TNEng(Vset, vj, ENext) < ξ−, node v
j is negatively activated and results in an downward stock price movement. Otherwise, the energy cas-caded from different paths is counter-vailed, so a stock price movement is unlikely to be observed for node vj. The parameters ξ+ and ξ− are empiri-cally established through a training dataset. The computational complex-ity of predicting the directional stock price movement of an arbitrary node vj given an observed stock movement (external energy) of a node vi in the ECM is characterized by O(|V|2) in the worst case, where V is the set of nodes of the ECM network G.
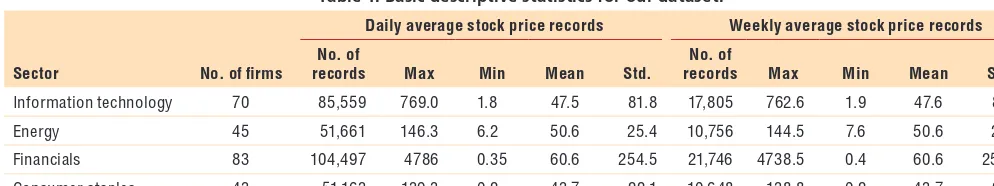
Experiments and Results To conduct empirical experiments for the proposed ECM, we retrieved his-torical stock data, financial news arti-cles, and Twitter postings for firms that were classified under four different busi-ness sectors according to the S&P 500 index. These business sectors include in-formation technology (IT), energy (EN), financials (FN), and consumer staples (CS). More specifically, five-year histori-cal stock data corresponding to the pe-riod from January 2008 to December 2012 were retrieved through the Yahoo Finance API (a total of 292,880 stock records). Table 1 provides our dataset’s basic statistics. The stock tweets about the chosen S&P 500 firms of the cor-responding period were also collected
Table 1. Basic descriptive statistics for our dataset.
Sector No. of firms
Daily average stock price records Weekly average stock price records
No. of
records Max Min Mean Std.
No. of
records Max Min Mean Std.
Information technology 70 85,559 769.0 1.8 47.5 81.8 17,805 762.6 1.9 47.6 81.9
Energy 45 51,661 146.3 6.2 50.6 25.4 10,756 144.5 7.6 50.6 25.4
Financials 83 104,497 4786 0.35 60.6 254.5 21,746 4738.5 0.4 60.6 254.2
using Topsy’s API. Financial news ar-ticles of the corresponding period were downloaded from Reuters Finance; we used these news articles as the basis for semiautomatically constructing the busi-ness networks for the four busibusi-ness sec-tors. For each evaluation year, a separate set of business networks was constructed using a latent text mining-based business network discovery method, and these se-quential sets of business networks were applied to capture evolving business re-lationships. In addition, JGraphT, a free Java graph library that provides math-ematical graph-theory objects and al-gorithms, was applied to analyze and compute the initial statistics pertaining to each business network. Another pub-licly available programming package called Pajek Java library helped visualize the mined business networks.
According to King’s5 study, mar-ket and industrial factors such as eco-nomic crisis and technology revolution can have an impact on stock volatil-ity as well. Therefore, we first identified the stock volatilities that were primarily caused by market factors and excluded them from our experiments. Based on the Dow Jones Industrial Average (DJIA) and the S&P 500 index, we selected the top five leading firms from each tar-geted business sector as the basis to es-timate the market-led stock volatility of the corresponding sector. These leading firms were usually the hubs (connected to many firms) in a sector-based busi-ness network. If all the chosen leading firms showed the same directional stock price movement in a particular week, we assumed that week’s stock movements to be influenced mainly by market-led factors and excluded them from our experiments.
To evaluate the ECM, we first used the historical stock data in the first six months of each evaluation year to identify the top J most influential
firms for each testing firm in a business sector. For the experiments reported
in this article, we set the selection parameter J= 5. For instance, a testing
firm was first taken as a source node in a business network, and then the top
J firms (the sink nodes) that received
the largest positive or negative energy in this period were taken as the most influential firms. For the remaining six months of each evaluation year, we ap-plied the directional stock movements of these top J most influential firms as
the source nodes to evaluate the energy
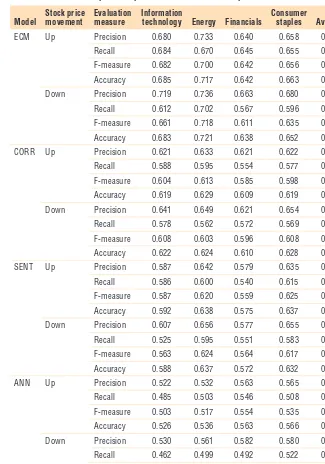
received by the testing firm, and hence to predict its directional stock price movements. Finally, we compared each testing firm’s directional stock price movements with the ground truth. We applied popular performance measures such as precision, recall, F-measure, and accuracy to assess the perfor-mance of the experimental and the baseline systems; Table 2 shows the prediction performance of each system across four different business sectors.
ECM Up Precision 0.680 0.733 0.640 0.658 0.678
Recall 0.684 0.670 0.645 0.655 0.664
F-measure 0.682 0.700 0.642 0.656 0.670
Accuracy 0.685 0.717 0.642 0.663 0.677
Down Precision 0.719 0.736 0.663 0.680 0.670
Recall 0.612 0.702 0.567 0.596 0.619
F-measure 0.661 0.718 0.611 0.635 0.656
Accuracy 0.683 0.721 0.638 0.652 0.674
CORR Up Precision 0.621 0.633 0.621 0.622 0.624
Recall 0.588 0.595 0.554 0.577 0.579
F-measure 0.604 0.613 0.585 0.598 0.600
Accuracy 0.619 0.629 0.609 0.619 0.619
Down Precision 0.641 0.649 0.621 0.654 0.641
Recall 0.578 0.562 0.572 0.569 0.570
F-measure 0.608 0.603 0.596 0.608 0.604
Accuracy 0.622 0.624 0.610 0.628 0.621
SENT Up Precision 0.587 0.642 0.579 0.635 0.611
Recall 0.586 0.600 0.540 0.615 0.585
F-measure 0.587 0.620 0.559 0.625 0.598
Accuracy 0.592 0.638 0.575 0.637 0.611
Down Precision 0.607 0.656 0.577 0.655 0.624
Recall 0.525 0.595 0.551 0.583 0.564
F-measure 0.563 0.624 0.564 0.617 0.592
Accuracy 0.588 0.637 0.572 0.632 0.607
ANN Up Precision 0.522 0.532 0.563 0.565 0.546
Recall 0.485 0.503 0.546 0.508 0.511
F-measure 0.503 0.517 0.554 0.535 0.527
Accuracy 0.526 0.536 0.563 0.566 0.548
Down Precision 0.530 0.561 0.582 0.580 0.563
Recall 0.462 0.499 0.492 0.522 0.494
F-measure 0.494 0.528 0.533 0.549 0.526
P R E D I C T I V E A N A L Y T I C S
For the correlation (CORR) base-line system, we applied the Pearson correlation coefficient to identify the top five closely related firms for each testing firm based on the weekly av-erage stock prices in each training pe-riod (that is, the first six months of each evaluation year). The stock movements of a testing firm and the movements of its closely related firms were then taken as examples to train a support vector machine (SVM) classifier. After-ward, the SVM classifier took the direc-tional stock price movements of these closely related firms as inputs to pre-dict the testing firm’s directional stock price movements in each test period (that is, the second half of each evalua-tion year). A library for support vector machine (LIBSVM) with a radial basis function (RBF) kernel, one of the most popular classification tools, was applied
to implement the CORR baseline sys-tem. Investors’ sentiments for firms have shown to be useful in predicting stock price movements in the finance literature.6 Accordingly, our second baseline system (sentiment [SENT]) utilized financial articles related to and Twitter sentiments about a firm to pre-dict its directional stock price move-ments. More specifically, we computed a firm’s sentiment score pertaining to each period according to Equation 4. For instance, if a firm’s weekly senti-ment score is greater (lower) than an empirically established positive (nega-tive) threshold, an upward (downward) stock price movement is predicted for the firm. Artificial neural network (ANN), one of the most widely used algorithms in time-series prediction (in other words, stock price prediction), was also selected as a baseline. For the
ANN baseline system, the focal firm’s historical stock movements in the last eight weeks (two months) were used as variables to predict movement in the target week. For each evaluation year, the first half year’s data were adopted as training data, whereas the second half year was taken as testing data.
Table 2 shows that the ECM sys-tem achieves an average accuracy of 67.7 and 67.4 percent for upward and downward stock price movement pre-diction, representing an improvement of 5.8 and 5.3 percent when compared to the result of the best baseline system, CORR. When compared to other state-of-the-art prediction models such as the AZFinText System, which achieves a directional accuracy of around 57 percent,7 our proposed ECM demon-strates a considerable improvement for predicting directional stock price movement, even though our system deals with a more restricted type of prediction task (predicting correlated stocks only). The SENT baseline sys-tem performs not as well as the prom-ising results reported in the literature.6 Surprisingly, the popular model— ANN—performed the worst among all the models. One possible reason is that ANN tends to apply normal regu-lation learning to historical data. How-ever, the stock price movements of our testing dataset don’t always follow the normal regulation. As a whole, our em-pirical experiments confirm the pro-posed ECM’s effectiveness.
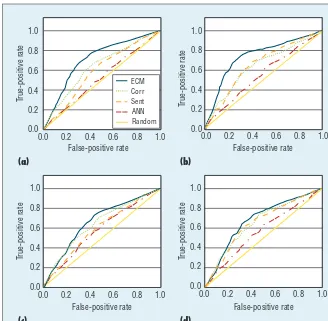
Because the evaluation metrics of precision, recall, F-measure, and ac-curacy rely on the adoption of a spe-cific classification threshold, different adopted threshold values could lead to different performance scores. To alle-viate this problem, we also applied re-ceiver operating characteristic (ROC) curves to evaluate the different mod-els’ performance. Figure 4 shows that the ECM achieves the best prediction performance among all the methods
1.0
across four different business sectors. In general, a ROC curve toward the top end of the chart indicates good prediction performance.
O
ur experimental results show that the proposed ECM can effectively predict middle-term di-rectional stock price movements, achieving an average accuracy of 67.7 percent (67.4 percent) for upward (downward) stock price movements. In fact, the ECM outperforms the best baseline model in upward stock price movement prediction by 11.7 percent in terms of F-measure. The implications of our research are that business managers and financial ana-lysts can apply the proposed model to more effectively analyze and predict the performance of targeted firms from automatically mined business networks. They can then proactively apply the appropriate strategies to streamline those firms’ operations.Acknowledgments
This research work was partly supported by the Shenzhen Municipal Science and Technology R&D Funding Basic Research Program (proj-ect number JCYJ20140419115614350). Ye’s research was supported in part by National Natural Science Foundation of China (NSFC) under grant number 61272538, Shenzhen Sci-ence and Technology Program under grant number JCYJ20140417172417128, and Shen-zhen Strategic Emerging Industries Program un-der grant number JCYJ20130329142551746.
References
1. D.R. Gnyawali and R. Madhavan, “Cooperative Networks and Competitive Dynamics: A Structural Embeddedness Perspective,” Academy of Management Rev., vol. 26, no. 3, 2001, pp. 431–446. 2. A.M. Brandenburger, and B.J. Nalebuff,
Co-Opetition, Doubleday, 1997. 3. R.Y.K. Lau et al., “Web 2.0
Environ-mental Scanning and Adaptive Deci-sion Support for Business Merger and
Acquisition,” MIS Quarterly, vol. 36, no. 4, 2012, pp. 1239–1268.
4. H.S. Nair, P. Manchanda, and T. Bhatia, “Asymmetric Social Interactions in Physi-cian Prescription Behavior: The Role of Opinion Leaders,” J. Marketing Research, vol. 47, no. 5, 2010, pp. 883–895. 5. B.F. King, “Market and Industry Factors
in Stock Price Behavior,” J. Business, vol. 39, no.1, 1966, pp. 139–190.
6. J. Bollen, H. Mao, and X. Zeng, “Twit-ter Mood Predicts the Stock Market,” J. Computational Science, vol. 2, 2011, pp. 1–8.
7. R.P. Schumaker and H. Chen, “Textual Analysis of Stock Market Prediction Using Breaking Financial News: The AZFinText System,” ACM Trans. Infor-mation Systems, vol. 27, no. 2, 2009, article no. 12.
University of Hong Kong. His research interests include text mining, sentiment analysis, and knowledge management. Contact him at [email protected].
Chunping Li is an associate professor in the School of Software at Tsinghua University. His research interests are artificial intelligence, data analysis and data mining, machine learning, and automated reasoning. Contact him at [email protected].
Yunming Ye is a professor in the Shenzhen Graduate School at the Harbin Institute of Technology. His research focuses on Internet search technology, data mining, and big data management. Contact him at [email protected].
Wenjie Li is an associate professor in the Department of Computing at Hong Kong Poly-technic University. Her research interests include online social networks and crowdsourc-ing, opinion mincrowdsourc-ing, and sentiment analysis. Contact her at [email protected].
Eric W.T. Ngai is a professor in the Department of Management & Marketing at Hong Kong Polytechnic University. His research topics include e-commerce, decision support systems, and social computing. Contact him at [email protected].
stay connected.
Keep up with the latest IEEE Computer Society publications and activities wherever you are.
| IEEE Computer Society
| Computing Now
| facebook.com/IEEEComputerSociety
| facebook.com/ComputingNow
| @ComputerSociety
| @ComputingNow