DAILY PORTFOLIO INVESTMENT RETURN ANALYSIS
WITH DOLLAR COST AVERAGING METHOD
Arie Himawan
Student of Graduate Program, Master of Management, D Building, VII Floor Jl. Kyai Tapa No. 1 Grogol, West Jakarta 11440
email: [email protected], Phone: (021) 5664166, Fax.: (021) 5668640
ABSTRACT
The background of this research was daily investment return strategy with dollar cost averaging method from portfolios which established from day and date of investment in a month. Therefore, it was found that there was highest return from one of those day when investors make investment plans in capital market. The objectives of this research were analyzing best performance day that investors could make most return in a month and along with dollar cost averaging method to avoid rather on risk of single market timing to regular investing. The design of this research applies exploratory research from day and date of investment portfolios which would add market information to investors as reference when make investments as part of their financial plan. Data analysis of this research used Jakarta Composite Index closing price from 2nd Quarter April 2003 to End of March 2008. The results of this research conclude that investors could make high potential investments portfolio return from one of day and date in a month with implementing dollar cost averaging regularly in capital market.
INTRODUCTION
Investment is part of the individual or a company policy in achieving the objectives of financial plan in the future. Some capital market financial instruments such as securities or securities outstanding on the shares, debentures and bonds, fixed income and some other variants such as mutual funds, unit linked, ETFs (exchange trade fund), warrants and rights can be collected by the investors as an
investment vehicle is adjusted to their needs in a particular period.
While on money market instruments investors can fulfill their needs for the short-term period of profits by saving their money in bank deposits - commercial banks located in the community. Along with the increasing development of capital markets in Indonesia, investors can take advantage of the
effect of these securities in a single stock or in the form of a portfolio in index funds, mutual funds and unit-linked financial instruments for the purpose of savings, pension funds and other long-term savings for.
In terms of discussion about return on investment, one of the topics in the field of finance capital markets attractive to be appointed is the number of previous studies ranging from Markowitz Mean
Variance Models with him in portfolio theory linking risk with return, to the Fama and French in the
factors - factors associated with effects on stock returns that include market risk premium, company
size and book to market ratio.
One of the challenges faced by the investors is when and how to implement strategies to optimize
the potential return that can be obtained on the effect of these securities in the capital market. Supported by financial instruments as a means of investment, investors can apply a variety of investment strategies that match their risk profile and investment objectives in the future. Dollar cost averaging (DCA) is one investment strategy to acquire long-term profitability and manage risk changes that may occur in the investment climate that is constantly fluctuating stock market.
Investment timing based on the portfolio formation date in month daily in Jakarta Stock
Exchange Composite Index in Indonesia in order to maximize the return using a strategy of Dollar
Cost Averaging is a method of discussion to be discussed in this study.
Referring to previous studies will determine the investment of time in months on a daily portfolio
to maximize return with an analysis of dollar cost averaging on the New York Stock Exchange in
1990 until 2005, following research study raise the timings of the daily portfolio in Indonesia through
Jakarta Stock Exchange Composite Index. Indonesia Stock Exchange has a character different markets
and different calendar year from the New York Stock Exchange, so that the research conducted
during the period 2003 to 2008.
To obtain a formulation, it can be noted in this study of how is the daily portfolio return with
Dollar Cost Averaging methods in the Jakarta Composite Index ?
The purpose of this study is to:
1. Provide a reference return for investors in an investment portfolio periodically based on daily
transactions in Indonesia Stock Exchange.
While the usefulness of this research, among others, to:
1. Investors and prospective investors to be able to understand market volatility and maximize
return for long-term investment plan.
2. Reference analysis of financial practitioners covering the Banking Industry, Insurance and Securities Capital Markets in serving customers and clients will be an investment strategy.
Limitations of this study are:
1. Daily trading closing price data JCI - Jakarta Composite Index (JCI) in the period April 2003 to
March 2008 on the Indonesia Stock Exchange covered by the day - a high holiday in July, August,
December and January on the domestic calendar and day - religious holiday in Indonesia.
2. Investment assumption illustrated in this study is using a currency U.S. dollar as one of hard
currency in order to align the previous studies.
3. Instruments measuring investment portfolio daily return only index referring to the future value
formula is implemented in research Paglia and Jiang (2006) earlier also, so it does not apply the formula returns a model approach of the researchers and other financial.
THEORETICAL FRAMEWORK AND HYPOTHESIS DEVELOPMENT
Investment, Financial Plan and Time Value of Money. Financial planning through investment will formulate a method that can achieve financial goals in the future (Ross et al., 2005) where would the establishment of time frames within a certain period to be implemented. So individual investors would have been able to understand the need for long-term financial plan, which according to Bodie et al. (2005), investment decision is based on the time horizon of interest. And if at this moment an investor saves some funds for the benefit of the future and not used for now, the concept of money value of time would be perceived by the investors with interest in future value growth - its in the
future (Ross et al., 2005).
According Tacchino and Woerheide (2005), one of the long-term goals in financial planning for retirement savings is an investment where there is accumulation strategy that includes: the investor
can optimize appropriate tolerance limits of aggressive risk in investing and dollar cost averaging
method of investing in stocks along current time period in which this concept of buy and hold
approach prioritizes the investment process.
As the investment activity runs, investors can implement a portfolio which, according to Golin (2001), the profits from investing in a portfolio can be liquidated during the asset investment time. Similarly, according to Rose and Hudgins (2005) with one of the factors why investors invest in capital market effect is to offset or avoid the risk of inflationary pressures that could arise eroding the value of money at present and the future in relation to the increase in price - the price of goods and
services in the community.
of Risk and Return. In a glance Capital Asset Pricing Model (CAPM), according to Schleef and
Eisinger (2007), is a standard risk fundamental measurement in volatility and standard of deviation
in single period model while in discussing portfolio problem in multi period format form.
Likewise with Chang at al. (2003), which indicates there are two ways by the investment manager
to obtain abnormal returns, among others, namely their ability to identify the effects of potentially provide greater benefits and the second is the determination of market timing, where fund managers are challenged to read the cycle market in trading securities.
As time goes by, then investing will always be closely associated with the risk / expected
return of an effect which, according to Ross et al. (2005), expected return of an effect is - average profits can be obtained in future periods, while risk according to Golin (2001) is the pressure to uncertain outcomes and possibility of losing. According Dhankar and Kumar (2006) regarding
risk and return relationships in the model reveals that the market index portfolio return is very responsive to factors - factors such as market interest rates, inflation, changes in foreign interest rates, GDP etc.
In portfolio theory by Bodie et al. (2005), it is mentioned that the investment made by investors
basically includes two major things: First, an analysis of the securities or the securities market in
which we assess the risk and expected return of the overall investment instruments that are available
and the second is the formation of an optimal portfolio of assets where this involves determining the
best chance of risk and return available from an investment portfolio that allows and the selection of
the best available portfolio.
Market Anomaly and Efficient Market Hypothesis. There are many market anomalies that occur in the stock exchanges that have been documented, among others, according to Paglia and
Jiang (2006) in his journal that covers the discovery of January Effect by Rozeff and Kinney, in
which the return - average index in January is higher than other months.
French research on return on Monday, Monday effect which indicates the low yields on the trading day as well, Monthly effect by Ariel supported also by Odgen’s findings where the return accumulation in the first week and second month is higher than the third and final week of the month thus the findings of Rosenberg, which proved that the return by the end of the month was lower than the return at the beginning of month.
According to Bodie et al. (2005) in terms of market anomalies in which connection it is the pattern of the yield or return that is visible against the efficient market hypothesis. While at Efficient Market Hypothesis (EMH), according to Ross et al. (2005) price of securities includes information
available on the market so that investors can obtain an equilibrium rate of return expectations in their
transactions.
Forms of efficient markets are divided into: weak form efficient market hypothesis (weak form of EMH), half-strong efficient market hypothesis (semi-strong form of EMH) and the strong efficient market hypothesis (strong form of EMH). Where each market form is closely related to the extent of
information absorption occurs in the market.
according to Chou (2008) in Statistical Analysis found that the moving average or rolling average is
a technique for analyzing time series data or whether it was a historical share price or other securities
also return and trading volume.
According to Alpari (2007), moving average is an indicator of a trend where - average closing price of securities in a given period. Moving average was divided into first, Simple Moving Average (SMA) is unweighted mean of the previous period data. Second, the Weighted Moving Average
(WMA) which is - average have additional factors that give different weights on each - each data
point. And third, Exponential Moving Average (EMA) which is a factor - the weighting factor that
decreases exponentially.
The use of categories above the moving average is based on the preferences and style of investing in the stock market. According Stockcharts (2008), moving average to indicate / confirm the trend of the effect, indicating the level of support (the lower limit of the price effect) and the resistance level
(upper limit of the price effect) and also serves as a systematic trading system.
In the strong form efficient market, it is stated that the prices already reflect all available information, both public information and non public personal information or by some parties, such
as management, board of directors and creditors. Market anomalies often occur in the Fama theory that elevates the concept of efficient market hypothesis, where according Gumanti and Utami (2002) as if it undermines the concept of the EMH that developed over the years.
Efficient market hypothesis can be revealed in fact if the fulfillment of conditions - conditions such as:
1. Many investors are rational and oriented to the maximization of profit and actively participate in the market by analyzing, assessing, and trade stocks. Where these investors are price takers,
meaning that actors themselves are not going to affect the price of a security.
2. There is no required fee to obtain information and information is available freely to market
participants at almost the same (not much different).
3. The obtained is in random, in the sense that the announcements on the market are free or not
affected by the other announcement.
4. Investors reacted swiftly and fully to new information coming on the market, causing stock
prices to be adjusted immediately.
Dollar Cost Averaging. There are various strategies that can be applied by investors in making investments, whether through ownership of stocks, indices and portfolio in index funds, mutual funds
and unit-linked life insurance companies. Some analysis by Bodie et. al. (2005), investors can apply
fundamental analysis to determine an effect or stock to the factors - factors such as earnings and
dividend prospects, expectations of future interest rates and risk evaluation of a company.
There are various strategies that can be applied by investors in making investments, whether
through ownership of stocks, indices and portfolio in index funds, mutual funds and unit-linked life
insurance companies. Some analysis by Bodie et al. (2005), investors can apply fundamental analysis
to determine an effect or stock to the factors - factors such as earnings and dividend prospects,
Dollar cost averaging exists as an easy thing to be done where investors make a number of
periodic investments regardless of any price effect, Edleson (2007). Meanwhile, according to Lerner
(2008), the dollar cost averaging (DCA) limits losses from market risk by investing some funds in
which certain monthly basis so that when stock prices rise we will get a little quantity of it and vice
versa when prices decline.
Morningstar (2005), states that DCA is a periodic systematic investment on a fixed number of funds in which when investment securities when prices go down, a lot of effects will be obtained and
vice versa.
Application of DCA is the philosophy of buy and hold strategy for long-term effects over time,
in the opinion Taccino and Woerheide (2005).
The mechanism that runs on dollar cost averaging strategy by Edleson (2007), is the diversification in investing time in which to take advantage of the time interval with a fixed number of funds with no heed whatever the market price of securities.
In determining the strategy of dollar cost averaging plan, according to Kennon (2007) investor
can initiate steps to:
1. Determine how much money can be invested and create a plan based on financial budgets that can support a number of these funds to remain consistent.
2. Select investment instruments that will be used which will be used for medium-term period -
long.
3. Determine investment intervals periodically whether on a monthly, three monthly until one year once the financial condition of investors fit.
According to Edleson (2007), the results of research with dollar cost averaging strategy conducted
in mutual funds that invest in securities - securities issuers iron / metal and the like in the United
States.
Strength of dollar cost averaging strategy can be combined with models of diversification in mutual funds and similar instruments, where several financial instruments in effect are formed into a stock portfolio to reduce the risk of volatility that can occur in one of the effects contained.
So in relation to investment analysis, dollar cost averaging is one method whereby strategies
take advantage of DCA for stock you consider to be sound long term investment it entails buying a constant dollar amount of stock at regular intervals, this time constitutes diversification (Shim 2004).
In a previous study by Paglia and Jiang (2006) revealed that the return of investment portfolio
periodically with DCA between a certain time can be found in the highest compared to other days in
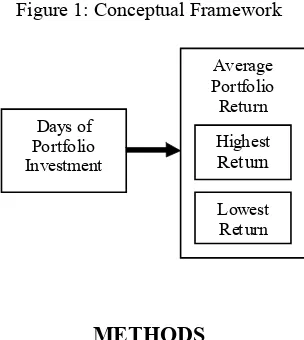
Figure 1: Conceptual Framework
METHODS
Operational Variable. This study is an extension of previous research by Paglia and Jiang in
Implementing a Dollar Cost Averaging Investment Strategy: Does the Date of the Month Matter? in
The Journal of Wealth Management (2006). Where the analysis of investment portfolios daily return
on the New York index period 1990 to 2005 with the strategy of dollar cost averaging investment is carried out regularly to give to drink or fluctuations in stock market volatility based on each - for each date in the month which is formed into its investment portfolio in the transaction. With the aim to find - average return which is the highest and lowest on the day - the day the transaction month. So that it may be mentioned that the research will lead to a single variable of portfolio return.
Chossing the Research Method. Design research is a form of research exploratory based on historical price data JCI where the analysis using the method of dollar cost averaging with the
assumption that investing at $ 1 on a regular basis to determine the return portfolio at each date
diary that will give reference insights to investors will be considered when investing in a day - day
contained in a single month.
Data. The data obtained are secondary data obtained from the publication of daily closing data Statictics Monthly Jakarta Composite Index (JCI) in Indonesia Stock Exchange during the period
April 2003 to March 2008 and data BAPEPAM home page directory. Daily closing price is taken
starting from the second quarter in 2003 with the assumption that the performance of the stock exchanges in the second quarter are expected to have a stronger tendency than the first quarter in the same year, where other factors such as company reports first quarter has been published to the public.
This study uses Future Value calculations are based on the formula in previous research journals
in which, every $ 1, - which is invested in each - each date on JCI closing index over time can show
the growth of his return.
Days of Portfolio Investment
Average Portfolio Return
Highest Return
Basic formula to be implemented for Future Value is:
Some calculations of return on investment that is as:
Index JCI closing on 25 April 2005 was 1,019.875, while the index closing on March 31, 2008 •
JCI is 2,447.299, so its FV:
= ($2,399-1)*100
= 139,96 %
In order to obtain return of 139.96% growth since the contributions of investors on April 25, 2005
through March 31, 2008.
Likewise also the portfolio on:
JCI closing index on September 4, 2006 was 1,469.559, while the JCI closing index on March •
31, 2008 was 2,447.299, so its FV:
= ($ 1,665 – 1)*100
= 66,53 %
So it can be seen that the growth of return of 4 September 2006 to March 31, 2008 amounted to
66.53%.
Sampling. By using historical daily closing data Jakarta Composite Index, the sampling method used, based on a systematic probability sampling in a period of five years back. Determination of daily investment portfolio is based on the date of the month and value of index closing prices starting
from April 2003 to March 2008 at the JCI.
Determination of portfolio on each - each day and the date is:
Portfolio [1] that consists of JCI closing index value on JCI closing on April 1
• st 2003, May 1st
2003, July 1st 2003 until February 1st 2008.
RESULTS AND DISCUSSION
Daily Return Portfolio Statistics. Here is a histogram graph showing the results of processing of future value to find the historical return on each - each portfolio in the Jakarta Composite Index, the period April 2003 - March 2008.
Present JCI Closing Index
Previous JCI Closing Index
($ 1)
•
= ($2,399-1)*100
2,447.299
Figure 2 : Daily Total Return Portfolio
JCI Apr 2003 - Mar 2008
-20,00 40,00 60,00 80,00 100,00 120,00
1 3 5 7 9 11 13 15 17 19 21 23 25 27 29 31
Day
Return JCI
In the graph above can be seen daily return on each transaction date which is formed in each
portfolio.
Portfolios formed based on the day and date of investment transactions made by investors by
investing on a regular basis on the same day and date regularly with dollar cost averaging.
Result Analysis and Interpretations
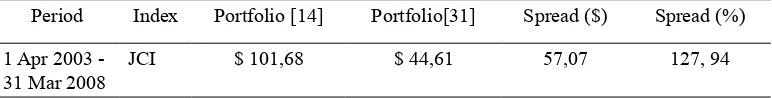
Table 1 : Return of Portfolio period 1 April 2003 - 31 March 2008
Period Index Portfolio [14] Portfolio[31] Spread ($) Spread (%)
1 Apr 2003 -31 Mar 2008
JCI $ 101,68 $ 44,61 57,07 127, 94
In Table 1 above, it can be seen that the portfolio [14] provides the highest return compared to
the day - Another day in the month while the portfolio [31] gave the lowest yield returns in the same
month. The difference obtained between the two amounted to $ 57.07 if growth is measured from
the total daily closing JCI future value or with a difference of 127.94%. Mechanisms and results of
calculations of data obtained through the steps:
First, assume that the $1 dollar investment is done as dollar cost averaging or periodically with a constant amount every day and date of the purchase transaction or subscription of JCI index
securities.
Second, future value, respectively - each portfolio [1], a portfolio [2], a portfolio [3], and so on until the Portfolio [31] where the $ 1 was calculated by dividing the number of JCI index closing at the
end of March 31, 2008 with the closing rate index JCI that would be obtained.
Calculation of future value and growth portfolios obtained by the daily as in:
JCI closing index on April 1, 2003 was 398.055, and JCI closing index on March 31, 2008 JCI is
•
2,447.299
398.055 ($ 1) = $ 6,148
= ($ 6,148 -1)*100
= 514, 81 %
So that the acquired future value since April 1st 2003 until March 31 2008 is $6,148 with the
growth of 514.81 %
JCI closing index on May 1st 2003 is 452.198 and JCI closing index on March 31st 2008 is
2,447.299, maka FV-nya:•
JCI closing index on March 31st 2008 is 2,447.299, then the FV- is:
= ($ 5,464 -1)*100
= 446,49 %
So that the acquired future value since May 2nd 2003 until March 31st 2008 is $5,464 with growth
of 446,49 %
growth of 387,09 %. So the acquired future value of growth from each day and date on all of the
above calculation starting from April 1st 2003 until March 3rd 2008 with total of 1.219 calculations
of return future value.
Third, the total growth of return that comes from the total of all future value on each portfolio until the highest and lowest average of all portfolio is acquired. The formation of investment portfolio
is as follow:
So it can be noted in the chart above where the histogram - average return on the Jakarta Composite
Index or JCI (Composite Stock Price Index) move in the mix, which comprises a combination of
increases at the beginning of the month or it can occur earlier in the week, with the return earned is
higher starting from $ 95 to $ 100 compared with - average return in the middle of the month in the
range $ 84 - $ 98 to the end of the month indicating the decline of return below $ 95. So it can be seen
from - average daily and date established in the portfolio, indicating that - average the highest returns
can occur in the middle of the month starting from the day or date to -13 down to -15 where the return
on the portfolio [14] to represent the results JCI is the highest in comparison with $ 101.68 - average
return on the portfolio of the lowest [31] for $ 44.61.
In the implementation of investment strategies with a simple method of dollar cost averaging,
where investors make transactions subscription or purchase of securities on the Jakarta Composite Index on a regular basis with the same amount of investment funds, the risk of price fluctuations in the securities market can be minimized.
We also draw attention in the period April 2003 to March 2008 Indonesian macro economic conditions influenced some major events such as:
Increase fuel - average 126% in October 2005 which triggered double-digit inflation up to 17.1% yoy (year on year).
Number of days - working days are transformed into holiday vacation together by government
policy.
In contrast to the results of previous research findings in the journal where - average return optimal to invest in the New York Stock Exchange can be obtained at day 23 or at the end of the
month in each month with a range of days from day -22 to day-to-25 who is the highest compared to
the day - Another day in the month.
In the actual implementation on the method of dollar cost averaging, investors can determine the
currency other than USD to fund long-term investment.
CONCLUSION
The test results of analysis conducted on the research problem by implementing a dollar cost
averaging in investment activity suggests that the optimal return portfolio with the formation of each
portfolio can be found that:
1. Portfolio [14] precisely at week -2 returns amounting to $ 101.68 which means that - average
growth obtained from investments in JCI for the day high compared to most days - another day.
2. Similarly, the portfolio [31] provide the lowest return for $ 44.61 which means that the growth of
investment return at the close of the month was the lowest compared to other days.
Thus, with observations on the daily portfolio return above can indicate:
1. The length of total stock trading days up to 43 days, as in portfolio [14] in the middle of the
month has the potential to provide the highest return.
fundamental news that encourages daily closing stock return is higher.
3. Growth index return is driven by the closing volume and value of transactions on issuers with big
capitalization that is higher than other days.
While the average lowest portfolio return can arise in the days of the end of the month, where it
can indicate:
1. The low total stock trading day as many as 21 days, as in portfolio [31] at the end of the month
has the potential to reduce portfolio returns.
2. Activity in part by investors for short-term gains (short-term profit-taking) of the portfolio invested during the current month.
3. Balancing the allocation of investment return (rebalancing) conducted by the investment manager
of the securities - securities that are held in their portfolios in preparation for entering the next
month.
By obtaining information from the above conclusions, the results of this study can be used by practitioners in the securities of financial services, banking and insurance services to clients and customers in terms of managing investment portfolios on a regular basis to achieve optimal return on
effect - the effect on capital market sustainable in the long term period with a simple and adequate
analysis can be communicated.
For future studies, researchers can apply:
1. Research in LQ 45 index consists of stocks - most liquid shares on the Indonesia Stock Exchange
During the period of the semester or the Jakarta Islamic Index (JII), with 30 stocks the which the
fundamental list of companies are traded in accordance with Islamic criteria.
2. Can use the return analysis with other studies such as analysis tools with value cost averaging
method which is a combination of dollar cost averaging model with market timing model on a
securities or a portfolio.
REFERENCES
Alpari. 2008. Trend Indicators: Moving Average, Alpari UK Limited
Bodie, Z., Kane, A., Marcus, A.J. 2005, Investments, McGraw-Hill
Chang, J.R., Hung, M.W., Lee, C.F. 2003. “An intertemporal CAPM approach to evaluate mutual
fund performance”, Review of Quantitative Finance and Accounting, June, 20,4, : 415
Chou, Y. Lun. 2008, Statistical Analysis, Holt International
Edleson, M.E. 2007. Value Averaging: the safe and easy strategy for higher investment returns, John
Wiley & Sons Inc, : 25
Golin, J. 2001. The Bank Credit Analysis Handbook: A Guide for Analysis, Bankers and Investors,
John Wiley & Sons Inc.
Gumanti, T.A dan Utami, E.S. 2002. ”Bentuk pasar efisien dan pengujiannya”, Jurnal Akuntansi dan Keuangan, Vol. 4, No.1, Mei, : 54 – 68
Lerner, J. 2008. Financial planning for the utterly confused , McGraw-Hill. : 44 – 45 Morningstar,. 2005, How to refine your stock strategy, John Wiley & Sons Inc.
Paglia, J.K. and Jiang. X. 2006. “Implementing a Dollar Cost Averaging Investment Strategy: Does
the date of the month matter?”, The Journal of Wealth Management, 9,2, : 54
Rose, P.S and Hudgins, S.C. 2005. Bank Management & Financial Services, McGraw-Hill.
Schleff, H.J. and Eisinger R.M. 2007. “Hitting or missing the retirement target: Comparing contribution
and asset allocation schemes of simulated portfolios”, Financial Services Review, 16, 3, :
229
Shim, J.K. 2004. Handbook of Financial Planning: An expert’s guide for advisors and their clients,
Thompson South Western, : 284 – 285
Stockcharts 2008. Moving Average, Stockcharts.com
Tacchino, K.B and Woerheide, W.J.2005. “Ten retirement investment strategies”, Journal of Financial