Computer aided diagnosis of ECG data on the least square support
vector machine
Kemal Polat
∗, Bayram Akdemir, Salih Güne¸s
Department of Electrical and Electronics Engineering, Selcuk University, 42075 Konya, Turkey
Available online 26 May 2007
Abstract
In this paper we describe a technique that has successfully classified arrhythmia from an ECG dataset using a least square support vector machine (LSSVM). LSSVM was applied to the ECG dataset to distinguish between healthy persons and diseased persons (arrhythmia). The LSSVM classifier trained with four train-test parts including a training-to-test split of 50–50%, a training-to-test split of 70–30%, and a training-to-test split of 80–20%. We have used the classification accuracy, sensitivity and specificity analysis, and ROC curves to test the performance of LSSVM classifier on the detection of ECG arrhythmia. The classification accuracies obtained are 100% for all the training-to-test splits. These results show that the proposed method is more promising than previously reported classification techniques. The results suggest that the proposed method can be used to enhance the performance of a new intelligent assistance diagnosis system.
2007 Elsevier Inc. All rights reserved.
Keywords:ECG dataset; Least square support vector machine; ROC curves
1. Introduction
The electrocardiogram (ECG) is a noninvasive test that is used to reflect underlying heart conditions by measur-ing the electrical activity of the heart. By positionmeasur-ing leads (electrical sensmeasur-ing devices) on the body in standardized locations, information about many heart conditions can be determined by looking for characteristic patterns on the ECG [1].
The traditional parameters that can be extracted by processing ECG signals include the following: (a) The under-lying rate and rhythm mechanism of the heart; (b) The orientation of the heart (how it is placed) in the chest cavity; (c) Evidence of increased thickness (hypertrophy) of the heart muscle; (d) Evidence of damage to the various parts of the heart muscle; (e) Evidence of acutely impaired blood flow to the heart muscle; and (f) Patterns of abnormal electrical activity that may predispose the patient to abnormal cardiac rhythm disturbances [1].
Having so many factors to analyze for determination of arrhythmia disease, a patient makes the physician’s job difficult. A physician usually makes decisions by evaluating the current test results from a patient and by referring to the previous decisions she/he made on other patients with similar ECG characteristics. The former method depends strongly on the physician’s knowledge while the latter depends on the physician’s experience in comparing the current
* Corresponding author. Fax: +90 332 241 0635.
E-mail address:[email protected] (K. Polat).
1051-2004/$ – see front matter 2007 Elsevier Inc. All rights reserved.
26 K. Polat et al. / Digital Signal Processing 18 (2008) 25–32
patient with earlier patients. This task is not easy considering the number of factors to be evaluated. In this crucial step, she/he may derive benefit from an accurate tool that lists previous decisions on patients with similar factors.
Since LSSVM is a robust and reliable classifier system and has the ability to perform fast classification, we have chosen to apply this classifier method to this task. The computation time of LSSVM classifier is lower than the other classifier algorithms such as artificial neural network, decision tree, and an artificial immune system. The LSSVM classifier has been applied to various physiological signals such as carotid arterial Doppler signals, PERG signals, EEG signals. Among these, Polat et al. applied the LSSVM classifier for diagnosing the atherosclerosis disease by processing carotid artery Doppler signals. They obtained 100% classification accuracy for atherosclerosis disease using LSSVM [2]. Polat et al. used the LSSVM classifier to classify the macular disease from PERG signals. They obtained 90.91% classification accuracy for macular disease using LSSVM [3]. Übeyli et al. applied to multi-class SVM for classifying the EEG signals. They achieved 99.28% classification success via multi-class SVM [4].
In this study, we present the results of an LSSVM diagnostic system that proved to be more effective for detecting the presence of arrhythmia disease from ECG data. Our primary research motivation was to advance the research of arrhythmia diseases. We have applied the least square support vector machine (LSSVM) to distinguish between healthy and diseased persons.
The performance of the system was analyzed with regard to the classification accuracy and we generated Receiver Operating Characteristic (ROC) curves to present our results. Our proposed system obtained 100% classification accuracy in test phase for detecting the presence of arrhythmia disease. This performance exceeds that of other studies applied to the ECG dataset classification problem so far.
The rest of the paper is organized as follows. We present the related work in the Section 2. We present the LSSVM method in Section 3. In Section 4, we give the experimental data to show the effectiveness of our method. Finally, we conclude this paper in Section 5 with future directions.
2. Related work
Classification systems have been used for diagnosis of arrhythmia disease as for other clinical diagnosis problems. There have been several studies reported focusing on diagnosis of arrhythmia disease. These studies applied different methods to the given problem and achieved high classification accuracies using the dataset taken from UCI machine learning repository. Among these studies, diagnosis of arrhythmia disease was conducted by Güvenir et al. In their study, they obtained 56.29% classification accuracy on the diagnosis of arrhythmia disease by CFI (classification on features intervals) classification algorithm and 5-fold cross validation [5]. Soman and Bobbie [6] obtained 59.47, 58.09, and 56.04% classification accuracies using OneR, J48, and Naive Bayes algorithms on the 50–50% training-test dataset for diagnosis of arrhythmia disease [6] while Polat et al. reached 76.2% classification accuracy using fuzzy weighted pre-processing and artificial immune recognition system (AIRS) and 10-fold cross validation [7].
3. The least square support vector machine classifier
In this section we firstly mention about SVM classifier followed by LSSVM related to SVM.
3.1. Support vector machines (SVMs)
SVM is a reliable classification technique, which is based on the statistical learning theory. This technique was firstly proposed for classification and regression tasks by [8].
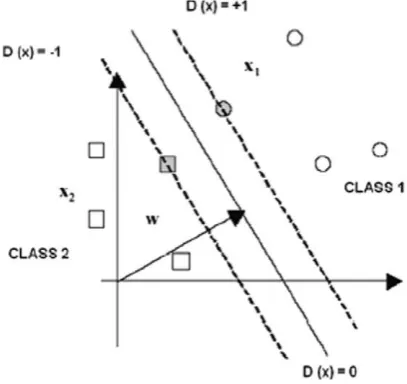
As shown in Fig. 1, a linear SVM was developed to classify the data set which contains two separable classes such as{+1,−1}. Let the training data consist ofndatum (x1, y1), . . . , (xn, yn), x∈Rn andy∈ {+1,−1}. To separate these classes, SVMs have to find the optimal (with maximum margin) separating hyperplane so that SVM has good generalization ability. All of the separating hyperplanes are formed with
D(x)=(w∗x)+w0 (1)
and provide following inequality for bothy= +1 andy= −1.
Fig. 1. The structure of a simple SVM.
The data points which provide above formula in case of equality are called the support vectors. The classification task in SVMs is implemented by using these support vectors.
Margins of hyperplanes obey following inequality: yk×D(xk)
w Γ , k=1, . . . , n. (3)
To maximize this margin(Γ ), norm ofwis minimized. To reduce the number of solutions for norm ofw, following equation is determined:
Γ × w =1. (4)
Then formula (5) is minimized subject to constraint (2), 1
2w
2. (5)
When we study on the non-separable data, slack variablesξi, are added into formula (2) and (5). Instead of formulas (2) and (5), new formulas (6) and (7) are used:
yi(w.xi)+w01−ξi, (6)
C n
i=1
ξi+ 1
2w
2. (7)
Since originally SVMs classify the data in linear case, in the nonlinear case SVMs do not achieve the classification tasks. To overcome this limitation on SVMs, kernel approaches are developed. Nonlinear input data set is converted into high dimensional linear feature space via kernels. In SVMs, following kernels are most commonly used.
• Dot product kernels:K(x, x′)=x.x′;
• Polynomial kernels:K(x, x′)=(x.x′+1)d, wheredis the degree of kernel and positive integer number; • RBF kernels:K(x, x′)=exp(−x−x′2/σ2), whereσ is a positive real number.
In our experimentsσ is selected 1000.
3.2. LSSVM (least squares support vector machines)
28 K. Polat et al. / Digital Signal Processing 18 (2008) 25–32
is minimized subject to formula (6) in Vapnik’s standard SVMs, in LSSVMs formula (9) is minimized subject to formula (8).
According to these formulas, their dual problems are built as following:
Q(w, b, α, ξ )=1
Another difference between SVMs and LSSVMs is that αi (Lagrange multipliers) are positive or negative in
LSSVMs but they must be positive in SVMs. Detailed information can be found in [9] and [10].
4. The experimental results
In this section, we first explain the ECG dataset we used in our experiments. We then present the performance evaluation methods used to evaluate the proposed method. Finally, we give the experimental results and discuss our observations from the obtained results.
4.1. ECG dataset
The dataset used in this study was obtained from the archives of machine learning datasets at the University of California, Irvine [11]. The datasets are grouped into two broad classes to facilitate their use in experimentally determining the presence or absence of arrhythmia, and for identifying the type of arrhythmia. In the set, Class 0 refers to ‘dead’ ECG. Classes 1 refers ‘a live’ ECG. The arrhythmia dataset has 13 attributes. Also, this dataset contains 88 dead people and 44 a live people belong to ECG dataset. Attributes of symptoms that are obtained from patient are listed as follows [11]:
1. Survival—the number of months patient survived (has survived, if patient is still alive). Because all the patients had their heart attacks at different times, it is possible that some patients have survived less than one year but they are still alive. Check the second variable to confirm this. Such patients cannot be used for the prediction task mentioned above.
2. Still-alive—a binary variable. 0 means dead at the end of survival period, 1 means still alive. 3. Age-at-heart-attack—age in years when heart attack occurred.
4. Pericardial-effusion—binary. Pericardial effusion is fluid around the heart. 0=no fluid, 1=fluid.
5. Fractional-shortening—a measure of contractility around the heart. Lower numbers are increasingly abnormal. 6. epss—E-point septal separation, another measure of contractility. Larger numbers are increasingly abnormal. 7. lvdd—left ventricular end-diastolic dimension. This is a measure of the size of the heart at end-diastole. Large
hearts tend to be sick hearts.
8. Wall-motion-score—a measure of how the segments of the left ventricle are moving.
9. Wall-motion-index—equals wall-motion-score divided by number of segments seen. Usually 12–13 segments are seen in an echocardiogram. Use this variable INSTEAD of the wall motion score.
10. Mult—a derivate var which can be ignored. 11. Name—the name of the patient.
12. Group—meaningless, ignore it.
4.2. Performance evaluation methods
We have used three methods for performance evaluation of determination of arrhythmia disease. These methods are classification accuracy, sensitivity and specifity analysis and ROC curves. We explain these methods in the following subsections.
4.2.1. Classification accuracy
In this study, the classification accuracies for the datasets are measured using the equation:
accuracy(T )= the classification oft by LSSVM.
4.2.2. Sensitivity, specificity, TP rate, FP rate, accuracy and F-measure
sensitivity= TP
where TP, TN, FP, and FN denotes true positives, true negatives, false positives, and false negatives, respectively.
4.2.3. Receiver operating characteristic (ROC) curves
A receiver operating characteristic (ROC) graph is a technique for visualizing, organizing and selecting classifiers based on their performance. ROC graphs are commonly used in medical decision making and in recent years they have been used increasingly in machine learning and data mining research. Although ROC graphs are apparently simple, there are some common misconceptions and pitfalls when using them in research [12].
ROC graphs are two-dimensional graphs in which tp (true positive) rate is plotted on the Y axis and FP (false
positive) rate is plotted on theXaxis. An ROC depicts relative tradeoffs between benefits (true positives) and costs (false positives) [12].
4.3. The results and discussion
To evaluate the effectiveness of our method, we made experiments on the ECG dataset mentioned above. We compare our results with previous results reported by earlier methods. Table 1 gives the classification accuracies of our method and previous methods.
30 K. Polat et al. / Digital Signal Processing 18 (2008) 25–32
Table 1
Classification accuracies for ECG dataset classification problem with classification accuracies obtained by other methods in literature
Author (year) Method Performance
measure
Classification accuracy (%)
Soman and Bobbie (2005) OneR 50–50% training-test dataset 59.67
Soman and Bobbie (2005) J48 50–50% training-test dataset 69.91
Soman and Bobbie (2005) Naïve Bayesian 50–50% training-test dataset 70.80
Soman and Bobbie (2005) OneR 70–30% training-test dataset 58.09
Soman and Bobbie (2005) J48 70–30% training-test dataset 74.26
Soman and Bobbie (2005) Naïve Bayesian 70–30% training-test dataset 75.00
Soman and Bobbie (2005) OneR 80–20% training-test dataset 56.04
Soman and Bobbie (2005) J48 80–20% training-test dataset 67.03
Soman and Bobbie (2005) Naïve Bayesian 80–20% training-test dataset 74.73
Güvenir et al. (2001) CFI 5-fold cross validation 56.29
Polat et al. (2005) Fuzzy weighted preprocessing-AIRS 10-fold cross validation 76.20
Our study (2006) LSSVM 50–50% training-test dataset 100
Our study (2006) LSSVM 70–30% training-test dataset 100
Our study (2006) LSSVM 80–20% training-test dataset 100
Table 2
The obtained classification accuracy, sensitivity, specificity, TP rate, FP rate, accuracy andF-measure values by LSSVM classifier for diagnosis of arrhythmia disease with 50–50% training-test split, 70–30% training-test split, and 80–20% training-test split
Statistical
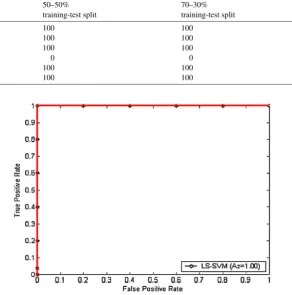
Fig. 2. ROC curve for LSSVM on 50–50% of training-test split.
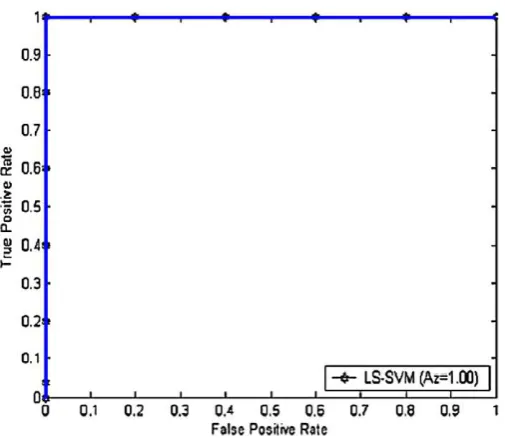
Fig. 3. ROC curve for LSSVM on 70–30% of training-test split.
Fig. 4. ROC curve for LSSVM on 80–20% of training-test split.
To compare the classification performances of LSSVM with a training-to-test split of 50–50%, a training-to-test split of 70–30%, and a training-to-test split of 80–20% ROC (Receiver Operator Characteristic) curves method is preferred. According to this method, ROC curves are computed for all datasets. While ROC curve of LSSVM with 50–50% training-test dataset was shown in Fig. 2, ROC curve of LSSVM with 70–30% training-test dataset was shown in Fig. 3. ROC curve of LSSVM with 80–20% training-test dataset was shown in Fig. 4.
Medical decision support system designed by LSSVM that we have built gave very promising results in classifying the healthy and patient subjects. We are proposing a complimentary system that can be coupled to software of the medical decision making devices. The benefit of the system is to assist the physician to make the final decision without hesitation.
5. Conclusion and future work
32 K. Polat et al. / Digital Signal Processing 18 (2008) 25–32
proposing a complementary system that can be coupled to software of the ECG devices. The end benefit would be to assist the physician to make the final decision without hesitation.
Classification systems that are used in medical decision-making provide medical data to be examined in shorter time and more detailed. In this study, for the diagnosis of arrhythmia disease, a medical decision making system based on LSSVM is proposed.
Our system is of the better clinical application over others, especially to diagnose of population in the shorter period. Since it is noninvasive, very easy to use and it has the potential of profiting not only by the experts in LSSVM research, but also especially biomedical engineers developing real-world medical applications. The stated results show that the proposed method could point out the ability of design of a new intelligent assistance diagnosis system.
Acknowledgment
This study is supported by the Scientific Research Projects of Selcuk University (Project No. 05401069).
References
[1] http://www.medicinenet.com/electrocardiogram_ecg_or_ekg/article.htm (last accessed: April 19, 2007).
[2] K. Polat, F. Latifo˘glu, S. Kara, S. Güne¸s, Pattern detection of atherosclerosis from carotid artery Doppler signals using fuzzy weighted pre-processing and least square support vector machine (LSSVM), Ann. Biomed. Eng. 35 (5) (2007) 724–732.
[3] K. Polat, S. Kara, A. Güven, S. Güne¸s, A hybrid automated detection system based on least square support vector machine classifier andk-N N
based weighted pre-processing for diagnosing of macular disease, in: Lecture Notes in Computer Science, vol. 4432, 2007, pp. 338–345. [4] I. Guler, E.D. Übeyli, Multiclass support vector machines for EEG-signals classification, IEEE Trans. Inf. Technol. Biomed. 11 (2) (2007)
117–126.
[5] H.A. Güvenir, B. Acar, Feature selection using a genetic algorithm for the detection of abnormal ECG recordings, in: Proceedings of the World Conference on Systemics, Cybernetics and Informatics (ISAS/SCI 2001), Orlando, FL, 2001, pp. 437–442.
[6] T. Soman, P.O. Bobbie, Classification of arrhythmia using machine learning techniques, in: Proc. of 4th International Conference on System Science and Engineering (ICOSSE), Copacabana, Rio de Janeiro, Brazil, 2005.
[7] K. Polat, S. ¸Sahan, S. Güne¸s, A new method to medical diagnosis: Artificial immune recognition system (AIRS) with fuzzy weighted pre-processing and application to ECG arrhythmia (2005), Expert Syst. Appl. 31 (2) (2006) 264–269.
[8] V. Vapnik, The Nature of Statistical Learning Theory, Springer, New York, 1995.
[9] J.A.K. Suykens, J. Vandewalle, Least squares support vector machine classifiers, Neural Process. Lett. 9 (3) (1999) 293–300.
[10] D. Tsujinishi, S. Abe, Fuzzy least squares support vector machines for multi-class problems, Neural Networks Field 16 (2003) 785–792. [11] ftp://ftp.ics.uci.edu/pub/machine-learning-databases (last accessed: April 19, 2007).