Lampiran 4.
Gambar daun segar dan serbuk simplisia daun srikaya
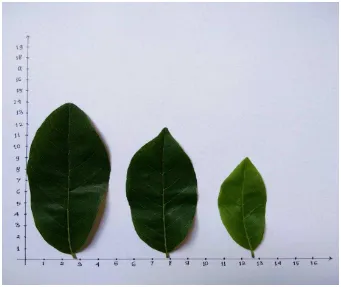
Gambar daun srikaya segar
1.
Pemeriksaan karakteristik dan skrining fitokimia serta pembuatan Ekstrak
Etanol Daun Srikaya (EEDS)
ditiriskan dan ditimbang berat
basahnya
Dikeringkan di lemari
pengering
Simplisia daun srikaya
Lampiran 5.
(Lanjutan)
2.
Pengujian aktivitas antidiare EEDS pada mencit jantan yang diinduksi oleh
minyak jarak
Konsistensi dan
berat feses
(mg)
Frekuensi diare
(kali)
Onset diare
(menit)
Diberi minyak jarak 0,5 ml tiap mencit secara oral
setelah 1 jam pemberian perlakuan
Diberi perlakuan setiap kelompok : suspensi
Na-CMC 0,5% dosis 1% BB; suspensi loperamid dosis
0,52 mg/kg BB; EEDS dosis 50, 100, 200, dan 400
mg/kg BB secara oral
Dibagi secara acak menjadi 6 kelompok
Ditimbang, dicatat berat badannya dan diberi
penandaan pada ekornya
30 ekor mencit jantan
Diamati mencit selama 5 jam selang waktu 30
menit
3.
Pengujian aktivitas antimotilitas EEDS dengan metode transit intestinal
Diberi tinta cina sebanyak 0,1 ml/10 g secara oral
setelah 1 jam pemberian minyak jarak
Diberi minyak jarak 0,5 ml tiap mencit secara oral
setelah 1 jam pemberian perlakuan
Dilakukan pembedahan dan ususnya dikeluarkan
Dibiarkan 1 jam, kemudian semua hewan
dikorbankan dengan cara dislokasi leher
Diberi perlakuan setiap kelompok : suspensi
Na-CMC 0,5% dosis 1% BB; suspensi loperamid
dosis 0,52 mg/kg BB; EEDS dosis 50, 100, 200,
dan 400 mg/kg BB secara oral
Dibagi secara acak menjadi 6 kelompok
Ditimbang, dicatat berat badannya dan diberi
penandaan pada ekornya
30 ekor mencit jantan
Diukur panjang usus yang dilalui marker tinta
cina
Lampiran 6.
Gambar pemeriksaan mikroskopik serbuk simplisia daun srikaya
perbesaran 10 X 40
Keterangan:
1.
Stomata tipe parasitik
2.
Trikoma multiseluler
3.
Berkas pengangkut tipe spiral
1
2
3
3
1
1.
Perhitungan penetapan kadar air
No.
Berat Sampel (g)
Volume awal (ml)
Volume akhir (ml)
1
5,0578
1,9
2,4
2
5,0412
1,9
2,4
3
5,0502
1,9
2,4
a.
Kadar air 1
=
x
100% = 9,88%
b.
Kadar air 2
=
x
100% = 9,91%
c.
Kadar air 3
=
x
100% = 9,90%
Rata-rata kadar air =
= 9,89%
Lampiran 7.
(Lanjutan)
2.
Perhitungan penetapan kadar sari larut air
Kadar sari larut air =
100%
No.
Berat sampel (g)
Berat sari (g)
1.
5,0067
0,3258
2.
5,0046
0,3043
3.
5,0041
0,2930
a.
Kadar sari larut air 1
=
100%
= 32,53%
b.
Kadar sari larut air 2
=
100%
= 30,40%
c.
Kadar sari larut air 3
=
100%
= 29,27%
Rata-rata kadar sari larut air
= 30,73%
3.
Perhitungan penetapan kadar sari larut etanol
Kadar sari larut etanol =
100%
No.
Berat sampel (g)
Berat sari (g)
1.
5,0023
0,1640
2.
5,0024
0,1741
3.
5,0024
0,1712
a.
Kadar sari larut etanol 1 =
100%
= 16,39%
b.
Kadar sari larut etanol 2 =
100%
= 17,40%
c.
Kadar sari larut etanol 3 =
100%
= 17,11%
Rata-rata kadar sari larut etanol =
Lampiran 7.
(Lanjutan)
4.
Perhitungan penetapan kadar abu total
Kadar abu total
=
100%
No.
Berat Sampel (g)
Berat abu (g)
1
2,0249
0,0682
2
2,0098
0,0653
3
2,0068
0,0707
a.
Kadar abu total 1 =
100%
= 3,36%
b.
Kadar abu total 2 =
100%
= 3,24%
c.
Kadar abu total 3 =
100%
= 3,52%
Rata- rata kadar abu total
=
5.
Perhitungan kadar abu tidak larut dalam asam
Kadar abu tidak larut dalam asam
=
100%
No.
Berat Sampel (g)
Berat abu (g)
1
2,0249
0,0095
2
2,0098
0,0070
3
2,0068
0,0187
a.
Kadar abu tidak larut asam 1
=
100%
= 0,46%
b.
Kadar abu tidak larut asam 2
=
100%
= 0,34%
c.
Kadar air tidak larut asam 3
=
100%
= 0,93%
Rata- rata kadar air tidak larut asam =
Lampiran 8
. Gambar alat dan bahan yang diperlukan
Spuit dan oral sonde
Peralatan bedah hewan
Lampiran 9
. Gambar pengamatan hewan
Posisi hewan sebelum dibedah
Lampiran 11.
Gambar usus halus yang dilintasi marker tinta cina
50 cm
55 cm
Lintasan marker pada kelompok kontrol negatif
13,5 cm
41 cm
Lintasan marker pada kelompok kontrol positif
42 cm
48 cm
Lintasan marker pada kelompok EEDS dosis 50 mg/kg BB
46 cm
30 cm
59 cm
30 cm
Lintasan marker pada kelompok EEDS dosis 200 mg/kg BB
46,5 cm
18,5 cm
Lampiran 12
. Contoh perhitungan dosis
Tabel konversi dosis antara jenis hewan dengan manusia (Darmono, 2011).
Tabel volume maksimal larutan sediaan uji yang diberikan pada hewan
Jenis hewan uji
Volume maksimal (ml)
i.v
i.m
i.p
s.c
p.o
Mencit
(20-30)
0,5
0,05
1,0
0,5-1,0
1,0
Tikus (100 g)
1,0
0,1
2,5
2,5
5,0
Hamster (50 g)
-
0,1
1-2
2,5
2,5
Marmut (250 g)
-
0,25
2-5
5,0
10,0
Merpati (300 g)
2,0
0,5
2,0
2,0
10,0
Kelinci (2,5 kg)
5-10
0,5
10-20
5-10
20,0
Kucing
(3 kg)
5-10
1,0
10-20
5-10
50,0
Anjing
(5 kg)
10-20
5,0
20-50
10,0
100,0
1.
Perhitungan dosis suspensi Na-CMC 0,5% dosis 1% BB
-
Na-CMC 0,5% =
= 5 mg/ml
-
Dosis 1% BB diberikan pada mencit 25 g
-
× 25 g = 0,25 ml
-
Volume yang diberikan pada mencit = 0,25 ml
2.
Perhitungan dosis suspensi loperamid HCl
-
Tiap tablet Lodia
®
mengandung loperamid HCl 2 mg
-
Dosis loperamid HCl untuk manusia adalah 2 tablet = 4 mg loperamid HCl
dan dosis maksimal 16 mg/hari.
-
Dosis untuk mencit 20 g adalah:
( 4 mg
–
16 mg) x 0,0026 = 0,0104 mg
–
0,0416 mg
Dosis yang digunakan adalah 0,0104 mg/20 g = 0,52 mg/kg BB
-
Menurut FI Edisi III, penetapan kadar tablet memerlukan 20 tablet, maka
diambil 20 tablet Lodia
®
kemudian
digerus dan ditimbang berat totalnya =
3160 mg
-
Berat bahan aktif loperamid HCl dalam 20 tablet Lodia
®
adalah 2 mg/tab x
20 tab = 40 mg.
-
Maka serbuk Lodia
®
yang digunakan adalah
x 3160 mg = 41,08 mg ≈ 41 mg
-
Cara pembuatan suspensi loperamid HCl
Ditimbang serbuk Lodia
®
sebanyak 41 mg digerus kemudian dilarutkan
Lampiran 12
. (Lanjutan)
-
Volume suspensi loperamid yang diberikan (misal berat badan = 25 g)
× 25 g ×
= 0,25 ml
3.
Perhitungan dosis suspensi EEDS
-
Suspensi EEDS dibuat dengan 4 variasi konsentrasi yaitu 0,5%, 1%, 2%,
dan 4%. EEDS ditimbang 50 mg, 100 mg, 200 mg dan 400 mg,
masing-masing digerus didalam lumpang, ditambahkan suspensi Na-CMC 0,5%
sedikit demi sedikit dan dicukupkan sampai 10 ml.
-
Volume suspensi EEDS 2% yang diberikan (misal berat badan = 23 g)
dengan dosis 200 mg/kg BB adalah
Perlakuan
Hewan ke-
Rata-Rata
(menit)
1
2
3
4
5
Suspensi Na-CMC 0,5%
80
88
94
75
83
84
Suspensi Loperamid 0,52
mg/kg BB
124
138
147
131
156
139,2
EEDS dosis 50 mg/kg BB
90
82
97
105
94
93,6
EEDS dosis 100 mg/kg BB
109
103
98
107
114
106,2
EEDS dosis 200 mg/kg BB
113
127
110
118
124
118,4
Lampiran 14
. Data frekuensi diare
Perlakuan
Mencit
ke-
Pengamatan ke-
Jumlah
Perlakuan
Hewan ke
Berat feses (gram)
EEDS dosis 50 mg/kg
BB
EEDS dosis 100
mg/kg BB
EEDS dosis 200
mg/kg BB
Lampiran 16.
Data durasi diare
Perlakuan
Hewan ke-
Rata-Rata
(menit)
1
2
3
4
5
Suspensi Na-CMC 0,5%
193
199
187
219
192
198
Suspensi Loperamid 0,52
mg/kg BB
78
83
100
82
94
87,4
EEDS dosis 50 mg/kg BB
164
169
181
155
179
169,6
EEDS dosis 100 mg/kg BB
144
145
152
155
151
149,4
EEDS dosis 200 mg/kg BB
128
141
127
126
135
131,4
Perlakuan
Hewan
Suspensi Na-CMC 0,5%
1
43
46
93,47
EEDS dosis 50 mg/kg
BB
EEDS dosis 100 mg/kg
BB
EEDS dosis 200 mg/kg
BB
Lampiran 18
. Analisis statistik onset diare
Tests of Normality
Kelompok
Kolmogorov-Smirnov
aShapiro-Wilk
Statistic
df
Sig.
Statistic
df
Sig.
EEDS dosis 50 mg/kg
BB
.145
5
.200
*.997
5
.997
EEDS dosis 100 mg/kg
BB
.153
5
.200
*.994
5
.993
EEDS dosis 200 mg/kg
BB
.183
5
.200
*.949
5
.729
EEDS dosis 400 mg/kg
BB
.139
5
.200
*.991
5
.983
a. Lilliefors Significance Correction
*. This is a lower bound of the true significance.
Descriptives
Waktu Awal Diare
N
Mean
Interval for Mean
Minimum Maximum
EEDS dosis 100
mg/kg BB
5
106.20
6.058
2.709
98.68 113.72
98
114
EEDS dosis 200
mg/kg BB
5
118.40
7.162
3.203
109.51 127.29
110
127
EEDS dosis 400
mg/kg BB
5
129.80
9.680
4.329
117.78 141.82
117
142
Total
30
111.87
21.287
3.887
103.92 119.82
75
156
ANOVA
Waktu Awal Diare
Sum of
Squares
df
Mean Square
F
Sig.
Between Groups
11268.667
5
2253.733
28.882
.000
Within Groups
1872.800
24
78.033
Multiple Comparisons
Waktu Awal Diare
Tukey HSD
(I) Kelompok
(J) Kelompok
Mean Difference
(I-J)
Std. Error
Sig.
95% Confidence Interval
Lower
Bound
Upper Bound
Suspensi
Na-CMC 0,5%
Suspensi Loperamid 0,52
mg/kg BB
Suspensi Na-CMC 0,5%
55.200
*5.587
.000
37.93
72.47
Suspensi Loperamid 0,52
mg/kg BB
Suspensi Loperamid 0,52
mg/kg BB
Suspensi Na-CMC 0,5%
34.400
*5.587
.000
17.13
51.67
Suspensi Loperamid 0,52
mg/kg BB
Suspensi Na-CMC 0,5%
45.800
*5.587
.000
28.53
63.07
Suspensi Loperamid 0,52
mg/kg BB
Suspensi Loperamid 0,52 mg/kg BB 5 139.20
Lampiran 19.
Analisis statistik frekuensi diare
Tests of Normality
Kelompok
Kolmogorov-Smirnov
aShapiro-Wilk
Statistic
df
Sig.
Statistic
df
Sig.
EEDS dosis 50 mg/kg
BB
.241
5
.200
*.821
5
.119
EEDS dosis 100 mg/kg
BB
.237
5
.200
*.961
5
.814
EEDS dosis 200 mg/kg
BB
.237
5
.200
*.961
5
.814
EEDS dosis 400 mg/kg
BB
.221
5
.200
*.902
5
.421
a. Lilliefors Significance Correction
*. This is a lower bound of the true significance.
Descriptives
EEDS dosis 50 mg/kg
BB
5
10.00
1.000
.447
8.76
11.24
9
11
EEDS dosis 100 mg/kg
BB
5
8.60
1.140
.510
7.18
10.02
7
10
EEDS dosis 200 mg/kg
BB
5
7.40
1.140
.510
5.98
8.82
6
9
Multiple Comparisons
Frekuensi Diare Tukey HSD
(I) Kelompok (J) Kelompok
Mean
Difference (I-J) Std. Error Sig.
95% Confidence Interval
Lower Bound Upper Bound
Suspensi Na-CMC 0,5% Suspensi Loperamid 0,52 mg/kg BB
Suspensi Loperamid 0,52 mg/kg BB
Suspensi Loperamid 0,52 mg/kg BB
Suspensi Loperamid 0,52 mg/kg BB
Suspensi Loperamid 0,52 mg/kg BB Suspensi Loperamid 0,52
mg/kg BB
2.200 .852 .141 -.44 4.84
EEDS dosis 50 mg/kg BB -3.200* .852 .011 -5.84 -.56
EEDS dosis 100 mg/kg BB -1.800 .852 .315 -4.44 .84
EEDS dosis 200 mg/kg BB -.600 .852 .980 -3.24 2.04
*. The mean difference is significant at the 0.05 level.
Frekuensi Diare
Tukey HSD
aKelompok
N
Subset for alpha = 0.05
1
2
3
4
Suspensi Loperamid 0,52 mg/kg BB
5
4.60
Lampiran 20.
Analisis statistik konsistensi dan berat feses padat
Tests of Normality
Kelompok
Kolmogorov-Smirnov
aShapiro-Wilk
Statistic
df
Sig.
Statistic
df
Sig.
EEDS dosis 50 mg/kg
BB
.200
5
.200
*.948
5
.723
EEDS dosis 100
mg/kg BB
.230
5
.200
*.955
5
.774
EEDS dosis 200
mg/kg BB
.202
5
.200
*.952
5
.752
EEDS dosis 400
mg/kg BB
.142
5
.200
*.996
5
.995
a. Lilliefors Significance Correction
*. This is a lower bound of the true significance.
Descriptives
Berat Feses Padat
N
Mean
Interval for Mean
Minimum Maximum
EEDS dosis 50 mg/kg
BB
5
.3760
.10237 .04578
.2489
.5031
.27
.53
EEDS dosis 100 mg/kg
BB
5
.2880
.12518 .05598
.1326
.4434
.12
.47
EEDS dosis 200 mg/kg
BB
5
.2620
.14394 .06437
.0833
.4407
.10
.45
EEDS dosis 400 mg/kg
BB
5
.2080
.07629 .03412
.1133
.3027
.11
.31
Total
30
.2847
.13653 .02493
.2337
.3356
.09
.55
ANOVA
Berat Feses Padat
Sum of
Squares
df
Mean Square
F
Sig.
Between Groups
.256
5
.051
4.319
.006
Within Groups
.285
24
.012
Multiple Comparisons
Berat Feses Padat Tukey HSD
(I) Kelompok (J) Kelompok
Mean
Difference (I-J) Std. Error Sig.
95% Confidence Interval
Lower Bound Upper Bound
Suspensi Na-CMC 0,5% Suspensi Loperamid 0,52 mg/kg BB Suspensi Loperamid 0,52
mg/kg BB
Suspensi Loperamid 0,52 mg/kg BB
Suspensi Loperamid 0,52 mg/kg BB
Suspensi Loperamid 0,52 mg/kg BB Suspensi Loperamid 0,52
mg/kg BB
.05600 .06886 .962 -.1569 .2689
EEDS dosis 50 mg/kg BB -.16800 .06886 .183 -.3809 .0449
EEDS dosis 100 mg/kg BB -.08000 .06886 .850 -.2929 .1329
EEDS dosis 200 mg/kg BB -.05400 .06886 .968 -.2669 .1589
*. The mean difference is significant at the 0.05 level.
Berat Feses Padat
Tukey HSD
aKelompok
N
Subset for alpha = 0.05
1
2
3
Suspensi Loperamid 0,52 mg/kg BB
5
.1520
EEDS dosis 400 mg/kg BB
5
.2080
.2080
Lampiran 21.
Analisis statistik konsistensi dan berat feses berair
Tests of Normality
Kelompok
Kolmogorov-Smirnov
aShapiro-Wilk
Statistic
df
Sig.
Statistic
df
Sig.
EEDS dosis 50 mg/kg
BB
.155
5
.200
*.976
5
.911
EEDS dosis 100
mg/kg BB
.231
5
.200
*.945
5
.699
EEDS dosis 200
mg/kg BB
.189
5
.200
*.952
5
.750
EEDS dosis 400
mg/kg BB
.234
5
.200
*.950
5
.735
a. Lilliefors Significance Correction
*. This is a lower bound of the true significance.
Descriptives
Berat Feses Berair
N
Mean
EEDS dosis 50 mg/kg
BB
5
.3620
.08408
.03760
.2576
.4664
.25
.46
EEDS dosis 100 mg/kg
BB
5
.2640
.08019
.03586
.1644
.3636
.14
.36
EEDS dosis 200 mg/kg
BB
5
.2260
.07956
.03558
.1272
.3248
.13
.32
EEDS dosis 400 mg/kg
BB
5
.2220
.10756
.04810
.0884
.3556
.10
.39
Total
30
.2843
.13132
.02398
.2353
.3334
.10
.62
ANOVA
Berat Feses Berair
Sum of Squares
df
Mean Square
F
Sig.
Between Groups
.280
5
.056
6.122
.001
Within Groups
.220
24
.009
Multiple Comparisons
Berat Feses Berair Tukey HSD
(I) Kelompok (J) Kelompok
Mean
Difference (I-J) Std. Error Sig.
95% Confidence Interval
Lower Bound Upper Bound
Suspensi Na-CMC 0,5% Suspensi Loperamid 0,52 mg/kg BB Suspensi Loperamid 0,52
mg/kg BB
Suspensi Loperamid 0,52 mg/kg BB Suspensi Loperamid 0,52
mg/kg BB
Suspensi Loperamid 0,52 mg/kg BB
Suspensi Loperamid 0,52 mg/kg BB
.04800 .06053 .966 -.1391 .2351
EEDS dosis 50 mg/kg BB -.14000 .06053 .228 -.3271 .0471
EEDS dosis 100 mg/kg BB -.04200 .06053 .981 -.2291 .1451
EEDS dosis 200 mg/kg BB -.00400 .06053 1.000 -.1911 .1831
*. The mean difference is significant at the 0.05 level.
Berat Feses Berair
Tukey HSD
aKelompok
N
Subset for alpha = 0.05
1
2
3
Suspensi Loperamid 0,52 mg/kg BB
5
.1740
EEDS dosis 400 mg/kg BB
5
.2220
.2220
Lampiran 22
. Analisis statistik konsistensi dan berat feses lembek
Tests of Normality
Kelompok
Kolmogorov-Smirnov
aShapiro-Wilk
Statistic
df
Sig.
Statistic
df
Sig.
EEDS dosis 50 mg/kg
BB
.282
5
.200
*.868
5
.259
EEDS dosis 100 mg/kg
BB
.251
5
.200
*.932
5
.611
EEDS dosis 200 mg/kg
BB
.237
5
.200
*.908
5
.455
EEDS dosis 400 mg/kg
BB
.239
5
.200
*.861
5
.230
a. Lilliefors Significance Correction
*. This is a lower bound of the true significance.
Descriptives
Berat Feses Lembek
N
Mean
Suspensi Loperamid 0,52
mg/kg BB
5
.5800
.12942
.05788 .4193 .7407
.46
.75
EEDS dosis 50 mg/kg BB
5 1.2620
.27068
.12105 .9259 1.5981
.90
1.51
EEDS dosis 100 mg/kg
BB
5
.9080
.27905
.12480 .5615 1.2545
.58
1.26
EEDS dosis 200 mg/kg
BB
5
.7840
.19970
.08931 .5360 1.0320
.53
.99
EEDS dosis 400 mg/kg
BB
5
.6640
.21813
.09755 .3932 .9348
.43
.89
Total
30
.9297
.36625
.06687 .7929 1.0664
.43
1.64
ANOVA
Berat Feses Lembek
Multiple Comparisons
Berat Feses Lembek Tukey HSD
(I) Kelompok (J) Kelompok
Mean
Difference (I-J) Std. Error Sig.
95% Confidence Interval
Lower Bound Upper Bound
Suspensi Na-CMC 0,5% Suspensi Loperamid 0,52 mg/kg BB Suspensi Loperamid 0,52
mg/kg BB
Suspensi Loperamid 0,52 mg/kg BB
Suspensi Loperamid 0,52 mg/kg BB
Suspensi Loperamid 0,52 mg/kg BB Suspensi Loperamid 0,52
mg/kg BB
.08400 .14441 .991 -.3625 .5305
EEDS dosis 50 mg/kg BB -.59800* .14441 .004 -1.0445 -.1515 EEDS dosis 100 mg/kg BB -.24400 .14441 .551 -.6905 .2025
EEDS dosis 200 mg/kg BB -.12000 .14441 .959 -.5665 .3265
*. The mean difference is significant at the 0.05 level.
Berat Feses Lembek
Tukey HSD
aKelompok
N
Subset for alpha = 0.05
1
2
3
Suspensi Loperamid 0,52 mg/kg BB
5
.5800
EEDS dosis 400 mg/kg BB
5
.6640
Lampiran 23.
Analisis statistik durasi diare
Tests of Normality
Kelompok
Kolmogorov-Smirnov
aShapiro-Wilk
Statistic
df
Sig.
Statistic
df
Sig.
Lama
Diare
Suspensi Na-CMC 0,5%
.268
5
.200
*.845
5
.178
Suspensi Loperamid 0,52
mg/kg BB
a. Lilliefors Significance Correction
*. This is a lower bound of the true significance.
Lampiran 23.
(Lanjutan)
Descriptives
Interval for Mean
Minimum Maximum
EEDS dosis 50 mg/kg
BB
5
169.60
10.761
4.812 156.24 182.96
155
181
EEDS dosis 100
mg/kg BB
5
149.40
4.722
2.112 143.54 155.26
144
155
EEDS dosis 200
mg/kg BB
5
131.40
6.427
2.874 123.42 139.38
126
141
EEDS dosis 400
mg/kg BB
Within Groups
2498.000
24
104.083
Tukey HSD
(I) Kelompok (J) Kelompok
Mean
Difference (I-J) Std. Error Sig.
95% Confidence Interval
Lower Bound Upper Bound
Suspensi Na-CMC 0,5% Suspensi Loperamid 0,52 mg/kg BB
Suspensi Loperamid 0,52 mg/kg BB Suspensi Loperamid 0,52
mg/kg BB
Suspensi Loperamid 0,52 mg/kg BB
Suspensi Loperamid 0,52 mg/kg BB
Suspensi Loperamid 0,52 mg/kg BB
23.200* 6.452 .016 3.25 43.15
EEDS dosis 50 mg/kg BB -59.000* 6.452 .000 -78.95 -39.05
EEDS dosis 100 mg/kg BB -38.800* 6.452 .000 -58.75 -18.85
EEDS dosis 200 mg/kg BB -20.800* 6.452 .038 -40.75 -.85
*. The mean difference is significant at the 0.05 level.
Lama Diare
Tukey HSD
aKelompok
N
Subset for alpha = 0.05
1
2
3
4
5
Suspensi Loperamid 0,52 mg/kg BB
5
87.40
EEDS dosis 400 mg/kg BB
5
110.60
Lampiran 24.
Analisis statistik persentase lintas marker
Tests of Normality
Kelompok
Kolmogorov-Smirnov
aShapiro-Wilk
Statistic
df
Sig.
Statistic
df
Sig.
EEDS dosis 50 mg/kg
BB
.301
5
.157
.862
5
.235
EEDS dosis 100 mg/kg
BB
.220
5
.200
*.960
5
.808
EEDS dosis 200 mg/kg
BB
.234
5
.200
*.933
5
.617
EEDS dosis 400 mg/kg
BB
.336
5
.068
.762
5
.038
a. Lilliefors Significance Correction
*. This is a lower bound of the true significance.
Descriptives
Interval for Mean
Minimum Maximum
EEDS dosis 50 mg/kg
BB
5 86.1840
5.70351 2.55069 79.1022 93.2658
76.61
91.48
EEDS dosis 100
mg/kg BB
5 66.4340
4.01254 1.79446 61.4518 71.4162
61.95
72.11
EEDS dosis 200
mg/kg BB
5 56.3720
9.31079 4.16391 44.8111 67.9329
45.83
68.18
Multiple Comparisons
Persen Lintasan Tukey HSD
(I) Kelompok (J) Kelompok
Mean
Difference (I-J) Std. Error Sig.
95% Confidence Interval
Lower Bound Upper Bound
Suspensi Na-CMC 0,5% Suspensi Loperamid 0,52 mg/kg BB
Suspensi Loperamid 0,52 mg/kg BB
Suspensi Na-CMC 0,5% -43.58600* 4.93493 .000 -58.8445 -28.3275
EEDS dosis 50 mg/kg BB -40.66000* 4.93493 .000 -55.9185 -25.4015
EEDS dosis 100 mg/kg BB -20.91000* 4.93493 .003 -36.1685 -5.6515 EEDS dosis 200 mg/kg BB -10.84800 4.93493 .275 -26.1065 4.4105
EEDS dosis 400 mg/kg BB -10.31800 4.93493 .325 -25.5765 4.9405
EEDS dosis 50 mg/kg BB Suspensi Na-CMC 0,5% -2.92600 4.93493 .991 -18.1845 12.3325
Suspensi Loperamid 0,52 mg/kg BB
40.66000* 4.93493 .000 25.4015 55.9185
EEDS dosis 100 mg/kg BB 19.75000* 4.93493 .006 4.4915 35.0085 EEDS dosis 200 mg/kg BB 29.81200* 4.93493 .000 14.5535 45.0705 EEDS dosis 400 mg/kg BB 30.34200* 4.93493 .000 15.0835 45.6005
EEDS dosis 100 mg/kg BB Suspensi Na-CMC 0,5% -22.67600* 4.93493 .001 -37.9345 -7.4175
Suspensi Loperamid 0,52 mg/kg BB
20.91000* 4.93493 .003 5.6515 36.1685
EEDS dosis 50 mg/kg BB -19.75000* 4.93493 .006 -35.0085 -4.4915
EEDS dosis 200 mg/kg BB 10.06200 4.93493 .351 -5.1965 25.3205
EEDS dosis 400 mg/kg BB 10.59200 4.93493 .298 -4.6665 25.8505
EEDS dosis 200 mg/kg BB Suspensi Na-CMC 0,5% -32.73800* 4.93493 .000 -47.9965 -17.4795 Suspensi Loperamid 0,52
mg/kg BB
10.84800 4.93493 .275 -4.4105 26.1065
EEDS dosis 50 mg/kg BB -29.81200* 4.93493 .000 -45.0705 -14.5535 EEDS dosis 100 mg/kg BB -10.06200 4.93493 .351 -25.3205 5.1965
EEDS dosis 400 mg/kg BB .53000 4.93493 1.000 -14.7285 15.7885
EEDS dosis 400 mg/kg BB Suspensi Na-CMC 0,5% -33.26800* 4.93493 .000 -48.5265 -18.0095
Suspensi Loperamid 0,52 mg/kg BB
10.31800 4.93493 .325 -4.9405 25.5765
EEDS dosis 50 mg/kg BB -30.34200* 4.93493 .000 -45.6005 -15.0835
EEDS dosis 100 mg/kg BB -10.59200 4.93493 .298 -25.8505 4.6665
EEDS dosis 200 mg/kg BB -.53000 4.93493 1.000 -15.7885 14.7285
*. The mean difference is significant at the 0.05 level.