INDONESIA’S ISLAMIC BANKING BANKRUPTCY PREDICTION FOR PERIOD 2014-2016
Anton Bawono [email protected]
IAIN Salatiga
Aisyah Setyaningrum [email protected]
IAIN Salatiga
Abstract
This research is motivated by market share of Syariah Bank (BUS) in Indonesia which is under 5% so that chance to go bankrupt. To minimize bankruptcy, the company’s performance is assessed through the financial ratios of Working Capital to Total Assets (WCTA), Earnings Before Interest and Tax to Total Assets (EBITTA), Retained Earnings to Total Assets (RETA) and Book Value of Equity to Book Value of Total Debt (BVEBVTD). The purpose of research to determine the effect of financial ratios on predicted bankruptcy bank and significance Altman Z-Score model. Data collection through indirect observation of quarterly report period 2014-2016 at 11 BUS. Analytical techniques such as stationary test, regression, classical assumption and Multiple Discriminant Analysis and factor analysis. The result of research is WCTA, EBITTA and BVEBVTD variables have positive and significant influence on bankruptcy prediction, while RETA variable has negative and significant effect. Of the four independent variables only WCTA and BVEBVTD variables can predict bankruptcy of BUS with 98.2% accuracy.
IQTISHADIA
Jurnal Kajian Ekonomi dan Binis Islam E-ISSN: 2502-3993 DOI: 10.21043/iqtishadia.v10i2.2863INTRODUCTION
The existence of sharia banking industry since 1992 in Indonesia becoming an economic expanding alternative solution
in financial transaction, but until now, it still has low market share. This condition can be seen from the level of financial ratios per September 30, 2015 in table 1 below:
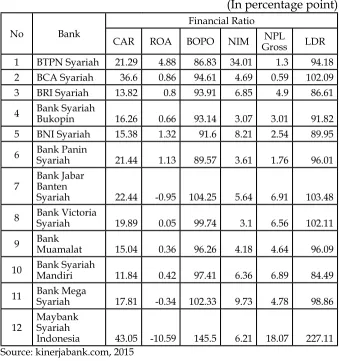
Table 1
Islamic Banking Ratio in September 2015
(In percentage point)
No Bank
Financial Ratio
CAR ROA BOPO NIM GrossNPL LDR
1 BTPN Syariah 21.29 4.88 86.83 34.01 1.3 94.18
2 BCA Syariah 36.6 0.86 94.61 4.69 0.59 102.09
3 BRI Syariah 13.82 0.8 93.91 6.85 4.9 86.61
4 Bank Syariah Bukopin 16.26 0.66 93.14 3.07 3.01 91.82
5 BNI Syariah 15.38 1.32 91.6 8.21 2.54 89.95
6 Bank Panin Syariah 21.44 1.13 89.57 3.61 1.76 96.01
7
Bank Jabar Banten
Syariah 22.44 -0.95 104.25 5.64 6.91 103.48
8 Bank Victoria Syariah 19.89 0.05 99.74 3.1 6.56 102.11
9 Bank Muamalat 15.04 0.36 96.26 4.18 4.64 96.09
10 Bank Syariah Mandiri 11.84 0.42 97.41 6.36 6.89 84.49
11 Bank Mega Syariah 17.81 -0.34 102.33 9.73 4.78 98.86
12
Maybank Syariah
Indonesia 43.05 -10.59 145.5 6.21 18.07 227.11
Source: kinerjabank.com, 2015
Based on the table above, it can be seen that, the level of
ROA of Bank BTPN Syariah and BNI Syariah show a healthy
less healthy level with ROA value of 0.80 and 0.86 and 7 other Sharia Banks have unhealthy predicate with ROA under 0.77
(Harmono , 2009). It can be concluded that the level of ROA of Sharia Banking as of 30 September 2015 shows less healthy condition since 58% of Sharia Commercial Banks in Indonesia
have ROA under 0.77 point.
This condition maybe influenced by the ASEAN Economic Community (MEA) since in 2015 year the ASEAN free market began to be applied. The MEA challenge for sharia banking
is the lack of product differentiation due to sharia banking business factors focused on the real sector and maintaining the maqasid of sharia. The development of sharia banking in 2016
is not much different from 2015, since there is no improved economic condition in terms of human resource capacity, office
network and other infrastructure and internal consolidation process. The above problems have an impact on the decrease of sharia banking asset share to the national banking assets by
4.67% compared to the year of 2015 at 4.9% (Booklet of Banking Indonesia, 2016).
Therefore we have to create a solution on how to
mitigate this situation. The first step of increasing the market
share of Islamic banks can be done through the assessment of the performance of banking management with a view to asses the success of management in managing a business entity. This
assessment is depended on the financial ratios that are subject to
the assessment of bank health in Bank Indonesia regulations. If
such judgment still leads to failure in banking management, then
there must be action from the competent authority. The failure of one bank is not only because of problems in individual banks alone but also because of a domino effect in other industries
(Kusdiana, 2014). Therefore we can use the bankruptcy analysis
Altman Z-score model. This model is used to determine the accuracy of bankruptcy prediction and as an assessment and
consideration of a company’s condition. In addition, the Altman
Z-score model can also identify factors or variables that may affect a company’s health or bankruptcy.
Based on the above description, predicting bankruptcy financial industry is very important thing to do. The emergence of
various predictions model of bankruptcy is the anticipation and early warning system against the possibility of the occurrence of
to identify and improve conditions to avoid crisis or bankruptcy
conditions (Kusdiana, 2014).
Research in bank bankruptcy prediction model by Endri
(2008) states that Altman Z-Score model is less appropriate if used to predict the possibility of bankruptcy in the sharia banking industry. This is because the Z-Score model is formed from an empirical study of the manufacturing industry which is certainly very different from the banking industry. In the
banking industry, for example, net working capital is not big. Then, large current liabilities will result from the increase of third party funds. This becomes more reasonable since a bank, as a financial intermediary and sharia public bank is not categorized yet as go public company, so the value of equity from year to
year tends to be low.
While, the study by Salimi (2015) states that the Altman
Z-Score model is still effective to predict corporate bankruptcy by providing information on the solvency of the company and
changes before going bankrupt through the financial ratio data.
The average predictive accuracy of 3 years before the bankruptcy
was 79.4%. The results of this study are similar to the accuracy performed by Hanson in Salimi (2015). The altman model is very good but can not predict 100% in bankruptcy predictions.
Based on the above description, there are gaps in research
results that occur primarily in the Islamic banking sector.
Because, in the previous research, only a few sharia banks were studied, while seeing the current reality of the number of sharia
banks is increasing every year and in 2016 the number of Islamic
banks in Indonesia has reached 13 banks (SPS OJK, 2017). Thus,
the authors are motivated to investigate more deeply about the
influence of financial ratios on the state of banking, especially
with the Altman Z-Score model.
LITERATURE REVIEW 1. Islamic Banking
Bank is a business entity that collects funds from the public in the form of savings and distributes it to the public in the form of credit and/or other forms in order to improve the standard of living of the people (Article 1 Paragraph 2 of the Islamic Banking
Act No. 21 of 2008). Meanwhile, the definition of Islamic Bank is
the Bank which conducts its business activities based on Sharia
Public Bank and Sharia Rural Bank (Article 1 Paragraph 1 of Islamic Banking Act No. 21 of 2008).
The function of Islamic banking in addition to performing
the function of channeling and accumulating public funds, also performs social functions, namely as a baitul maal institution
that receives zakat funds, infaq, sedakah, grants and others to be channeled to zakat management organizations, and as Islamic financial institutions receiving money waqf and channeling it to the designated (nazhir) manager (Article 4 of Islamic Banking Act No. 21 of 2008).
2. Agency Theory
The company’s goal is to maximize shareholder returns
and wealth. This goal is often not accomplished with agency problems. Agency problems arise between the management and the shareholders or between the creditor and the shareholder
(Yudiana, 2013). In a large corporation, agency problem is
very potential because the proportion of company ownership by managers is relatively small. Sometimes managers prefer to expand the company rather than prosper shareholders.
Another conflict is a conflict of interest between shareholders and creditors. The creditor has the right to partly the profits and
assets of the company especially in the case of bankruptcy.
3. Bank’s Bankruptcy
The definition of bankruptcy in Hadad et.al (2003)
submitted by the ISDA (International Swaps and Derivatives
Association) is the occurrence of one of the following events, i.e. companies issuing debt ceased to operate, the company is not
solvent or unable to pay the debts.
There are two kinds of costs that will occur in company’s
bankruptcy, namely direct cost and indirect cost. Direct cost is a cost occurred when the company pays lawyers, accountants and other professionals in order to restructure its finances which will
then be reported to the creditor. While indirect costs are potential losses faced by bankrupt companies; such as loss of customers
4. Altman Z-Score Model
Prediction of bankruptcy is needed to minimize the
risks that maybe occur in a company. The signs of bankruptcy
are better to recognize earlier, because the management can make improvements before it is too late, so, the creditors and
shareholders can anticipate the various bad possibilities that will happen.
Bankruptcy predictions have been modeled by many
economists, but Altman (1968) was the first to apply Multiple Discriminant Analysis (MDA). Altman method has the formula:
Z = 0.012 X1 + 0.014 X2 + 0.033 X3 + 0.006 X4 + 0.999 X5
Where : Z : Bankrupcy Index
X1 : Working Capital to Total Assets X2 : Retained Earnings to Total Assets
X3 : Earning Before Interest and Taxes to Total Assets X4 : Book Value of Equity to Book Value of Total Debt X5 : Sales to Total Asset.s
As time went by and adjusted to various types of companies, Altman then modified its model to be applicable to all companies, such as manufacturing, non manufacturing and emerging market issuers. In this Z-score modification Altman eliminates variable X5 (sales to total Assets) because this ratio is very varied in industries with different Assets sizes (Lukviaman and Ramadhani, 2009). The following Z-Score equations are modified Altman et al (1995):
Z = 6.56 X1 + 3.26 X2 + 6.72 X3 + 1.05 X4
Where: Z : Bankrupcy Index
X1 : Working Capital to Total Assets X2 : Retained Earning to Total Assets
X3 : Earning Before Interest and Taxes to Total Assets X4 : Book Value of Equity to Book Value of Total Debt.
Based on research by Kusdiana (2014), the classification
of a healthy and bankrupt company based on Z-score model by
Altman Modification is:
b. If the Z value is in range 1,1 < Z < 2.6 this will be categorized
as grey area (indefinable whether it is healthy or not).
c. If the Z value is greater than 2.6 this will be categorized as healthy company.
5. Financial Ratio
Financial ratios that can illustrate bankruptcy predictions of a banking or non-manufacturing company according to the
prediction model of bankruptcy Altman Z-score are as follows:
a. Working Capital to Total Assets
This ratio shows the company’s ability to generate net
working capital from its total assets (Endri, 2008). Working
capital or working capital according to Yudiana (2013) is
a fund that is used to finance the operations of everyday
company. Net working capital derived from current assets
minus current liabilities (current debt, bank debt, tax debt and customer advances) (Raharjaputra, 2009). While total assets is the amount of current assets and fixed assets owned
by the company.
If net working capital is negative, the company will
face a problem in covering its short-term liabilities because
current assets are not sufficient to cover the liability, so the probability of non-bankruptcy is less. In contrast, companies with net positive working capital rarely face difficulties in paying off their liabilities, resulting in greater bankruptcy probabilities (Endri, 2008).
The effect of WCTA on bankruptcy prediction based
on the research results of Nada (2013: 225) states that,
Z-Score is low value which one of them is caused by small value of WCTA variable. The value of WCTA which reached minus due to the current liabilities amount is greater than the amount of current assets.
Different results of research are presented by Irfan
still relatively small. The smaller this ratio means that the
condition of bank liquidity is getting worse. Generally when the bank is experiencing financial difficulties, working
capital will drop faster than total assets and cause this ratio to fall. Both studies are supported by Matturungan
et al (2016: 22-23) which states that WCTA variables have a positive and significant influence on the prediction of
corporate bankruptcy in Indonesia. b. Retained Earning to Total Assets
This ratio shows the company’s ability to generate retained earnings from the total assets of the company
(Endri, 2008). Retained Earning or retained earnings is net
balance after deducted by tax which by general meeting of shareholders decided not to be distributed but re-entered as
working capital for bank operations (Dendawijaya, 2009). While total assets is the amount of current assets and fixed
assets owned by the company.
The lower the ratio of RETA, the smaller is also the role of retained earnings to total assets of the company, so the probability of the company experiencing financial distress conditions higher. Meanwhile, if the ratio of RETA
is greater then show that retained earnings play a role in
forming company fund, so the probability of company experiencing financial distress condition smaller (Irfan and Yuniati, 2014).
According to Endri’s research (2008: 44-47), RETA variables have a positive influence on bankruptcy
predictions. The study was supported by the results of the
Nada (2013: 233) and Kusdiana (2014: 16) research which stated that the RETA variable has a positive influence and is one of the most influential variables on the prediction of
corporate bankruptcy.
While the results of different studies shown by Irfan
and Yuniati (2014: 16) which states that, the value of RETA probability of 0.882> 0.05. So it can be concluded that the partial RETA variable has no significant effect on financial distress on the five telecommunications companies. Matturungan et al (2016: 22-23) also stated that the RETA variable has a negative and insignificant influence on the
c. Earning Before Interest and Taxes to Total Assets
This ratio shows the company’s ability to generate profits from the company’s assets, before interest and tax payments (Endri, 2008). EBIT is derived from the income difference with
the operational and non-operating expenses of an enterprise in each period before being deducted by interest and tax. While
total assets is the amount of current assets and fixed assets
owned by the company.
The smaller the value of EBITTA ratio reflects that the
company’s ability to generate earnings before interest and tax
from the used assets is getting smaller, so the probability of occurrence of financial distress is higher. Conversely, the greater the value of the EBITTA ratio indicates that the firm optimizes its assets in generating operating profit before interest and tax, so the probability of occurring financial distress is being smaller (Irfan and Yuniati, 2014).
According to Endri’s research (2008: 44-47), the EBITTA variable has a positive effect on firm bankrupt prediction supported by Irfan and Yuniati research (2014: 16) stating that EBITTA variable has probability value of 0.033 <0.05. So it can be concluded that the partial variable EBITTA significant effect on financial distress on the five telecommunications companies.
Other studies that support is the result of research Kusdiana
(2014: 91) and Matturungan et al (2016: 22-23) stating that EBITTA variable has a positive and significant impact on the
prediction of corporate bankruptcy in Indonesia.
While the results of different research conducted by Nada
(2013: 230) stating that, EBITTA variable has a negative effect on the prediction bankruptcy Islamic banks but not too significant.
d. Book Value of Equity to Book Value of Total Debt
This ratio indicates a company’s ability to fulfill the obligations of its own book value of capital. Book value of equity
or often called paid-up capital is effectively paid up capital by the
owner (Muhammad, 2013). While the book value of total debt or
book value of debt obtained by summing current liabilities with
long-term liabilities (Endri, 2008).
If the BVE / BVD ratio is negative, this indicates that
the smaller the company’s ability to meet its short-term and
of financial distress for the company. Whereas, if the BVE / BVD ratio is positive, it states that the company can fulfill its obligation from equity so that the financial distress probability for the company is lower (Irfan and Yuniati, 2014).
According to Endri’s research (2008: 44-47) BVEBVTD
variable positively affects the prediction of corporate bankruptcy
based on z-score function Z = 0.717 X1 + 0.847 X2 + 3.107 X3 + 0.420 X4 + 0.998 X5. This research is supported by research of Tone (2013: 230) which states that BVEBVTD variable have
positive effect on bankruptcy prediction of syariah bank but
not too significant. Similar results were also presented by Irfan and Yuniati (2014: 16) and Kusdiana (2014: 88) stating that the BVEBVTD variable has no significant effect on the bankruptcy
prediction of the bank.
The different results of the four studies above are
Matturungan et al (2016: 22-23) which stated that, BVEBVTD variable has a negative and significant influence on prediction
of corporate bankruptcy in Indonesia with Z-score model that is
Z = -0.958 + 1.354 X1 - 0.118 X2 + 12.454 X3 - 0.114 X4.
RESEARCH METHOD
In this research we use descriptive-quantitative approach. According to Surakhmad (1990: 139-140), descriptive method is used for collecting, composing, analyzing and interpreting data, and comparing equations and differences of certain phenomena
then taking comparative study among elements studied. While
quantitative research is a quantitative measurement of data objectively and statistically through scientific calculations
derived from a sample of people or people who are asked to
answer a number of questions about the things surveyed and aims to test the hypothesis (Wijaya, 2013: 6).
The sample of this research is the Islamic Commercial Bank (BUS) in Indonesia that registered in Indonesia Financial
Data collection technique used in this research is indirect observation, which is by collecting document of quarterly banking financial report year 2014-2016. The quarterly financial
report was chosen because it has the highest accuracy in the prediction bankruptcy of banks in Indonesia than the semester
or annual financial statements. This is in line with Hadad’s (2004: 2) study which states that, the 3-month or quarterly prediction
model is worthy of being used as a model of bankruptcy prediction of commercial banks in Indonesia. At the modeling
stage, this model has 94.9% classification accuracy and 82.6%
level of validation accuracy.
The type of data used in this study is secondary data. Secondary data is a data obtained from sources that publish and are ready to use and able to provide information in decision
making although it can be processed further (Wijaya, 2013: 19).
Secondary data obtained through literature study that can be
through the articles that either from the journal, books or from
the internet associated with this research. Variables
The operational definition of the variables used in this study is as follows:
a. Independent Variable
1) Working Capital to Total Assets
2) Retained Earnings to Total Assets
3) Earning Before Interest and Tax to Total Assets
4) Book Value of Equity to Book Value of Total Debt
b. Dependent Variable
Z = a X1 + b X2 + c X3 + d X4
Z = 6.56 X1 + 3.26 X2 + 6.72 X3 + 1.05 X4 Where: Z : Bankruptcy Index
X1 : Working Capital to Total Assets X2 : Retained Earning to Total Asset
Analysis Technique
Analytical techniques used in this study are stationary test, regression test, classical assumption test, Multivariate
Discriminant Analysis (MDA) test and factor analysis. Stationary test is used to test time series data and used to detect whether
our data contain trend component or not (Ariyoso: 2009). The
regression test and MDA is used to test the research hypothesis. Factor analysis is used to clarify the correlation between research variables
RESULT
1. Stationary Test
The result of stationary test for each research variable can
be seen in table 3 below:
Table 3
Result of Stationary Test
No Variable Unit Root TestProbability
1 X1 – WCTA 0.0000
2 X2 – RETA 0.0041
3 X3 – EBITTA (first difference) 0.0000
4 X4 – BVEBVTD 0.0000
5 Y – Bankruptcy Prediction 0.0001
Source: Estimated secondary data, 2017
Based on the table above, it can be seen that the dependent
and independent variables in this study meet the provisions of
stationary test that has a probability value less than 0.05, except the variable X3 - EBITTA so that must be differentiated to be
stationary.
2. Regression test
Regression test results in this case are the equation that
has passed the classical assumption test. The newly formed regression is the result of differentiation of all research variables
and its regression form as follows:
d(Bankruptcy Prediction) = - 0.012949 + 6.495563 d(WCTA) – 0.085778 d(RETA) + 2.451448 d(EBITTA1) + 1.121619 d(BVEBVTD)
Explanation:
a. Constant value shows -0.012949, it states that if the
average of the bank bankruptcy prediction will decrease by 0.012949 units.
b. The regression coefficient d (WCTA) of 6.495563 states
that every increase of one unit of ratio d (WCTA) will
raise the level d (predicted bankruptcy) by 6.495563 units.
c. Regression coefficient d (RETA) of -0.085778 states that,
every increase of one unit of ratio d (RETA) will decrease the level d (prediction bankruptcy) by 0.085778 units.
d. Regression coefficient d (EBITTA1) of 2.451448 states that,
every increase of one unit ratio d (EBITTA1) will raise the level d (predicted bankruptcy) by 2.451448 units.
e. Regression coefficient d (BVEBVTD) of 1.121634 states
that, every increase of one unit of ratio d (BVEBVTD) will
raise the level d (predicted bankruptcy) by 1.121619 units.
The regression test above shows an adjusted value of R2 of 0.998, this means that variant of independent variables can explain the variant of dependent variable equal to 99.8% while
the rest is explained by variant of other variables. While the
value of significance on the statistical test F of 0.000 <0.05, which
means that the four independent variables synchronously and
significantly affect the predicted variable. Meanwhile, for the results of statistical tests t can be seen in table 4 below:
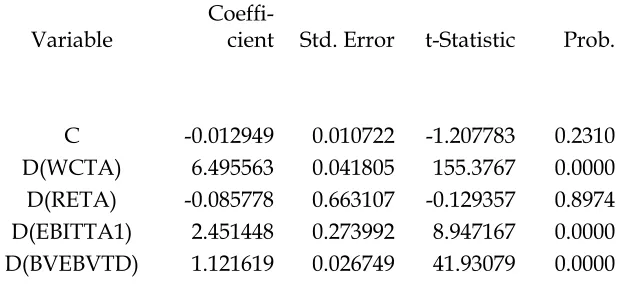
Table 4
Final Regression Test
Variable
Coeffi
-cient Std. Error t-Statistic Prob.
C -0.012949 0.010722 -1.207783 0.2310 D(WCTA) 6.495563 0.041805 155.3767 0.0000
D(RETA) -0.085778 0.663107 -0.129357 0.8974
D(EBITTA1) 2.451448 0.273992 8.947167 0.0000
D(BVEBVTD) 1.121619 0.026749 41.93079 0.0000
Based on the table above, it shows that three independent variables namely D(WCTA), D(EBBITA) and D(BVEBVTD) have significant effect on bankruptcy prediction variable since
the prob values shows below 0.05. While the D(RETA) variable
has an insignificant influence on the prediction of bankruptcy.
3. Decreminant Analysis
Discriminant analysis has the assumption that the data comes from the normal multivariate distribution and the covariance matrices of both groups are the same. The purposes
of discriminant analysis according to Ghozali (2013: 290) are:
a. Identify the variables that are able to differentiate between the two groups;
b. Use the identified variables to construct equations or functions to compute new variables that can explain the differences between the two groups;
c. Use variables that have been identified to develop rules or how to group observations in the future into one of two groups.
The first objection of this analysis is to know which
variables are able to differentiate between groups of banks. The
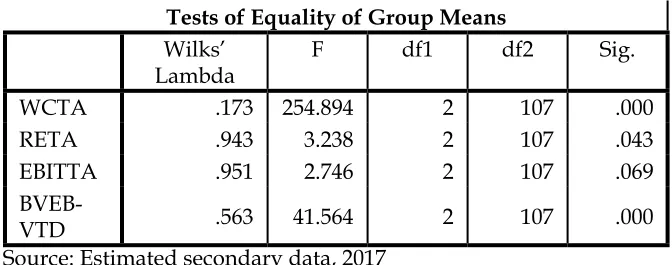
results can be seen in the wilks’ lamda test in table 5 below: Tabel 5
Tests of Equality of Group Means
Wilks’ Lambda
F df1 df2 Sig.
WCTA .173 254.894 2 107 .000
RETA .943 3.238 2 107 .043
EBITTA .951 2.746 2 107 .069
BVEB
-VTD .563 41.564 2 107 .000
Source: Estimated secondary data, 2017
Based on the above test results, from the four independent variables only two significant variables are WCTA and BVEBVTD variables, so only those two variables can be used to
form discriminant variables.
The second objection of discriminant analysis is the
(the sum of the dependent variable group is less than one). The
equation of discriminant function can be seen in table 6 below:
Table 6
Canonical Discriminant Function
Function 1 2 WCTA 7.863 -3.290
BVEB
-VTD .857 2.797
(Con-stant) -2.106 -.071
Unstandardized coefficients
Sumber: Estimated secondary data, 2017
Based on the table above, the discriminant function equation is as follow:
Z1 = - 2.106 + 7.863 WCTA + 0.857 BVEBVTD Z2 = - 0.071 – 3.290 WCTA + 2.797 BVEBVTD
then:
Z1 = w1 WCTA + w2 BVEBVTD Z2 = w3 WCTA + w4 BVEBVTD
Where, w1 is a normalized coefficient of WCTA, so the discrimination function becomes:
Z1 = 0.994 WCTA + 0.108 BVEBVTD Z2 = 0.762 WCTA + 0.647 BVEBVTD
In order to assess the importance of discriminant variables
and the meaning of discriminant, functions have to be assessed by looking at standardized discriminant functions. In this case the guidance is the coefficient value of each discriminant variable. Standardized coefficients are used to assess how important
discriminator variables are in shaping discriminant functions.
Table 7
Standardized Canonical Discriminant Function Coefficients
Function 1 2 WCTA .927 -.388
BVEBVTD .294 .961
Source: Estimated secondary data, 2017
Based on the table above, it shows that the first function is the magnitude of WCTA coefficient 0.927 and BVEBVTD
0.294 which means that WCTA variable is more important than
BVEBVTD variables in forming discriminant function. While in the second function BVEBVTD variable is more important than WCTA variable because the coefficient value is 0.961 which is
greater than -0.388.
The third goal of discriminant analysis is to show the
real classification of the prediction model of bankruptcy Altman Z-Score, the test results are listed in table 8 below:
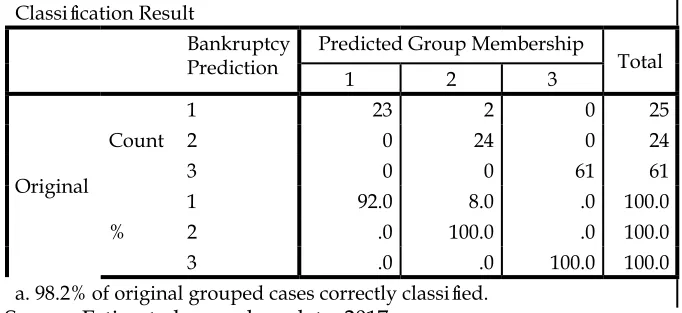
Table 8
Result Altman Z--Score Classification Result
Bankruptcy Prediction
Predicted Group Membership
Total
1 2 3
Original
Count
1 23 2 0 25
2 0 24 0 24
3 0 0 61 61
%
1 92.0 8.0 .0 100.0
2 .0 100.0 .0 100.0
3 .0 .0 100.0 100.0
a. 98.2% of original grouped cases correctly classified. Source: Estimated secondary data, 2017
Based on the table above, the discriminant function is able to classify bankruptcy bank case by 98.2% and predict non-bankruptcy condition (1) by 92% and also predict of gray area (2) and bankrupt prediction (3) exactly by 100%. This illustrates that only 1.8% of the predicted Altman Z-Score bankruptcy model is
not appropriate in predicting the bankruptcy of Islamic Banking
4. Factor Analysis
Factor analysis aims to define the structure of a matrix data and analyze the correlation between variables which then
determine how far each variable can be explained by each
dimension (Ghozali, 2013). Factor analysis requires that the data matrix should be significantly seen from the Bartlett test of spericihity test and above 0.05 in the KMO (Keizer-Meyer-Olkin) test. The result of factor analysis is as follows:
Table 9
Tabel Uji KMO dan Bartlett’s Test
Kaiser-Meyer-Olkin Measure of Sampling
Based on the above test results can be seen that the value
of KMO greater than 0.5, then factor analysis can proceed. More will be explained in table 10 below:
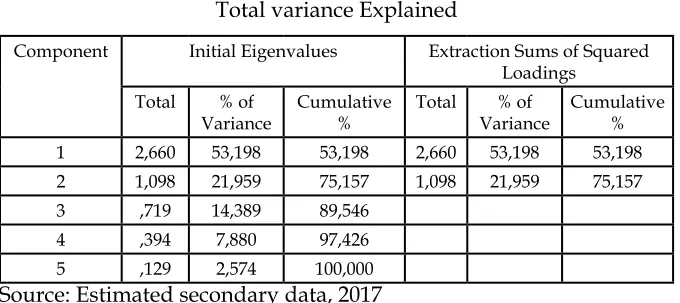
Table 10
Total variance Explained
Component Initial Eigenvalues Extraction Sums of Squared Loadings
1 2,660 53,198 53,198 2,660 53,198 53,198
2 1,098 21,959 75,157 1,098 21,959 75,157
3 ,719 14,389 89,546
4 ,394 7,880 97,426
5 ,129 2,574 100,000
Source: Estimated secondary data, 2017
Based on the above test results, from the five variables in the analysis, it turns out there are only 2 computer extraction into 2 factors (based on the value of eigen value> 1). The first factor is able to explain 53.198% variation while the second factor can explain 21,595% variation, so both factors can explain 74.793% variation.
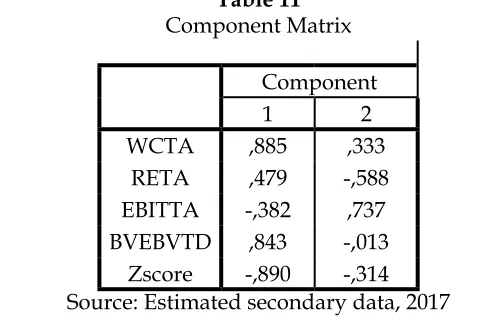
BVEBVTD variables have an important effect on the prediction of bankruptcy of sharia banks, it is shown in the following table:
Table 11
Component Matrix Component 1 2 WCTA ,885 ,333
RETA ,479 -,588
EBITTA -,382 ,737 BVEBVTD ,843 -,013
Zscore -,890 -,314
Source: Estimated secondary data, 2017
Based on the results of the matrix table above, it is seen that the factor 1 of WCTA and BVEBVTD variables are most influential and has a loading factor value greater than other variables. While on factor 2, RETA and EBITTA variables are influential, but its loading factor value is smaller than WCTA and BVEBVTD variables.
DISCUSSIONS
1) The effect of WCTA on predicted bankruptcy
Based on the regression test, the WCTA variable has a positive and significant effect on bank bankruptcy prediction with coefficient value of 6.495563 and significance 0.0000. So it can be concluded that this study accepts H1 which states that the WCTA variable has a positive and significant impact on
bank bankruptcy predictions.
The WCTA has a positive effect on the bank bankruptcy prediction; it means the higher working capital the WCTA ratio will be higher. So that will affect the improvement of business development in this case is the intermediary function of sharia
banking. If the intermediation function is running well, then the
possibility of banks not going bankrupt is also getting higher.
This result is supported by Irfan and Yuniati (2014:
16) study which states that the WCTA variable is partially
significant and has a positive value on financial distress. Other
studies supporting the results of this study are Kusdiana (2014)
has a positive and significant impact on bankruptcy predictions
for both banking industry and non-bank public companies.
2) The impact of RETA variable on predicted bankruptcy
Based on regression result, RETA (Retained Earnings to Total Assets) variable has negative and insignificant effect on bank bankruptcy prediction with coefficient value equal to -0.085778 and insignificance of 0.8974. So it can be concluded that this study rejects H2 which states that the RETA variable has a positive and significant impact on bank bankruptcy predictions. RETA variable negatively affects the bank prediction of bankruptcy; it means the lower the RETA, the higher the
possibility of companies not going bankrupt. This negative
value indicates the company’s inability to generate profits and
manage assets. It can also occur because of the ineffectiveness
of the applied management. If this is allowed to continue, it can
make the company go bankrupt even if it has little debt (Byoun in
Matturungan, 2016: 21). In running the company, management aspects are important things that must be made structured, so
that its implementation can support the vision and mission of the company and avoid the state of bankruptcy.
The result of this research is supported by Irfan and
Yuniati (2014: 16) research which stated that RETA variable has no significant effect to financial distress, and also supported by Matturungan research (2016) which produce negative influence between RETA and bankruptcy prediction of bank.
3) The impact of EBITTA variable on predicted bankruptcy
Based on the result of regression result, EBITTA variable has positive and significant effect to bank bankruptcy prediction with coefficient value of 2.451448 and significance 0.0000. So it can be concluded that this study accept H3 which states that EBITTA variable has a positive and significant impact on bank
bankruptcy prediction.
That is, the higher the EBITTA ratio the higher the potential for bankruptcy. EBITTA is also called ROA. The greater the ROA of a bank, the greater the level of profit achieved by the
bank and the greater the bank’s position in terms of asset use
(Dendawijaya, 2009: 118). In the ratio of ROA several aspects that play a role are asset, management, earnings and market
and can affect the soundness of the bank so the possibility for the bankrupt company becomes smaller.
This result is supported by Endri (2008), Irfan and Yuniati (2014), Kusdiana (2014) and Matturungan (2016) studies which stated that EBITTA variables have a significant and positive
effect on predicted bankruptcy. Bankruptcy prediction with
EBITTA variable can be applied to go public banking industry
and Non-bank Company.
4) The impact of BVEBVTD variable on bank’s predicted bankruptcy
Based on the regression result, BVEBVTD variable has positive and significant effect to bank bankrupt prediction with coefficient value of 1.121619 and significance 0.0000. So it can be concluded that this study accept H4 which states that the variable BVEBVTD have a positive and significant impact on
bank bankruptcy predictions.
That is, the higher the BVEBVTD ratio the higher the
bank does not go bankrupt. This happens because the ratio of
BVEBVTD affects the level of capital deposited in the bank. The
higher paid up capital in banks; it is expected improving the intermediary function and streamline asset turnover. So it will
increase the operating profit and cause the bank to stay in a
healthy state or bankruptcy will not occur.
However, the BVEBVTD coefficient value is smaller than
the two other variables. This happens because the book value
of equity or paid-up capital in BUS from quarter I to the next quarter only changes in small amount. Moreover, in annual base,
the level of paid-in capital in banks tends to remain unchanged.
The results of this study are supported by Endri (2008) and Tone (2013) research which state that the BVEBVTD variable has a positive but not very significant effect on bankruptcy
prediction.
5) The important roles of WCTA, RETA, EBITTA and BVEBVTD on predicting bankruptcy
that the results of this study rejected H5 which states that the variables WCTA, RETA, EBITTA and BVEBVTD have a positive
and simultaneous effect on bank bankruptcy predictions.
While the MDA test results stated that the WCTA and
BVEBVTD variables have the highest loading values of the other two variables that are equal to 0.956 and 0.386, so it can
be concluded that discriminant score can interpret as a measure
of health or prediction of corporate financial bankruptcy. Or in other words, WCTA and BVEBVTD variables have high
accuracy to predict bankruptcy of banks.
This research is different from previous research because in previous studies researchers only use one variable whether
WCTA or BVEBVTD. There is no research that states that these
two variables can form a shared discriminant function. This
happens because of differences in research objects and periods of financial statements of the company. In the previous research,
researchers mostly conduct their study on manufacturing companies. As for BUS there are only a few researchers such
as Tone (2013) and Endri (2008), but the sample used does not include all BUS in Indonesia. So, as far as my knowledge, this study is the brand new research that takes all BUS as object and
gives outstanding results.
6) Altman Z-score model on predicting bankruptcy
Based on MDA test, the discriminant function is able to
classify bankrupt criteria. First the function is able to predict
98,2% for bank not to go bankrupt. Second, the function is able to predict 92% for bank being in grey area. Third, the function is also able to predict 100% in predicting bank’s bankruptcy. So it can be concluded that this study accept H6 which states that Altman Z-score method can predict more than 79.4% in bank’s
bankruptcy prediction.
The Altman Z-Score model is suitable or significant
in predicting bankruptcy which means that this prediction already describes the true position of BUS in Indonesia. The
results of this study are supported by Salimi (2015) which states that the Altman model has an accuracy of 79.4% in predicting
bankruptcy bank. The results of this study are similar to the
Conclusion and Suggestion
As we have discussed above, this study was conducted based on market share of Islamic banks in which shows only 5%
of National Banks in Indonesia. This indicates ineffective Sharia banks performance. Therefore it will lead to the bankruptcy.
Assessing bankruptcy required deep assessment of company performance through its financial ratios; there are Working Capital to Total Assets (WCTA), Earnings before Interest and Tax to Total Assets (EBITTA), Retained Earnings to Total Assets (RETA) and Book Value of Equity to Book Value of Total Debt (BVEBVTD). The purpose of this study was intended to explain about influence of those financial ratios on bankruptcy prediction
of banks based on Altman Z-Score Model.
The result suggests that WCTA, EBITTA and BVEBVTD variable show positive and significance effect on bankruptcy prediction, while the RETA variable shows negative and insignificance. Based on this study, there are only two variables, WCTA and BVEBVTD, which could precisely predict bankruptcy with 98.2% accuracy.
Based on the results of the factor analysis, it is seen that the factor 1 of WCTA and BVEBVTD variables are most influential and has a loading factor value greater than other variables. While on factor 2, RETA and EBITTA variables are influential, but its loading factor value is smaller than WCTA and BVEBVTD variables.
We recommend in order to make better results, the future
researches have to increase the number of variables and conduct research on Islamic Business Unit (UUS) and Islamic Rural Bank (BPRS) and Islamic Financial Services Cooperative (KJKS) since
the prediction model of bankruptcy is needed to minimize the
failure of corporate management and to improve the effectiveness of the implementation of Good Corporate Governance. On the
other hand, this study uses only one model, Altman Z-Score model. It should be coupled with other financial ratios with
other bankrupt prediction models such as the Springate model
REFFERENCE
Altman, Edward. I. 1968. Financial Ratio, Discriminant Analysis and the Prediction of Corporate Bankcruptcy. The Journal of
Finance, 23(4): 509-609.
Ariyoso. 2009. Uji Akar Unit (ADF test), Uji Stasistik, Ekonometrika & Multivariat, (online), (http://ariyoso.wordpress.com,
diakses14 November 2016).
Dendawijaya, Lukman. 2009. Manajemen Perbankan. Bogor:
Ghalia Indonesia.
Departemen Perizinan dan Informasi Perbankan. 2016. Booklet
Perbankan Indonesia.. Jakarta: Otoritas Jasa Keuangan.
Departemen Perizinan dan Informasi Perbankan. 2017. Statistik
Perbankan Syariah. Jakarta: Otoritas Jasa Keuangan.
Endri. 2008. Prediksi Kebangkrutan Bank untuk Menghadapi
dan Mengelola Perubahan Lingkungan Bisnis Analisa Model Altman’s Z-Score. Jurnal Perbanas Quarterly Review,
2(1): 34-50.
Ghozali, Imam. 2013. Aplikasi Analisis Multivariate dengan Program IBM SPSS 21 Update PLS Regresi (Edisi 7). Semarang:
Badan Penerbit Universitas Diponegoro.
Gusary. 2016. Peringkat Bank Syariah per 30 September 2015, Kinerja Bank,(online), (http://kinerjabank.com, diakses
21 November 2016).
Hadad, Muliaman D, Wimboh Santoso, Sarwedi, Hari Sukarno
& Mohd Adenan. 2004. Model Prediksi Kepailitan Bank Umum di Indonesia. BI Research Paper:1-26.
Harmono. 2009. Manajemen Keuangan-Berbasis Balanced Scorecard Pendekatan Teori, Kasus dan Riset Bisnis. Jakarta: Bumi
Aksara.
Kusdiana. 2014. Analisis Model CAMEL dan Altman’s Z-Score dalam Memprediksi Kebangkrutan Bank Umum di Indonesia. Jurnal Tepak Manajemen Bisnis, 6(1):85-94.
Lukviarman, Niki dan Ayu Suci Ramadhani. 2009. Perbandingan
Analisis Prediksi Kebangkrutan Menggunakan Model
Altman Pertama, Altman Revisi dan Altman Modifikasi
dengan ukuran dan umur perusahaan sebagai variabel
penjelas (Studi pada Perusahaan Manufaktur yang terdaftar di Bursa Efek Indonesia). Jurnal Siasat Bisnis,
13(1):15-28.
Matturungan, Nur Hasbullah dkk. 2017. Manufacturing
Bankruptcy Prediction in Indonesia with Altman A-Score Model. Journal of Applied Management, 15(1):18-24.
Muhamad. 2013. Manajemen Kueangan Syariah-Analisis Fiqh dan
Keuangan. Yogyakarta.
Nada, Shofaun. 2013. Penerapan Metode Multiple Discriminant Analysis untuk Mengukur Tingkat Kesehatan yang
Mengindikasikan Gejala Financial Distress pada Bank Umum Syariah. Jurnal Al-Iqtishad, 5(2): 219-236.
Raharjaputra, Hendra S. 2009. Manajemen Keuangan dan Akuntansi untuk Eksekutif Perusahaan. Jakarta: Salemba Empat. Salimi, Anwar. Y. 2015. Validity of Altmans Z-Score Model
in Predicting Bankruptcy in Recent Years. Academy of Accounting and Financial Studies Journal, 19(2):233-238. Surakhmad, Winarno. 1990. Pengantar Penelitian Ilmiah-Dasar
Metode Teknik. Bandung: Tarsito.
Undang-Undang No. 21 tahun 2008 tentang Perbankan Syariah.
Wijaya, Tony. 2013. Metodologi Penelitian Ekonomi dan Bisnis-Teori
dan Praktik. Yogyakarta: Graha Ilmu.
Yudiana, Fetria Eka. 2013. Dasar-Dasar Manajemen Keuangan.