Customer Satisfaction Index Model on Three Level Of
Socioeconomic Status In Bogor
Case Study: Customer Satisfaction on Branded Cooking Oil
Product
Budi Setiawan
*Customer satisfaction index models have been developed in many countries, including Indonesia. Those models were commonly not focused on the socioeconomic status (SES) of the customer, so this condition could be a research gap. The aims of this research is to analyze the customer satisfac-tion index model of branded cooking oil product in Bogor, Indonesia based on SES established from the household monthly routine consumption. Questionnaires were used as primary data collection instrument in this study, while data analysis was carried out with variance based structural equation modeling (SEM) which is also known as Partial Least Square (PLS) model, and Kruskall Wallis
non-parametric test. Perceived quality, perceived value and customer expectation as were significantly in
-fluencing the customer satisfaction construct in the structural model. This study also concluded found
that there is different level of overall customer satisfaction on the three levels of customer’s SES.
Keywords: Customer satisfaction index, socioeconomic status, household routine consumption, branded cooking oil, partial least square model
Model indeks kepuasan pelanggan telah banyak dikembangkan di berbagai negara, termasuk di In-donesia. Berbagai model tersebut pada umumnya tidak memberi fokus berarti pada status sosial eko-nomi (SES) pelanggan, sehingga kondisi ini menyebabkan adanya kesenjangan penelitian. Penelitian ini bertujuan untuk mengkaji model indeks kepuasan pelanggan minyak goreng bermerek di Bogor, Indonesia berdasarkan pada SES yang dibentuk dari tingkat konsumsi rutin rumah tangga per bulan. Pengumpulan data primer pada studi kasus ini menggunakan instrumen kuesioner dan analisis data menggunakan Structural Equation Modeling berbasis varians atau yang lebih dikenal dengan analisis Partial Least Square (PLS) dan analisis uji statistik nonparametrik Kruskall Wallis. Kepuasan
pelang-gan mampu dibentuk secara positif dan signifikan denpelang-gan menggunakan konstruk persepsi kualitas,
persepsi nilai dan harapan pelanggan, dalam model struktural. Studi ini juga menemukan adanya perbedaan tingkat kepuasan pelanggan secara keseluruhan pada tiga tingkat SES dari pelanggan.
Kata kunci: Indeks kepuasan pelanggan, status sosial ekonomi, pengeluaran rutin rumah tangga per bulan, minyak goreng bermerek, model partial least square
Introduction
The study of customer satisfaction has at-tracted interest of many researchers. The stud-ies were no longer limited only in knowing
whether customers are satisfied or not, but has
evolved into complex structural models. John-son, et al (2001) provided information that a number of countries have developed their na-tional customer satisfaction index models for a wide variety of goods and services, such as Sweden with the Swedish Customer
Satisfac-tion Barometer (SCSB) model in 1989, Amer-ica with The AmerAmer-ican Customer Satisfaction Index (ACSI) model in 1994; Norway with The Norwegian Customer Satisfaction Barometer (NCSB) model in 1996.
Bayol, et al (2000) estimates the European Customer Satisfaction Index (ECSI) model, us-ing customer expectations, perceived quality, perceived value, customer satisfaction, image,
complaint, and customer loyalty as the con-structs. Terblanche (2005) estimated the ACSI model using customer expectations, perceived quality, perceived value; customer satisfaction; and customer loyalty as the constructs. Serenko (2011) tried to apply the ACSI model to mea-sure the student satisfaction with Canadian mu-sic programs. Development in this stream of research included addition of constructs such as perceived loyalty, tuition fee change tolerance and word of mouth. Studies that examined the structural model of customer satisfaction index measurement in Indonesia (Indonesian Cus-tomer Satisfaction Index/ICSI), was carried out Dachyar and Noviannei (2012). They applied the customer satisfaction index structural mod-el in the tmod-elecommunications industry in Indo-nesia using company's image, customer expec-tations, perceived quality, perceived value, and customer loyalty as independent variables.
Adoption of customer satisfaction models of some of the countries into a model of ICSI, can be done by considering many factors. One of the factor is by taking socioeconomic status (SES) of the customer into account. This practice had not been frequently adopted by researchers in
the field of customer satisfaction research in In -donesia. This condition potentially made a gap in the development of ICSI's structural models in the future, because the measurement can not only be a "one-time" or "single-shot studies".
This study used a case study of customer satisfaction households in Bogor on branded cooking oil products, one of the product catego-ries surveyed in Indonesian Customer Satisfac-tion Award (ICSA) since 1999. The aim of this
study is twofold: firstly, it attempted to develop
the best structural model of customer satisfac-tion index of branded cooking oil and compare the level of customer satisfaction across three different levels of SES established based on monthly household consumption of food per month.
Literature Review
Güngör (2007) said that the word "satisfac-tion" is derived from the Latin word "satis" (pretty good, adequate) and "facere" (to do or make). Simply put, satisfaction can be
de-fined as "efforts to comply with something" or
"to make something adequate". Definition of
customer satisfaction according to Kotler and Keller (2009) is a feeling of pleasure or disap-pointment arising from someone who compare a product's perceived performance (or outcome) against their expectations.
Fornell (2007) said that the decline in cus-tomer satisfaction can reduce demand and other things in a "vicious circle", i.e., the erosion of the economic value of the company, employ-ment uncertainty, and will eventually slow the economic growth. Referring to the Güngör (2007), and Fornel (2007)’s opinion, it can be ensured that the customer satisfaction is one of
the best indicators for future profit.
According to Zeithaml (1998), perceived quality is the assessment (perception) of con-sumers regarding product excellence as a whole compared to its alternative. Thus, perceived quality is the ability of a product to be regarded as acceptable in providing customer satisfac-tion relatively compared to alternative prod-ucts from competitors. High perceived quality will encourage consumers to prefer our brand compared to brands from the competitors. Tsi-otsou (2005) said that perceived quality is one of the most important constructs in marketing, and has become the focus of attention of prac-titioners and researchers for a long time. This is because perceived quality can bring positive
influence and benefits for marketing perfor -mance. Sumarwan (2011) explained that
con-sumer confidence in a product, attributes, and benefit of product describe consumer percep -tion. Therefore, the trust will differ among con-sumers.
Tsiotsou (2005) examined the effect of per-ceived quality on overall customer satisfac-tion using the students from the University of Greece as respondents. The research results indicated that perceived quality has positively
significant relationship and effect to the cus -tomer satisfaction. Perceived quality is also able to explain most of the variance of overall customer satisfaction, compared to the repeat purchase of customers. Bayol, et al (2000) em-pirically demonstrated on a cell phone provider industry in European countries, that there is a
significant positive effect of perceived quality
food retail industry in seven metropolitan cit-ies in South Africa. One of the results was that
perceived value was influenced by the differ -ence between the monetary and non-monetary costs, consumer tastes, and consumer charac-teristics, according to Bolton and Drew (1991). Kartajaya (2006) described mathematically that perceived value is the perceived quality divided by price. Perceived value will go up if the per-ceived quality goes up or the price drops. H1: Perceived quality has a positive effect on
customer satisfaction
H2: Perceived quality has a positive effect on perceived value
Kotler and Keller (2009) defined perceived
value as the difference between customer
per-ceived assessments of all benefits and costs
from a bid for the alternative. Perceived value
strongly correlated with the total benefits and
the total costs of the customers. Sudin (2011) said that perceived value is as a strategic weap-on to get customer attentiweap-on and then keep it,
also it becomes a most significant factor of
business on manufacture or service provider. Sudin (2011) examined the role of
per-ceived value in influencing customer satisfac -tion in several companies in Malaysia using convenience sample. The results of his research
found that there is a positive and significant ef -fect of perceived values on customer satisfac-tion. Ekkildsen, et al. (2004) stated that per-ceived value is one of the dominant factors that
significantly shape the customer satisfaction of
retail business in Denmark. Terblanche (2005) provides the same empirical support, that per-ceived value is one of the dominant factors that
significantly shape customer satisfaction.
H3: Perceived value has a positive effect on customer satisfaction
In general, customer expectations are beliefs or estimates of what the customer will receive. Bayol, et al (2000) explains that customer
sat-isfaction can be influenced by many predictors,
and customer expectation is one predictor that positively affects customer satisfaction. More-over, customer expectation also found to form perceived quality, as a predictor on customer satisfaction. Kuang-Wen-Ching Wu and Jun Ding (2007) explained that many of the
empiri-cal research literatures in the field of customer
satisfaction provide results that customer
ex-pectation has a positive and significant effect
on customer satisfaction level. Van Ryzin, et al (2004) implemented the model of American Customer Satisfaction Index (ACSI), to test the drivers and behavioral consequences of over-all satisfaction with local government services. The results suggest that expectations of service
quality significantly drive both perceptions of
quality and overall satisfaction across all sub-groups.
H4: Customer expectation has a positive effect on perceived value
H5: Customer expectation has a positive effect on perceived quality
H6: Customer expectation has a positive effect on customer satisfaction
Marketers have confidence that demograph -ics are important factors in determining market
segmentation. In general, researchers define ex -penditure in terms of that relatively same, but the difference is the basis of grouping often also known as Socioeconomic Status (SES).
H7: There is a difference in overall customer satisfaction based on SES
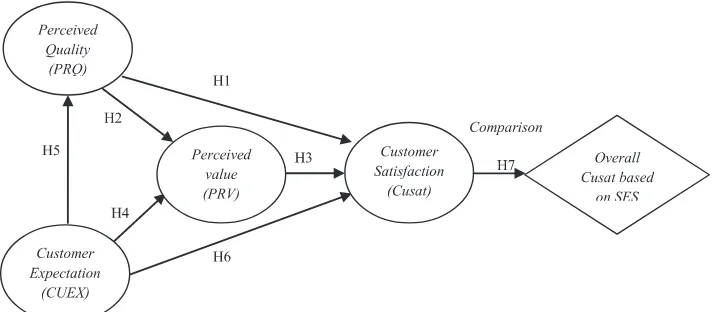
Based on the theoretical basis and the hy-potheses development, then framework of this study is provided in Figure 1.
Methods
conditions or circumstances. Pre-test was con-ducted by giving questionnaires to 30 respon-dents, and then the validity and reliability of the questionnaire were tested. Results of validity and reliability analysis are presented in Table 1.
Based on Table 1 it can be concluded that the questionnaire instrument used in this study has met the validity and reliability aspects, making it feasible to do further analysis. For the main study, a sample consisted of 385 respondents were selected by convenience sampling. The respondents were spread in three districts in Bogor Regency, namely Cibinong, Gunung Pu-tri, Cileungsi, and two districts in Bogor City, namely Bogor Barat and Tanah Sareal. Estab-lishment of three levels of socioeconomic sta-tus was carried out by performing the following steps:
1. Calculating the range value, which is the dif-ference between the maximum value and the minimum value
2. Setting the number of classes, which is 1 + 3.3 x log n
3. Calculating the interval between the data 4. Constructing a frequency distribution table 5. Performing quartile analysis
Structural model was formulated using the variance-based SEM or more commonly known as Partial Least Square (PLS) analysis. The SmartPLS software was used to analyze the statistical data. Ghozali (2008) describes a path analysis model of all latent variables in the PLS consists of the following three sets of re-lationships:
1. Inner models specify relationships among latent variables (structural model).
2. Outer models specify the relationship be-tween the latent variables with the indicator variables itself (measurement model). Outer
model define how each block of indicators
correlate with each latent variables itself. 3. Weight relations in which case the value of
the latent variables can be estimated. Inner and outer models specify the model followed in the PLS algorithm.
Source: developed from Bayol, et al. (2000) and Terblanche (2005)
Figure1. Research Framework
Table 1.The Results of Validity and Reliability of the Questionnaire
No Constructs Manifest Correlation Coefficient Cronbach’s Alpha Score
1 Perceived Quality
Resilience when frying 0.585 0,638
Free cholesterol 0.621
Food cooked through 0.626
Cleanliness of the production process 0.695
Product’s color 0.598
2 Perceived Value
Selling price compared to the given quality 0.759 0,629
Selling price compared to the expected quality 0.672
Nonmonetary cost 0.868
3 Customer Expectation
The comparison of expectation, before and after becoming a customer 0.677 0,616 Hope the quality is more superior than competitors 0.654
Hope evidence advantages in advertising and packaging 0.696 4 Customer
Satisfaction
Overall customer satisfaction 0.893 0,794
Ability to fulfill customer expectation 0.920
In order to determine whether there are dif-ferences in the level of customer satisfaction based on three level of SES, non parametric sta-tistical method (Kruskal-Wallis test) was used. This method was used, because the SES data were measured in ordinal measurement scale.
Result and Discussion
Respondents Profile
Customer frequency by sex was composed of 44.70% male and 55.30% female. In terms of age, respondents were aged between 20 to 60 years old, but majority of respondents were 35 years old. Respondent’s formal education was
dominated by the respondents who had finished
high school (52.99%), followed by respon-dents who had attained undergraduate degree (27.53%). In terms of number of family mem-bers, most repondents have family members between 1 and 4 persons (75.8%), followed by repondents having family members between 5 and 10 persons (22.3%). The majority of re-spondents (81.6%) declared that they know the branded cooking oil through the advertising on television, and made purchase decision by themselves (69.6%), or with spouse (22.9%) and other (7.6%).
Socioeconomic status (SES) of the Customer of Branded Cooking Oil in Bogor
Analyses of the frequency distribution of SES were as follows:
1. The range value was IDR 4,100,000
2. The number of classes is 10 (1 + 3.3 x log 385 = 9.532, rounded to 10)
3. Data interval was IDR 410.000
To establish three socioeconomic status of the customer based on the level of household
consumption per month, the author first de -termined median class of grouping data. The median class is in the 2nd class, because the
cumulative value of the 1st class (104) and 2nd
class (164) has qualified the determination of the median class (268 ≥ 192.5). Based on this
approach, the table of SES can be arranged and provided in Table 3.
PLS Algorithm Analysis
Establishment of the model begins with a PLS algorithm analysis, to test the validity of construct’s indicators and to test the constructs reliability.
According to Table 4, we know that all load-ing factors have a score above 0.50. Thus it can be concluded that the constructs have good convergent validity. Similarly the cross load-ing value shows good discriminant validity,
because the correlation coefficient of reflective
indicators to the construct itself is higher than
the correlation coefficient of reflective indica -tors to the other constructs. It can be interpreted that our questionnaire has valid indicators to measure the constructs in the model. Constructs reliability were measured by composite reli-ability, average variance extracted (AVE) and
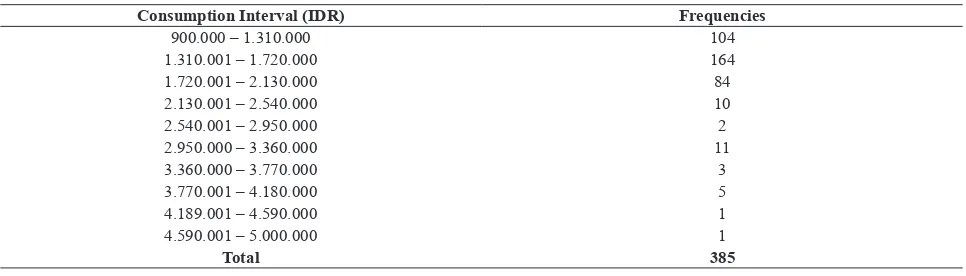
Table 2. Frequency Distribution of Grouping Data
Consumption Interval (IDR) Frequencies
900.000 – 1.310.000 104
1.310.001 – 1.720.000 164
1.720.001 – 2.130.000 84
2.130.001 – 2.540.000 10
2.540.001 – 2.950.000 2
2.950.000 – 3.360.000 11
3.360.000 – 3.770.000 3
3.770.001 – 4.180.000 5
4.189.001 – 4.590.000 1
4.590.001 – 5.000.000 1
Total 385
Table 3. Three Levels of SES Based on Cost of Routine Consumption of Customers
Consume Intervals (Rp) Explanation
900.000 – 1.310.000 Classes below the median class (SES C)
1.310.001 – 1.720.000 Median class (SES B)
by comparing the square root of AVE with the
coefficient correlation between constructs. The
result provided in Table 5.
According to Table 5 it can be concluded that the entire constructs were reliable, because the score of its composite reliability is above 0.60 and similarly with the score of AVE that above 0.50. Besides that, we also can compare the
square root of AVE with the coefficient correla -tion between constructs, provided in Table_6.
The square root of AVE is higher than the
coefficient of correlation between constructs. It means the reflective indicators have high dis
-criminant validity. These results support the composite reliability and AVE analyses that have been done, to test the constructs reliability.
Bootstrapping Analysis
Inner model creates path coefficient that can
be used to test the alternative hypotheses. The result is provided in Table 7.
According to Table 7, the path between cus-tomer expectation and cuscus-tomer satisfaction has
a coefficient score 0.191 with T-Statistics 3.714
> 1,645 (one way test). These results provide
Tabel 4. Factor Loading
Indicators Customer Expectation Customer Satisfaction Perceived Quality Perceived Value
CUEX1 0,826140 0,517965 0,547264 0,579685
CUEX2 0,851641 0,497979 0,540342 0,429708
CUEX3 0,790509 0,426430 0,440756 0,326685
CUSAT1 0,559110 0,898464 0,637684 0,584459
CUSAT2 0,500793 0,891721 0,628894 0,567542
CUSAT3 0,497907 0,858237 0,588691 0,550314
PRQ1 0,486873 0,590703 0,827188 0,545013
PRQ2 0,431000 0,516077 0,792234 0,504882
PRQ3 0,527313 0,590774 0,805869 0,541438
PRQ4 0,550502 0,591384 0,859708 0,591946
PRQ5 0,557586 0,583863 0,820539 0,596737
PRV1 0,555137 0,572130 0,636116 0,881880
PRV2 0,463387 0,576342 0,622729 0,875545
PRV3 0,288348 0,387640 0,331464 0,651094
Table 5. Constructs Reliability
Constructs Composite Reliability AVE √AVE
Customer Expectation 0,863 0,678 0,823
Customer Satisfaction 0,914 0,779658 0,883
Perceived Quality 0,912 0,674737 0,821
Perceived Value 0,849 0,656072 0,810
Table 6. Coefficient Correlation between Constructs
Constructs Cust. Expectation Cust. Satisfaction Perceived Quality Perceived Value Customer Expectation 1,000000 0,588759 0,624637 0,555352
Customer Satisfaction 0,588759 1,000000 0,700841 0,642888
Perceived Quality 0,624637 0,700841 1,000000 0,678750
Perceived Value 0,555352 0,642888 0,678750 1,000000
Table 7. Path Coefficient
Original Sample (O)
Sample Mean (M)
Standard Deviation (STDEV)
Standard Error (STERR)
T Statistics (|O/STERR|) Customer Expectation →
Customer Satisfaction 0,190815 0,189723 0,051376 0,051376 3,714082 Customer Expectation →
Perceived Quality 0,624637 0,625413 0,036057 0,036057 17,323493 Customer Expectation →
Perceived Value 0,215437 0,214649 0,047114 0,047114 4,572655 Perceived Quality →
Customer Satisfaction 0,402778 0,404468 0,062831 0,062831 6,410460 Perceived Quality →
Perceived Value 0,544180 0,545914 0,047012 0,047012 11,575463 Perceived Value →
empirical evidence that customer satisfaction
has a positive and significant effect to customer
satisfaction. Customer expectations towards branded cooking oil were increased from be-fore becoming a customer until has becoming a customer. This means that the customers have expectations of branded cooking oil, to improve its quality, even better than when the respondent has not yet decided to become a customer. In addition, customers also expect that the brand-ed cooking oil can have more superior quality rather than non-branded cooking oil and also be
able to prove all the benefits from the product,
which has been delivered on its advertising and packaging. This is what underlies the creation of customer satisfaction, as evidenced by the al-ternative hypothesis testing that has been done.
Path between customer expectation and
per-ceived quality has a coefficient 0.625 with a
T-Statistics value 17,323 > 1,645 (one way test). These results provide empirical evidence that
customer expectation has a positive and signifi -cant effect to the perceived quality. Customer expectation has an indirect effect through per-ceived quality to customer satisfaction. This means that when an increase in customer ex-pectations is able to be followed by an increase in perceived quality, customer satisfaction will then be created. Causality between customer expectation and perceived value has a
coef-ficient 0.215 with a T-Statistics value 4,573
> 1,645 (one way test). These results provide empirical evidence that customer expectation
has a positive and significant effect to the per -ceived value. Thus, when the customer satisfac-tion was perceived, similar with the monetary and nonmonetary cost which has been issued
by customers, it will indirectly give significant
contribution to establish customer satisfaction. Path between perceived quality and
custom-er satisfaction has a coefficient 0.403 with a
T-Statistics value 6,410 > 1,645 (one way test). These results provide empirical evidence that
perceived quality has a positive and significant
effect to customer satisfaction. The attributes of branded cooking oil that signify perceived quality inclue: hardy when used for frying, cholesterol free, and able to cook food through, hygienic, and have a clear color. Causality be-tween perceived quality and perceived value
has a coefficient 0.544 with a T-Statistics value
11.575 > 1.645 (one way test). These results provide empirical evidence that perceived
qual-ity has a positive and significant effect to per -ceived value. If the branded cooking oil prod-uct already gave the similar quality with the customer perception, then the customer would assume that the monetary and nonmonetary costs they expended to have the product will be worthwhile.
Path between perceived value and customer
satisfaction has a coefficient 0.264 with a
T-Statistics value 4.701 > 1.645 (one way test). These results provide empirical evidence that
perceived value has a positive and significant
effect to customer satisfaction. The perceived values of the customers are the price of the
prod-uct that reflect a given quality, and the quality also already fit with the quality that customers
expect. Overall, this is what underlies the cre-ation of customer satisfaction, as evidenced by the testing of alternative hypotheses, although in terms of willingness to buy a product by ex-tra cost, customers expressed a neuex-tral position.
The Best PLS Model of Customer Satisfac-tion Index
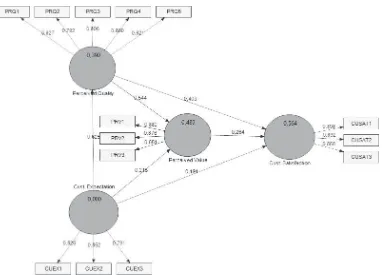
The best PLS model of customer satisfaction index on branded cooking oil that was associat-ed with the three levels of SES from customer, is presented on Figure 2.
According to Figure 2, 56.4% variance scores of customer satisfaction were explained simultaneously by perceived quality, perceived value and customer satisfaction. Perceived quality and customer expectation, simultane-ously explain about 48.9% variance scores of perceived value. Meanwhile the customer ex-pectation explains about 39% variance scores of perceived quality. The model has a valid measurement indicators and also reliable to
re-flectively measure each construct on the model. This model on figure 2 established the customer
satisfaction model of branded cooking oil prod-uct associated with three customers SES levels. This results provide empirical evidence and supports earlier research about customer satis-faction models.
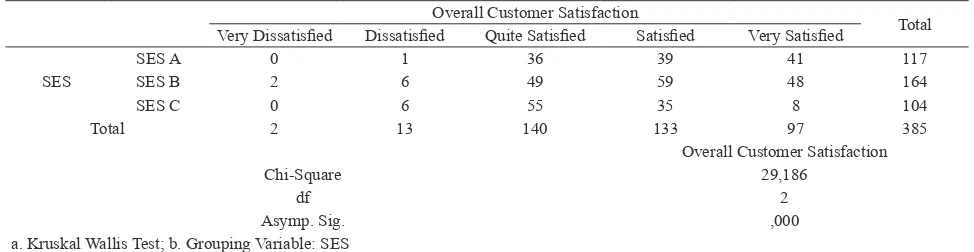
To analyze whether there are differing levels
of overall customer satisfaction based on the three levels of SES, cross tabulation and non-parametric test statistics were conducted. The results are displayed in Table 8.
Table 8 displays information about the spread of customers overall satisfaction based on three level of SES. There was an indication that higher customers SES would lead to higher satisfaction level. The results from nonpara-metric statistic suggest that there was different level of customer satisfaction of branded cook-ing oil products across three levels of SES of household customers in Bogor.
Conclusion
According to the result and discussion, the best model of customer satisfaction index on branded cooking oil product on three level of SES already was established. Perceived
qual-ity has a positive and significant effect to cus -tomer satisfaction. If the branded cooking oil product is able to deliver quality similar to the customer’s perception, then the customer satis-faction will be established. If a branded cook-ing oil product have the quality that match with
customers perception and fit enough with the
monetary and nonmonetary cost expended by customer, assuming all other things constant, then customer satisfaction may be attained. Overall customer satisfaction has a positive
and significant effect to perceived value and
perceived quality, directly and indirectly it will be able to establish the customer satisfaction. From SES level perspectives based on routine consumption per month, there’s a different lev-el of customer satisfaction levlev-el. This research also provides the result that the increase in level of SES will linearly be followed by increase in customer satisfaction level.
Table 8. Cross tabulation of SES and Nonparametric Statistics Test
Overall Customer Satisfaction
Total
Very Dissatisfied Dissatisfied Quite Satisfied Satisfied Very Satisfied
SES
Future Study
This research has limitation in terms of an-alytical tools used to establish the structural model of customer satisfaction based on three
different level of customer SES simultaneously. In future study, this research can be developed further by including the SES variable directly into the model as a moderating variable and then analyze it simultaneously.
References
Bolton, Ruth N. and James H. Drew. (1991), A Longitudinal Analysis of the Impact of Service Chang-es on Customer AttitudChang-es. Journal of Marketing, 55 (1): 1-10.
Dachyar, M. and Noviannei, M. (2012), 'Customer Satisfaction Index Telecommunication Industry in Indonesia', World Academy of Science, Engineering and Technology, International Science Index 69, 6(9), 125 - 126.
Eskildsen, Jacob, Kai Kristensen, Hans Jorn Juhl, Peder Ostergaard. (2004), The Drivers of Customer Satisfaction and Loyalty. The Case of Denmark 2000-2002. Total Quality Management. 5-6 (15): 859-868
Fornell, Claes. (2007), The Satisfied Customer (Winners and Losers in the Battle for Buyer Prefer -ence). Hampshire, England: Palgrave Macmillan
Ghozali, Imam. (2008), Structural Equation Modeling. Metode Alternatif dengan Partial Least
Square. Semarang: Badan Penerbit Universitas Diponegoro
Güngör, Hüseyin. (2007), Emotional Satisfaction of Customer Contacts. Vossiuspers UvA: Amster-dam University Press
Johnson, Michael D. Anders Gustafsson, dan Tor Wallin Andreassen. (2001), The Evolution and Fu-ture of National Customer Satisfaction Index Models. Journal of Economic Psychology. 22: 217 – 245
Kartajaya, Hermawan. (2006), Marketing Plus 2000 (Siasat Memenangkan Persaingan Global). Ja-karta: Gramedia Pustaka Utama
Kotler, Philip and Keller, Kevin Lane. (2009), Marketing Management, 13th edition, Upper Saddle River, NJ: Prentice-Hall
Kuang-Wen Wu dan May-Ching Ding, (2007), Validating the American Customer Satisfaction Index Model in the Online Context: An Empirical Study of U.S. Consumer Electronics E-Tailers. Inter-national Journal of Business and Information. 2 (2): 199-220
Marie-Paule Bayol, Anne de la Foye, Carole Tellier dan Michel Tenenhaus. (2000), Use of PLS Path Modeling to estimate the European Consumer Satisfaction Index (ECSI) Model. Statistica Appli-cata. 12 (3): 361-375
Tsiotsou, Rodoula. (2005), Perceived Quality Levels and their Relation to Involvement, Satisfaction, and Purchase Intentions. Marketing Bulletin. 16: 4 – 20.
Terblanche, Nic S. (2005). A Study of Two Customer Retention Measures: The American Customer Satisfaction Index And The Conversion Model. ANZMAC Conference: Relationship Marketing (Consumer). 1: 50 – 65
Serenko, A. (2011), 'Student satisfaction with Canadian music programmes: the application of the American Customer Satisfaction Model in higher education', Assessment & Evaluation In Higher Education, 36, 3, pp. 281-299, Education Research Complete, EBSCOhost, viewed 12 June 2014. Sudin, Suhaimi. (2011), How Service Quality, Value and Corporate Image Affect Client Satisfaction
and Loyalty. The 2nd International Research Symposium in Service Management. 1: 26 – 30 Sumarwan, Ujang. (2011), Perilaku Konsumen. Teori dan Penerapannya dalam Pemasaran. Bogor:
Van Ryzin, G, Muzzio, D, Immerwahr, S, Gulick, L, & Martinez, E. (2004), 'Drivers and Conse-quences of Citizen Satisfaction: An Application of the American Customer Satisfaction Index Model to New York City', Public Administration Review, 64, 3, pp. 331-341, Education Research Complete, EBSCOhost, viewed 12 June 2014.