LAURA BRONNER
London School of Economics and Political Science
Property and Power: MPs’ Assets
and Support for Democratization in
the 1867 Reform Act
Influential theories of democratization emphasize elites’ fear of the redistributive consequences of democratic reform as an important limit on democratization. They also argue that landowners are more likely than capital owners to fear redistribution, as their assets are less mobile and thus more vulnerable to expropriation. To test these claims on the micro level, this article uses the 1867 U.K. Reform Act, which doubled the enfran-chised population to include much of the urban working class, as a case study. Using an original dataset on the members of the 1865–68 House of Commons, this article finds that in fact, the most substantively important variable for votes on democratization was partisanship, which has been neglected by the distributional conflict literature. Material interests, particularly landowning, do matter, but they are crucially mediated by strategic partisan electoral concerns.
Introduction
Democratization in nineteenth- and early twentieth-century Europe, which often occurred via legislation rather than revolution or pacted transition (Cox 1987; Leeman and Mares 2011; Lizzeri and Persico 2004; Ziblatt 2008),1has frequently been portrayed as having been driven largely
by elites. However, though theories generally agree on the importance of elites, they disagree on the ways in which elites mattered; while some theories, which privilege structural explanations, focus heavily on elite responses to structural changes, arguing that democratization was funda-mentally about redistributive conflict (Acemoglu and Robinson 2006; Boix 2003), others focus on the importance of partisan interests in driving legislative behavior (Ansolabehere, Snyder, and Stewart 2001; Cox 1987; Schonhardt-Bailey 1998, 2003; Firth and Spirling 2003; Spirling and Quinn 2010), including on issues related to democratization (Capoccia and Ziblatt 2010; Close 1977; Collier 1999; Hall, McClelland, and Rendall 2000; Leeman and Mares 2011; Llavador and Oxoby 2005; McLean 2001; Moser and Reeves 2014; Ziblatt 2008).
LEGISLATIVE STUDIES QUARTERLY, XXXIX, 4, November 2014 439 DOI: 10.1111/lsq.12054
This article tests the relative importance of these different theories by examining the voting behavior of members of parliament in passing the Second Reform Act of 1867, a landmark case of legislative democ-ratization, thus making concrete the concept of “the elite” and allowing for both theories’ core causal mechanisms to be tested on the individual level.2 By proposing a theoretical way to combine both material and
partisan incentives into a single framework, it argues that strategic par-tisan concerns moderated the effects of material interests and tests this claim using microlevel voting data. Providing microfoundations of leg-islator behavior not only acknowledges that different members of the “elite” may have different, and possibly even conflicting, motivations (Bermeo 2010), it also avoids an ecological fallacy by testing their proposed level mechanisms using appropriate individual-level data, which previous studies have failed to do (Robinson 1950).
The 1867 U.K. Reform Act—called the “act that transformed England into a democracy” by Himmelfarb (1966, 107)—provides an ideal case study for testing the empirical viability of distributional con-flict theories and their relative importance compared to approaches high-lighting partisan incentives. The Act was vastly consequential for elected representation in Britain, almost doubling the franchise to allow house-hold suffrage in the boroughs, giving industrial working-class men the right to vote for the first time, and making the industrial working class the majority of the electorate (Derry 1966, 46; Guttsman 1963, 75; Himmelfarb 1966, 107). Moreover, it has been explained both with reference to redistributive conflict (Acemoglu and Robinson 2000), according to which it is a key example of pressure from below leading to an elite response, and in terms of purely strategic competition between rival parties and, indeed, rival party leaders, Disraeli and Gladstone (Bendix 1964; Cowling 1967; Himmelfarb 1966; Seymour 1915; Smith 1966). Using an original dataset on the members of the 1865–68 House of Commons, which includes their partisanship, material interests includ-ing landownership and manufacturinclud-ing, finance and trade interests as well as their votes on the 1866 and 1867 Reform Bills, this article turns to quantitative roll-call analysis to examine how these motivations shaped MPs’ behavior. It finds that despite Acemoglu and Robinson’s insistence that the Second Reform Act was a key example of their theory of distri-butional conflict, partisan interest was in fact the main single factor driving MPs’ votes, both directly and by moderating the effect of mate-rial incentives.
framework underlying this article. The third section briefly discusses the data and methods used, and the fourth section presents the results of the quantitative analysis. Finally, the fifth section concludes.
Literature Review and Theory
While we can observe instances in which democratizing reform is passed, it is much harder to infer actors’ motivations in passing it. This section outlines two distinct theoretical approaches which have been used to explain the passage of the Second Reform Act in 1867: redistributive conflict theories which posit the importance of material interests as motivations and a threat from below as a trigger for democratization, and partisan competition explanations which focus on parties’ strategic inter-actions as drivers of reform. This article proposes a way to combine these two approaches, based on the idea that partisan incentives can be seen to moderate the effects of material interests.
Material Interests and the Threat from Below
Acemoglu and Robinson (2006) and Boix (2003) argue that pres-sure for democratization tends to come from the disenfranchised, who want redistribution. Without this popular pressure, these theories claim, democratization would not come about, as elites fear that franchise extensions cause redistribution due to the changing preferences of the median voter (Meltzer and Richard 1978, 117).3According to their
argu-ment, the establishment of democratic institutions is a credible commit-ment to future redistribution, and the chance of transition depends in part on the composition of wealth in a country (Acemoglu and Robinson 2006, 25–26).4
whom resisting democratization is therefore less costly (Acemoglu and Robinson 2006, 32).5 Such redistributive concerns are likely to have
been particularly present in the context of the 1867 Reform Act, which expanded the suffrage so far that industrial working-class men became a majority of the electorate (Derry 1966, 46; Guttsman 1963, 75; Himmelfarb 1966, 107). Indeed, Acemoglu and Robinson (2000) con-sider it an exemplary case for their theory, arguing that pressure from below, caused by the National Reform Union, the Reform League, and particularly the Hyde Park riots in 1866, was crucial in prodding reluc-tant politicians into action.
More recent work also supports the idea that capital ownership can lead to more positive, or at least less negative, attitudes towards democ-racy (Ansell and Samuels 2010; Freeman and Quinn 2012). However, existing tests of these theories have used aggregate capital and landown-ing measures, or, for historical periods, proxies such as the average percentage of nonagricultural population and the urban percentage of the population (Boix 2003, 90).6Thus, this work does not test the theory
adequately; it tests only whether a change in the population as a whole from predominantly landowning to predominantly capital-owning brings about societal democratization, leaving out whether and how this tech-nically microlevel mechanism applies in the people actually making the decisions. While historians have long assumed material interests to matter—“with all the goodwill in the world,” Thomas wrote in 1925, “a parliament of Property Owners cannot but legislate with an eye on their own property” (61)—political science research on legislator behavior has neglected legislator assets in favor of focusing on how party, ideology, and constituency interest drive legislator voting (Cox 1987; Llavador and Oxoby 2005; Leeman and Mares 2011; Schonhardt-Bailey 1998, 2003; Ziblatt 2008).
Party Competition
to pass an even more radical version of the Liberal reform bill that had not only failed to pass, but had also brought down the majority Liberal government the previous year.
Both sides have been ascribed strategic partisan motivations; some have argued that Disraeli was attempting to enfranchise lower middle-class voters who were thought to vote Conservative (Himmelfarb 1966) while others have focused on Liberals’ partisan gain (Hall, McClelland, and Rendall 2000, 7–8). The artisanal and industrial working class was expected to vote for the more left-wing party—the Liberals in mid-nineteenth-century Britain—while agricul-tural laborers were seen as supporting more right-wing, or Conserva-tive, parties as they were expected to be under the economic and social influence of their (largely Conservative) landlords (Himmelfarb 1966; Llavador and Oxoby 2005). In this case, as the franchise extension on the legislative agenda was aimed at expanding the vote in the borough constituencies, which were mainly towns, the theoretical expectation for MPs in the 1865–68 Parliament is that on the whole, Liberal parties would support reform, while Conservatives should oppose it. While Acemoglu and Robinson (2000, 1187–89) criticize this approach, claiming it did not apply in most cases they consider and particularly dismissing it in the case of the 1867 Reform Act, the historical litera-ture highlights its importance. Thus, though this article assumes that distributive conflicts matter, it does not disregard the effect political institutions, particularly parties, may have on MPs’ incentive structures.
Party and Material Interests
antidemocratically); similarly, a Liberal capitalist MP is also subject to reinforcing rather than cross-pressuring motivations to vote pro-democratically. However, Liberal landowning and Conservative capital-ist MPs are both hypothesized to be subject to cross-pressurization; in the former case, partisan considerations incentivize the MP to vote for democratization, which may threaten his material interests, while in the latter case, partisan electoral strategies drive the MP to vote against democratization, while the theory holds that material interests should incentivize him to support it. Partisan considerations are thus seen to moderate MPs’ material incentives.7
Hypotheses
This article sets out to test three main-effect and two interaction hypotheses regarding how MPs voted on a total of 30 amendments to 1866 and 1867 reform bills (see the next section).
Party
H1 (Party Hypothesis):All else equal, Liberal MPs will be more likely to vote for democratization than Conservative MPs.
Material Interests
H2a (Landowning Hypothesis):All else equal, landowning MPs will be less likely to vote for democratization than those MPs who do not own land.
H2b (Capital-Owning Hypothesis):All else equal, capital-owning MPs will be more likely to vote for democratization than those MPs who do not own capital.
These two different types of main-effect hypotheses intersect with one another, leading to the formulation of two specific interaction hypotheses:
Cross-Pressurization of Party and Material Interests
H3 (Liberal Landowner Hypothesis):Liberal landowning MPs will be less likely to vote for democratization than Liberal nonlandowning MPs.
Data and Methods
Data
Data on individual MPs in the 1865–68 Parliament—particularly containing detailed biographical and property ownership information— was not available, so an original dataset was compiled from historical sources. While the dependent and independent variables are outlined here, the control variables used are elaborated on in Appendix A2.
Dependent variables. The Liberal majority government of 1865–66 attempted to pass a reform bill in 1866 and failed. The Con-servative minority government which subsequently came to power then passed a similar, but even more radical bill—the 1867 Reform Act. Though this second bill was passed without a recorded roll call at its third reading, posing a challenge for roll-call analysis, multiple divi-sions were called on amendments during both bills’ journeys through the House of Commons, including one amendment to the 1866 bill which Gladstone declared a vote of confidence; the failure of this amendment brought down the Liberal government. This article exam-ines how MPs voted on 30 amendments to these two bills—six on the 1866 Liberal bill and 24 on the 1867 Conservative bill.8The
amend-ments cover multiple different issues, but the 30 selected were included as they dealt clearly with issues surrounding democratization. For each amendment, one side (the “ayes” or the “noes”) were identified with the pro-democratic position, while the other was classed as antidemo-cratic, such that each participating MP was classed as having voted pro- or antidemocratically.9
For part of the analysis, a second dependent variable was con-structed out of MPs’ votes on these 30 amendments. For each MP, a “democratic proportion” was calculated by dividing their number of pro-democratic votes by the total number of votes they cast. Each MP thus had a democratic proportion ranging from 0 to 1, which expressed his cumulative “democraticness” over the course of the 1866 and 1867 Reform bills.
the vote (Cowling 1967, 282; McLean 2001, 68), among other important amendments. This was simply accepted by Disraeli without a division, as were amendments which permitted the lodger franchise, dropped fancy franchises, educational qualifications, and other regulations limiting the suffrage (Himmelfarb 1966, 107; Smith 1966, 207).
Independent variables.MP occupation data were collected using a wide variety of historical reference works, most importantly Debrett’s Illustrated House of Commons, and the Judicial Bench, compiled by Robert Henry Mair (1868); theWho’s Who of British Members of Par-liament, compiled by Michael Stenton and Steven Lees (1976/1978); and the onlineOxford Dictionary of National Biography, among others. MPs were coded as havingManufacturing interestsif they owned or managed factories or manufacturing businesses, including breweries, glassware factories, and the like. They were coded as having Financial or trade interestsif they held occupations such as banker, merchant, or director of insurance companies.10
The main variable used to test whether landholding matters for MP voting is a dummy variable, Landowner.11 Landholding data were
taken from The Great Landowners of Great Britain and Northern Ireland, by John Bateman (1883; also used by historians, e.g., Guttsman 1963); this includes a comprehensive list of all landowners who held at least 3,000 acres of land worth at least £3,000 in gross annual value, a boundary Bateman argues lets us “distinguish the sheep from the goats, amongst those who would have us believe them to be cream upon the milk of English society” (1883, xvi). These data were, in most cases, verified at least cursorily by the individuals themselves (xxvii).12
MPs’ party affiliations were obtained from Mair (1868), Stenton (1976), and Stenton and Lees (1978); the variable in the models,Party, is a dummy for Liberal MPs, with Conservatives used as the base category as they formed the government for most of the amendments under con-sideration. When MPs were listed in these sources as Liberal-Conservatives, due to party switching, the party was selected which Craig (1977) or Walker (1978) claimed the MP ran for in the 1865 election, regardless of prior or subsequent affiliations.
Method
individual-level characteristics of MPs, in particular their party and asset type, were correlated with their votes on democratization. According to the procedural rules of the House of Commons, a division (both in the House itself and in committees; May 1855, 291) requires two tellers on each side, usually the party whips, who count the votes rather than voting themselves.13As these men had to be associated with the side they counted
(May 1855, 287), they have been categorized, for the purposes of this analysis, as having voted for that side. There is no need for major concern regarding selection bias due to selective calling of roll calls (Carrubba et al. 2006), as recorded roll-call votes (“divisions”) were necessary when vocal votes are not decisive enough for the speaker or committee chair to declare it for one side or if MPs challenged a call for one side in the House of Commons (Evans 2002, 90; May 1855, 234–35).
The model used predicts pro- and antidemocratic votes using individual-level variables. For each MP, the dataset includes multiple roll-call vote observations, ranging from 0 for MPs who never voted to 30 for MPs who voted on all amendments. MPs’ likelihood of voting pro-democratically was predicted using a logit model; as it seems likely that an MP’s separate votes are similar to one another, standard errors were clustered by MP. Though there is variation at the level of each individual amendment, it is difficult to include variables in the model to predict these differences, as there were no a priori expectations about the amendments’ effects. Therefore, in order to be able to prevent unex-plained variation at the amendment level from biasing the model, fixed effects for each amendment were included.14
The model used is thus of the form:
Logit Democratic vote
… 229Amendment 28Amendment
Amendment
whereβ1toβn-30are the coefficients of all the independent and control
variables in the model,βn-29 to βn are the coefficients of all individual
amendments, and ε is the error term. The second dependent variable,
Results: The Impact of Party and Material Interests on Democratic Votes
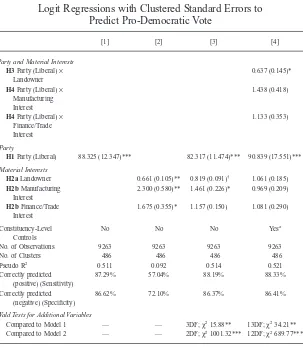
Statistical analysis of the factors driving MP voting shows that while both party and material interests matter, party is by far the most substantively important variable, directly contradicting Acemoglu and Robinson’s (2000) argument that party was irrelevant to the passage of the 1867 Reform Act in the United Kingdom. Logistic regressions with amendment fixed effects and clustered standard errors at the MP level are shown in Table 1. Both party (model 1) and material interests (model 2) support Hypotheses 1, 2a, and 2b when considered separately in models; that is, being a Liberal has a substantively large and statistically highly significant pro-democratic effect compared to being a Conservative, and owning land has a negative effect on MPs’ likelihood of voting pro-democratically on amendments to the 1866 and 1867 reform bills, while owning either manufacturing or finance or trade interests has a significant positive effect.15
However, combining the independent variables (model 3) tells us that while both types of interests matter, the effect of partisanship is much larger substantively. Controlling for party diminishes the size of the effect of material interests; in fact, holding a financial or trade inter-est now no longer has a significant positive effect on MPs’ likelihood of voting pro-democratically, and the size and significance of holding manufacturing interests has also diminished. Despite the correlation between material interests and party likely arising from politicians selecting into different parties based on their interests, the effect of party remains highly significant once material interests are controlled for. Moreover, measures of fit also show the importance of party: not only is the pseudo R2 much higher when party is included (0.514)
alongside material interests than when it is left out (0.092), but calcu-lating the percentage of cases that were correctly predicted, both for the pro-democratic (sensitivity) and the antidemocratic votes (specificity), shows that model 3 predicts 88% of pro-democratic votes and 86% of antidemocratic ones correctly, compared to model 2, which excludes party and predicts only 66% of pro-democratic votes and 72% of antidemocratic votes correctly. This makes clear that a model which does not take party into account dramatically underpredicts the pro-democratic vote in these amendments.
TABLE 1
Logit Regressions with Clustered Standard Errors to Predict Pro-Democratic Vote
H1Party (Liberal) 88.325 (12.347)*** 82.317 (11.474)*** 90.839 (17.551)***
Material Interests
H2aLandowner 0.661 (0.105)** 0.819 (0.091)† 1.061 (0.185)
H2bManufacturing
Interest
2.300 (0.580)** 1.461 (0.226)* 0.969 (0.209)
H2bFinance/Trade
Interest
1.675 (0.355)* 1.157 (0.150) 1.081 (0.290)
Constituency-Level Controls
No No No Yesa
No. of Observations 9263 9263 9263 9263
No. of Clusters 486 486 486 486
Pseudo R2
Wald Tests for Additional Variables
Compared to Model 1 — — 3DF;χ215.88** 13DF;χ234.21**
Compared to Model 2 — — 2DF;χ21001.32*** 12DF;χ2689.77***
Note:In all models, MPs are only included when 6 or more votes (20% of the total possible votes) are recorded for them in the dataset. This is to minimize noise due to those MPs for whom a reasonably comprehensive assessment of their views on democratic reform was not presented (other roll-call analyses also impose a minimum vote restriction, e.g. 25 out of 186 possible votes in Schonhardt-Bailey, 2003). This was also done to increase the comparability between this logit model and the other models estimated (see below), which use proportions as dependent variables and are thus particularly sensitive to reliability issues if proportions calculated on such few observations are included. 53 MPs, or 7.5% of the sample as a whole, were thus excluded from the analysis. Included, but not reported for clarity: dummy variables for each amendment (all models); dummy variables for members of the Cave of Adullam (models 1, 3, and 4), dummy variable for High Political Office (Conservative) and High Political Office (Liberal) (model 4); dummy variable for prior low political office (model 4).
a
Table A4.3 in Online Appendix A4 shows the effects of all control variables, as well as a brief discussion of their effects, which are all largely consistent with existing literature.
Odds ratios reported; standard errors in parentheses; two-tailed tests;†p
moderate the effect of material interests. This moderation effect is, however, true only for landownership. Landowning has a negative effect on MPs’ likelihood of voting pro-democratically for Liberals, but it does not have the same effect for Conservatives, supporting Hypothesis 3. This is in accordance with the argument that Conservative MPs’ partisan and land-based pressures work in the same direction, while it is only for Liberal MPs that owning land creates a situation of cross-pressurization, in which their partisan incentives pressure them to support democratic reform while their concern about the potential expropriation of their land causes pressure in the antidemocratic direction.16At the same time, party
remains highly significant and substantively important, an effect that is robust to the inclusion of all controls. Party is not simply a stand-in variable for material interests, but rather generates crucial incentives in its own right.17
However, this model also shows that Hypothesis 4 is not borne out by the data; the effect of capital—both manufacturing and finance/ trade—interests is not as expected according to the theoretical frame-work. Based on Acemoglu and Robinson’s (2006) argument that capital owners, particularly owners of manufacturing interests, are willing to democratize due to concerns about the cost of conflictual labor rela-tions, Hypothesis 4 set out the expectation that owning manufacturing interests in particular would cause a similar cross-pressurization for Conservatives as owning land does for Liberals; however, this does not seem to be the case. In fact, model 4 shows that neither manufacturing nor finance/trade interests appear to have a significant negative effect on Conservative MPs’ likelihood of voting pro-democratically.18 This
finding casts doubt on theories which focus on the positive effect of capital owning on democratic attitudes, while supporting those theories, like Boix’s (2003) and Acemoglu and Robinson’s (2006), who provide plausible explanations for why owning land has a negative effect on democratic attitudes.
The strong partisan effect raises a puzzle, however. While Liberals were much likelier to vote pro-democratically, it was in fact the Conser-vativeswho were in government when the Act was passed. Thus, while the Conservatives initially proposed the 1867 bill, this analysis reveals that Liberals were largely the ones responsible for the addition of amend-ments making it more democratic.19This detail explains in part why
Acemoglu and Robinson (2006) missed party’s importance here; they argue that one reason party cannot have been important is that the Conservatives, who passed the bill, lost the next election, while in fact it was Liberals who made the bill as democratic as it eventually became.20
it was the Conservative government’s prerogative to decide, at any point, that the bill had become too radical to support. The fact that they did not do so reveals that though they would have preferred a less radical bill, it did not cross the line of acceptability. This initially seems to contradict the conclusions arrived at here with regard to Conservative preferences, but on closer examination it can be explained with recourse to Benjamin Disraeli’s unique ideological and strategic position; as both contempo-raries and scholars of the period have found, Disraeli, who was the Chancellor of the Exchequer and the leader of the government in the House of Commons, seemed willing to accept any amendment so long as the Reform Bill itself passed (Hall, McClelland, and Rendall 2000, 8; McLean 2001, 70).21This counterintuitive finding makes up a large part
of the puzzle of the 1867 Reform Act.
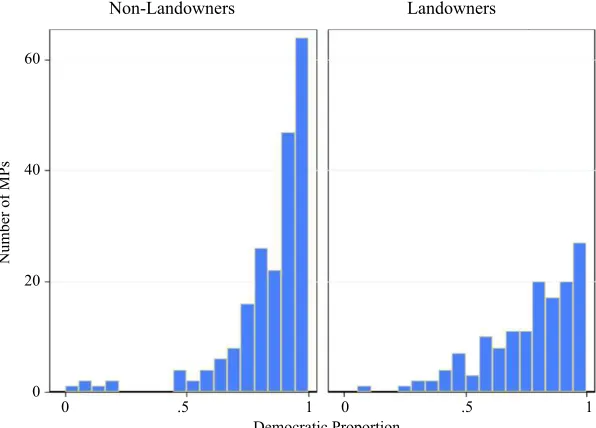
In order to aid understanding of the differential effect of landown-ing by party, predicted democratic proportions have been generated which vary theoretically from 0 (every registered vote is antidemocratic) to 1 (every registered vote is pro-democratic).22 Owning land had an
antidemocratic effect for Liberals which it did not have for Conservative MPs. Figure 1 (below) shows this effect among Liberal MPs in the raw data; the two graphs are the frequency of different democratic propor-tions for nonlandowners (left) and landowners (right). Though both sets of MPs tend to have democratic proportions over 0.5, as they are all Liberal, particularly democratic proportions over 0.9 are much more common among nonlandowners than among landowners.
This moderated effect of landowning is also shown in Table 2. For Conservatives, the difference between a landowner and a nonlandowner is only 0.01, and in this case Conservative landowning MPs are actually more democratic than nonlandowners, though this effect is not statisti-cally significant. However, for a Liberal MP, being a landowner gives him a predicted democratic proportion of 0.75, compared to one of 0.82 for nonlandowners. Though the confidence intervals overlap, a t-test shows this difference to be significant at 95% confidence (p-value of 0.029). Thus, all else equal, a Liberal nonlandowner is predicted to vote demo-cratically 82% of the time, compared to 75% for a comparable land-owner. Again, it is clear that party is the most important single factor (among nonlandowners, a Conservative MP is predicted to vote demo-cratically only 8% of the time, compared to 82% if he is Liberal), but the cross-pressure created for Liberal MPs by the ownership of land seems to make those individuals significantly less democratic than nonlandowners of various types.23This seemingly antidemocratic effect of
FIGURE 1
Difference in “Democratic Proportion” Among Liberals, by Landownership
0 .5 1 0 .5 1 Democratic Proportion
Number of MPs
60
40
20
0
Non-Landowners Landowners
TABLE 2
Predicted Democratic Proportions by Party and Landownership (using GLM)
Predicted Democratic Proportion
Standard Error
95% Confidence
Intervals P-value
Liberal Nonlandowner 0.816 0.028 0.762 0.871 Liberal Landowner 0.754 0.0394 0.676 0.831
T-test 0.029
Conservative Nonlandowner 0.0799 0.0135 0.0534 0.106 Conservative Landowner 0.0933 0.0148 0.0644 0.122
Note:Democratic proportions predicted for MPs from county constituencies without dominating
consequences of democratization more than those whose income comes from other sources. However, there is no support for the theory that owning financial, physical or human capital makes MPs anymorelikely to support democratization than non-capital owners, casting doubt on theories which focus on the supposedly more democratic nature or eco-nomic incentive structure of capital owners.24
Conclusion
The first wave of democratization has been one of the primary targets for redistributive conflict theorists, who have claimed that their arguments explain the expansion of the suffrage in nineteenth- and early twentieth-century Europe. Using an original micro-level dataset on the legislators in the 1865–68 House of Commons, this article has found that while there is some support for redistributive conflict theories, exclusive focus on material interests neglects the single largest substantive factor affecting how MPs vote—partisanship. Parties are not merely conduits of individual or constituency interests, but generate incentives for self-preservation; while Liberals saw the expansion of the urban working-class vote as benefiting them electorally, Conservatives opposed democratizing amendments on the bill because they were worried about the future performance of their parties at the polls. “The Conservative party, whose opinions have had my most sincere approval,” Viscount Cranborne, who later became Prime Minister Lord Salisbury, declared at the Reform Act’s third reading, “have, to my mind, dealt themselves a fatal blow by the course which they have adopted.” (HC Deb, 15 July 1867, vol 188, col 1539).
(HC Deb, 9 May 1867, vol 187, col 280).25 Brett, and many other
Conservatives, ultimately opted for tacit support of their government and, thus, of a bill that most would rather have rejected. These unusual circumstances do, however, make this case somewhat idiosyncratic, which should limit how generally applicable we take this article’s find-ings to be.
Partisanship was not only crucial in its own right; it also moderated the effect of landowning. While there is support, on the micro level, for Boix’s (2003) and Acemoglu and Robinson’s (2006) argument that land-owners were particularly resistant to democratization,26lending credence
to their argument on the importance of landholding inequality and its changes for democratization, such redistributive concerns do not operate in a vacuum. Rather, political institutions integrally shape MPs’ incentive structures as well; partisanship, in particular, crucially affects MPs’ cal-culations. While landowning does not appear to make a difference for how Conservative MPs vote, as they tend to support the antidemocratic side of the amendment regardless, Liberal landowners are less democratic than their nonlandowning counterparts: they are less likely to vote for the pro-democratic side in amendments to the 1866 and 1867 bills than comparable nonlandowners. This article has proposed that these findings are due to the fact that electoral concerns and redistributive fears rein-forced one another for Conservative MPs, while they created cross-cutting pressures for Liberals; here, partisan electoral considerations pushed MPs to support democratization, but for landowners, concerns about redistri-bution created a dilemma. Theories which ignore these political incentives in favor of exclusively structural or material explanations are thus overly simplistic and fail to capture the complexity of MPs’ decision making on an issue as important and wide-reaching as democratization.
particular, it is possible that the effect of capital ownership is expressed via the selection into parties, making this relationship an interesting one to attempt to disentangle.
Laura Bronner<[email protected]>is a Ph.D. candidate in the
Department of Government at the London School of Economics, Con-naught House, Houghton Street, London WC2A 2AE.
APPENDIX A1
12 Increasing the number of people who could votea
Division no. 39, 2nd May 1867: Amendment to prevent the reduction of the residency requirement from 2 years to 12 months Reapportioning the
Division no. 70, 31st May 1867: Amendment to reduce the number of seats for boroughs with a population of under 10,000 from 2 to 1 Regulating vote-buying 6 Making vote-buying more
difficult to perpetrate, easier to detect, or subject to harsher penalties
Division no. 120, 4th July 1867: Amendment to as they were meant to undercut the voting power of the newly enfranchised workers in these constituencies (McLean 2001, 69; Smith 1966, 212)
Division no. 124, 5th July 1867: Amendment to introduce cumulative voting in 3-member constituencies
TABLE A1 (continued)
Type of Amendment Frequency Intent Coded as Democratic Example Amendment
Reducing candidate expenditure during electoral campaigning
1 Reducing expenditure, as it was intended to allow less wealthy candidates to run
1 Intending for the added dimensions to prevent its passage through the House
Division no. 51, 7th June 1866: Amendment to postpone the Reform Bill until after the passage of a seat redistribution bill Introducing women’s
suffrage
1 Introducing women’s suffrageb
Division no. 52, 20th May 1867: Amendment to retain the word “man” in the bill’s clause and avoid its replacement with “person”
Note:Frequency refers to the number of amendments, out of 30 in total, belonging to each category.
Intent coded as democratic refers to the side of the amendment which, if triumphant, would have had a democratic outcome (i.e., the proposition side for pro-democratic amendments, and the opposition side for amendments which were antidemocratic in intent). For the last three categories, the example amendment is the only amendment in the category.
aThis is subject to one important caveat. At the time, it was possible for citizens to vote multiple times if they qualified through separate property ownership. Several amendments were identified which would have expanded the suffrage, but rather than enfranchising previously unenfranchised citizens, the effect was or would have been to thereby substantially increase the number of voters who had multiple votes. This was difficult to classify as it seems, according to current standards, severely undemocratic for the same citizen to have multiple votes; however, this is a somewhat anachronistic interpretation, as contemporaries, even those generally on the side of democratization, did not see this as a problem (see e.g., the debate on copyhold owners, HC Deb, 24 June 1867, cols 458–61), in which it is clearly held that while MPs rejected the notion that one man could vote twice on the basis of ‘one qualification’, the same property in the same constituency, they ought to be able to vote in
everyconstituency in which they held a property qualification). Due to this difficulty of
classifica-tion, these amendments (13 in total) have been dropped from the analysis.
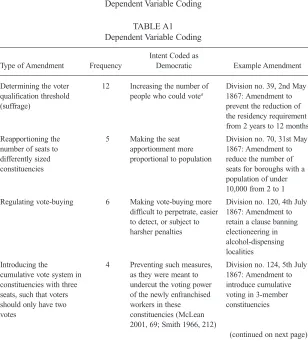
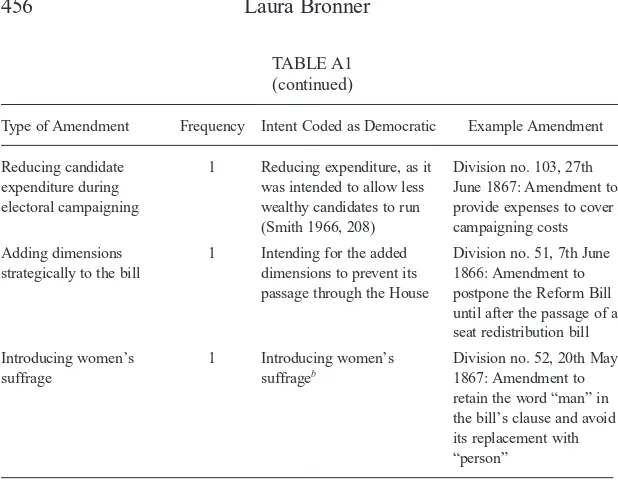
The 30 amendments considered were grouped into different categories by type, as they dealt with suffrage questions, seat redistribution, corruption and other issues relevant to democratization; Table A1 shows these categories, an example amendment for each, and the criterion according to which each amendment was coded as pro- or antidemocratizing in intention.
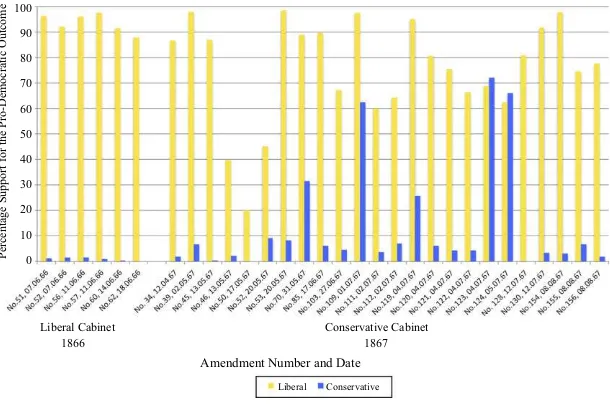
Figure A1 shows all the amendments considered and the extent of each party’s support for the prodemocratizing outcome in each amendment. Further, the graph is split according to the two cabinets in the parliament considered; the set of six amendments on the left took place in 1866, under the Liberal cabinet, while the 24 amendments on the right were voted on under the Conservative cabinet in 1867. As the figure shows, Liberals heavily outweighed Conservatives in supporting the prodemocratizing side of almost all amendments; this trend is obvious in 1866, but remains clear even in 1867 despite the fact that the Conservative government was the driving force behind the bill. Indeed, there are only three amendments in which the majority of Liberals did not vote pro-democratically and only three in which the majority of Conservatives did.
APPENDIX A2
Control Variables
Control variables include some individual-level characteristics that are not directly linked to our theoretical framework and an array of constituency-level variables. A
FIGURE A1
Pro-Democratic Vote by Party and Amendment
100
90
80
70
60
50
40
30
20
10
0
Percentage Support for the Pro-Democratic Outcome
Liberal Cabinet Conservative Cabinet 1866 1867
Amendment Number and Date
dummy variable forAdullamitewas created in order to control for membership of the Cave of Adullam, a faction of rebellious, antireform Liberal MPs who voted against their own party leadership on the 1866 Reform Bill and thereby brought down the Liberal government. Though this dummy is included to catch variation driven by the ideological commonalities of these MPs and their coherence as a rebellious parliamentary faction, it is necessary to emphasize that selection into this group was not random, and in fact positively correlated (moderately, but significantly) with landowning. Heckelman and Dougherty (2013) discuss how previous political experience at a local or other level may have influenced members of the 1787 Constitutional Convention in the United States, so a dummy variable for low-level (local) political positions was included in the analysis.
To control for the impact of landholding inequality in MPs’ constituencies (Ziblatt 2008), I constructed a rudimentary approximation of a landholding Gini index for English and Welsh counties (though not those in Scotland and Ireland) from data pro-vided by Bateman (1883) on the number and respective total landownership of different social groups in each county. Following Ziblatt (2008), due to the nonlinear relationship between inequality and democracy sometimes predicted by scholarship (especially Acemoglu and Robinson 2006), squared and cubed landholding inequality terms were added to the model. Qualitative literature also emphasizes that as the 1867 Act redistrib-uted seats among constituencies, MPs whose constituencies would lose seats—“dying swans” in the words of Julian Goldsmid, MP for Honiton27
—may have voted against the bill for that reason. Dummy variables have been created to measure whether constituen-cies were to lose seats in 1868 (Seat lost 1868). Though the dependent variable here precedes the independent variable, those constituencies that lost seats largely did so for reasons of corruption and/or population size, so including a dummy variable for seat loss can be seen to measure underlying undemocratic attributes of a constituency (it was either corrupt or vastly overrepresented given its population size). Further, other constituency-level variables were used as controls as they may well have had certain systematic effects on the MPs elected and their views on democracy. This includes a dummy variable if the constituency was aboroughas opposed to a county seat.28This inclusion was because,
firstly, the occupation structure of the voting population is assumed to be different, such that county MPs are sometimes held to be representatives of the landed interest (e.g., Cacroft 1867, 120), and secondly, the bill expanded the borough franchise more than the county franchise, so this may have been important to MPs’ decision making for direct reasons.29Further, a dummy variable was created for constituencies in which Mair (1868)
reported that a locally notable individual or family-dominated elections (dominant inter-est), as this might lead to reliance on accountability to this dominant notable rather than on their own or constituency interests.
APPENDIX A3
Descriptive Statistics
A3.1 Party and Material Interests
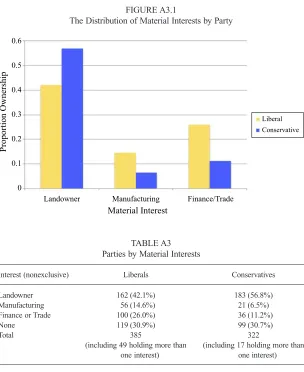
land-owners, compared to 57% of Conservatives who are; at the same time, 15% of Liberals own manufacturing and 26% own finance or trade interests, compared to 7% and 11% of Conservatives who do so, respectively. The correlations between party and material interests are relatively low (0.15 for landownership, 0.13 for manufacturing, and 0.19 for finance or trade interests), but in all cases highly statistically significant. This relationship between material interests and party membership is likely based on the reasons for MPs’ selection into the different parties, an issue which would benefit from closer investigation. The full breakdown of parties into material interests is shown in Table A3. A minority of MPs (49 Liberals and 17 Conservatives) had more than one material interest; rather than excluding these potentially important people, or making a judgment call as to which category was more appropriate based on sometimes scant historical sources, it was permitted for such multiple interests to coincide.
FIGURE A3.1
The Distribution of Material Interests by Party
Proportion Ownership
Landowner Manufacturing Finance/Trade Material Interest
0.6
0.5
0.4
0.3
0.2
0.1
0
Liberal Conservative
TABLE A3 Parties by Material Interests
Interest (nonexclusive) Liberals Conservatives
Landowner 162 (42.1%) 183 (56.8%) Manufacturing 56 (14.6%) 21 (6.5%) Finance or Trade 100 (26.0%) 36 (11.2%) None 119 (30.9%) 99 (30.7%)
Total 385 322
(including 49 holding more than one interest)
A3.2 Partisanship and Support for Democracy
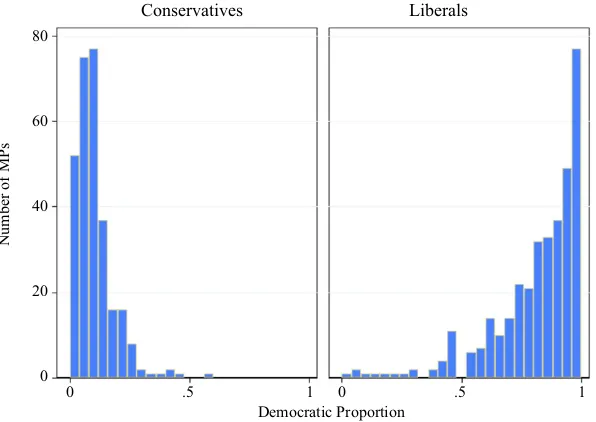
The importance of party is illustrated in Figure A3.2, which shows MPs’ “demo-cratic proportion” in the raw data; that is, the proportion of their total votes which was pro-democratic, by party. Clearly, Conservative MPs’ democratic proportions are con-centrated below 0.25, while Liberal MPs’ proportions show more variation, but are overwhelmingly over 0.5, with particular concentration over 0.75.
NOTES
Many thanks to Arthur Spirling, Petra Schleiter, Ben Ansell, Lanny Martin, two anonymous referees, Øyvind Skorge, Jonathan Mellon, Olukunle Owolabi, Emanuel Coman, Valerie Belu, Ben Shaw, Luigi Marini, Chima Simpson-Bell, and participants at the Nuffield College Graduate Research in Progress Seminar and at the MPSA Annual Meeting 2013 for helpful comments and suggestions, as well the Weatherhead Center at Harvard University for its generous hospitality.
1. This was not always the case; sometimes, an unelected executive (such as Bismarck) made such decisions (Collier 1999, 3). However, in many cases, such democratizing or autocratizing bills were sanctioned by parliament.
2. MPs undoubtedly formed part of Britain’s political elite, and as the position was unpaid and the costs of both contesting elections and supporting oneself while in
FIGURE A3.2
The Distribution of MPs’ ‘Democratic Proportions’ by Party
Number of MPs
Conservatives Liberals 80
60
40
20
0
Parliament were higher than ever before (Guttsman 1963, 18), it is reasonable to assume that they were in the economic elite as well.
3. This argument does not rely on whether democracies actually are more redistributive than nondemocracies, but merely on whether the actors involved anticipate that it may be and that this may affect their own assets.
4. This “threat from below” argument has found empirical support in Przeworski (2008).
5. Ansell and Samuels (2010) also argue that ownership of capital drives democratization, though they take a different theoretical approach, using contractarian rather than redistributive logic. They claim that a rising class of capital owners want to protect their assets from expropriation by the potentially predatory government by instating the property rights that come with democracy. Though this article retains Acemoglu and Robinson’s (2006) redistributive logic, the theorized impact of land and capital should be the same even if Ansell and Samuels’ (2010) theory is adopted.
6. Both Boix (2003) and Acemoglu and Robinson (2006) also make arguments about the effect on democratization of income inequality, with the former arguing that decreasing inequality should increase chances of democratization while the latter propose an inverted U-shaped relationship, with chances of democratization highest at middling levels of inequality. Przeworski (2008) finds support for the former thesis in his test of suffrage reforms. However, the effect of income inequality will not be tested here, as it is not clear how it is purported to matter on the individual level; rather, it is controlled for cross-regionally.
7. This theoretical framework thus ignores how an MP’s constituency’s interests might affect his incentive structure. Though an attempt is made to control for many constituency-level variables, as they are likely important and their effects ought to be accounted for, it is yet unclear how these variables moderate the incentives created by material and partisan electoral concerns.
8. However, if the 1866 amendments are excluded, the results remain robust. 9. The coding of the dependent variable is explained in more detail in Appendix A1.
10. It was decided that a minimum of two directorships was necessary for an MP to be classified as having financial or trade interests, as it was possible that a single place on a board of directors was more about status than about actually engaging with the financial/trading world (36 MPs held only one directorship).
11. Note that this category of landowners partially overlaps with the preceding category of MPs holding manufacturing or finance/trade interests; these interests were not mutually exclusive. Table A3 in Appendix A3.1 shows the distribution of interests by party.
13. http://www.parliament.uk/site-information/glossary/tellers/ (accessed December 1, 2013).
14. However, the results are robust regardless of whether amendment fixed effects are included.
15. As party and the control variables are conceptually subsequent to economic interests, leaving out these secondary variables shows that material interests thus affect democratizing votes in the raw, pre-“treatment” data. Appendix A3.1 elaborates on the correlations between party and property interests in this dataset.
16. Due to the limitations of the data on landholding inequality, models 1–4 are limited only to MPs from English and Welsh constituencies. In order to test whether the effect holds once Scotland and (pre-independence) Ireland are included as well, TableA4.3 in online Appendix A4 compares model 4 (showing the full set of controls) with a model A4 which excludes our measure of landholding inequality and instead includes dummy variables for Irish, Scottish, and Welsh constituencies, to account for systematic regional differences. This model shows that both the importance of party and the negative effect of landowning for Liberals remain in place even when these other nations are included, so it is clear that the results in model 4 were not driven by English and Welsh MPs alone.
17. These findings are robust for two different dependent variables, individual vote choice and a constructed democratic proportion, as well as to the type of regression model used. They are also robust to various different specifications, including testing of each type of material interest separately so as to avoid collinearity masking significance; they also remain accurate when the 1866 votes are excluded, when Irish and Scottish MPs are included in the sample, or when fixed effects for each amendment are not included in the model. See online Appendix A4 for more details.
18. Since there is some (minor) collinearity between those who hold land, manu-facturing, and finance/trade interests, it is somewhat conceivable that manufacturing or finance/trade interests would have a significant effect if they were considered on their own in a model. However, this is not the case; neither manufacturing nor finance/trade interests have a significant effect on MP behavior—either by themselves or in interaction with party—even when the other ownership variables are excluded (see Table A4.1 in online Appendix A4).
19. This is true even for amendments under the Conservative cabinet in 1867; see Figure A1 in Appendix A1.
20. Acemoglu and Robinson (2000) also disregard the fact that Conservatives may simply have miscalculated, which likely also played a role.
to hear that the Chancellor of the Exchequer had embraced the proposition of the hon. Member for Newark with joy and gratitude, stating that it was in perfect accordance with the conclusions to which the Government had originally arrived, and that it was also in perfect harmony with what he still had the assurance to call the principle of the Bill” (HC Deb 20 May 1867, vol 187, cols 803–04). Later on, from the other side of the parliamentary aisle, Gladstone had a similar assessment, claiming that Disraeli’s “governing idea . . . seemed to be not so much to consider what ought to be proposed and carried, as to make sure that, whatever it was, it should be proposed and carried by those now in power” (quoted in Himmelfarb 1966, 110).
22. In the postestimation illustration of effects, a GLM model (model A7, Table A4.2) was used, as it makes more sense to consider predicted democratic proportions based on all 30 amendments than the predicted probability of going from an anti- to a pro-democratic vote on an arbitrarily chosen individual amendment.
23. For another illustration of the relative importance of party and landowning, see online Appendix A5 for a simulation.
24. The results here show that for the most part (for each party, in all but three amendments considered), the Liberal party line was pro-democratic while the Conserva-tive party line was antidemocratic. This means that it is conceivable that the results in the fourth section may be driven by differences between MPs in party discipline, regardless of the actual content of the bills. In order to distinguish between MPs who simply have a higher rate of defection overall, and those whose defection is dependent on the content of the amendment, I have further analyzed defections more closely, estimating the likelihood of MPs to defect depending on whether the amendment under consideration is pro- or antidemocratic. This analysis is available on request and shows that among Liberal MPs, landowners are significantlymorelikely to defect when the party line is pro-democratic and significantlylesslikely to defect when the party line is antidemocratic; that is, in both cases, they are more likely to vote for the less democratic option, in accordance with Hypothesis 3. By contrast, Liberal MPs with manufacturing or finance and trade interests do not appear to defect significantly differently from those without such interests, meaning that Hypoth-eses 2a and 2b lack empirical support. For Conservatives, neither owning land nor manufacturing or finance and trade interests made a difference to defection patterns, contrary to the expectations generated by Hypothesis 4.
25. In fact, this echoes arguments Wellington used to convince the House of Lords to support Corn Law Repeal in 1846; to get the reluctant landowning peers to support Peel’s bill, he threatened that if it failed, they would be faced with Cobden’s undoubtedly much more radical one (McLean 2001, 40, 44).
26. This was also made explicit by several MPs during the course of the parliamen-tary debate on this bill. Thus, the landowner Alexander Beresford Hope claimed that the 1867 bill would result in having to bid “farewell to the old halls rising over the tall trees, and the spacious deer parks, for the peasantry in their ignorance and cupidity would soon be set fancying that these broad acres would best serve their purpose if cut up into freehold allotments” (HC Deb 20 May 1867, vol 187, cols 812–13), while the Liberal Robert Lowe asked, “Do not you see that the first step after the enfranchisement of the unskilled labour class must necessarily be to turn indirect taxation into direct taxation, so assessed as to fall mainly upon the upper classes?” (HC Deb 20 May 1867, vol 187, cols 788–90).
28. A separate dummy was included in some analyses for university seats, which, however, did not affect many MPs.
29. The effect of boroughs is not always expected to be uniform; however, due to the fact that boroughs were a different category of constituency which was affected in a systematically different way by the bill, a dummy is seen as appropriate even though it may not catch all of the variation.
REFERENCES
Acemoglu, Daron, and James A. Robinson. 2000. “Why Did the West Extend the Fran-chise? Democracy, Inequality, and Growth in Historical Perspective.”Quarterly Journal of Economics115 (4): 1167–99.
Acemoglu, Daron, and James A. Robinson. 2006.Economic Origins of Dictatorship and Democracy. Cambridge: Cambridge University Press.
Ansell, Ben, and David Samuels. 2010. “Inequality and Democratization: A Contractarian Approach.”Comparative Political Studies43 (12): 1543–74. Ansolabehere, Stephen, James M. Snyder, Jr., and Charles Stewart III. 2001. “The Effects
of Party and Preferences on Congressional Roll-Call Voting.”Legislative Studies Quarterly26 (4): 533–72.
Bateman, John. [1883] 1971. The Great Landowners of Great Britain and Ireland. Leicester, UK: Leicester University Press.
Bendix, Reinhard. 1964.Nation-Building and Citizenship: Studies of Our Changing Social Order. New York: John Wiley.
Bermeo, Nancy. 2010. “Interests, Inequality, and Illusion in the Choice for Fair Elec-tions.”Comparative Political Studies43 (8–9): 1119–47.
Boix, Carles. 2003.Democracy and Redistribution. New York: Cambridge University Press.
Cacroft, Benjamin. 1867. “The Analysis of the House of Commons, or Indirect Repre-sentation.” InA Plea for Democracy: An Edited Selection from the 1867 Essays on Reform and Questions for a Revised Parliament, ed. W. L. Guttsman. London: MacGibbon & Kee.
Capoccia, Giovanni, and Daniel Ziblatt. 2010. “The Historical Turn in Democratization Studies.”Comparative Political Studies43 (8–9): 931–68.
Carrubba, Clifford J., Matthew Gabel, Lacey Murrah, Ryan Clough, Elizabeth Montgomery, and Rebecca Schambach. 2006. “Off the Record: Unrecorded Leg-islative Votes, Selection Bias and Roll-Call Vote Analysis.” British Journal of Political Science36 (4): 691–704.
Close, David H. 1977. “The Collapse of Resistance to Democracy: Conservatives, Adult Suffrage, and Second Chamber Reform, 1911–1928.”Historical Journal20 (4): 893–918.
Collier, Ruth Berins. 1999.Paths toward Democracy: The Working Class and Elites in Western Europe and South America. Cambridge: Cambridge University Press. Cowling, Maurice. 1967.1867—Disraeli, Gladstone and Revolution: The Passing of the
Second Reform Bill. Cambridge: Cambridge University Press.
Craig, Fred W. S. 1977.British Parliamentary Election Results, 1832–1885. London: Macmillan.
Derry, John W. 1966.Parliamentary Reform. London: Macmillan.
Evans, Paul. 2002.Handbook of House of Commons Procedure. 3d ed. London: Vacher Dod.
Firth, David, and Arthur Spirling. 2003. “Divisions of the United Kingdom House of Commons, from 1992 to 2003 and Beyond.” Working Paper, Nuffield College, University of Oxford.
Freeman, John R., and Dennis P. Quinn. 2012. “The Economic Origins of Democracy Reconsidered.”American Political Science Review106 (1): 58–80.
Guttsman, W. L. 1963.The British Political Elite.London: MacGibbon & Kee. Hall, Catherine, Keith McClelland, and Jane Rendall. 2000. Defining the Victorian
Nation: Class, Race, Gender and the British Reform Act of 1867. Cambridge: Cambridge University Press.
HC Deb 31 May 1866, vol 183, col 1554. HC Deb 9 May 1867, vol 187, col 280. HC Deb 20 May 1867, vol 187, cols 788–813. HC Deb 15 July 1867, vol 188, col 1539.
Heckelman, Jac C., and Keith Dougherty. 2013. “A Spatial Analysis of Delegate Voting at the Constitutional Convention.”Journal of Economic History73 (2): 407–44. Himmelfarb, Gertrude. 1966. “The Politics of Democracy: The English Reform Act of
1867.”Journal of British Studies6 (1): 97–138.
Leeman, Lucas, and Isabela Mares. 2011. “From ‘Open Secrets’ to the Secret Ballot: The Economic and Political Determinants of Secret Ballot Reform.” Working paper, Columbia University.
Lizzeri, Alessandro, and Nicola Persico. 2004. “Why did the Elites Extend the Suffrage? Democracy and the Scope of Government, with an Application to Britain’s ‘Age of Reform’.”Quarterly Journal of Economics119 (2): 707–65.
Llavador, Humberto, and Robert J. Oxoby. 2005. “Partisan Competition, Growth, and the Franchise.”Quarterly Journal of Economics120 (3): 1155–89.
Mair, Robert Henry. 1868.Debrett’s Illustrated House of Commons and the Judicial Bench. London: Letts.
May, Thomas Erskine. 1855 (3d ed.). A Practical Treatise on the Law, Privileges, Proceedings, and Usage of Parliament. London: Butterworths.
McLean, Iain. 2001.Rational Choice and British Politics. Oxford: Oxford University Press.
Meltzer, Allan H., and Scott F. Richard. 1978. “Why Government Grows (and Grows) in a Democracy.”Public Interest52: 111–18.
Moser, Scott, and Andrew Reeves. 2014. “Taking the Leap: Voting, Rhetoric, and the Determinants of Electoral Reform.”Legislative Studies Quarterly39: 467–502. Przeworski, Adam. 2008. “Conquered or Granted? A History of Suffrage Extensions.”
British Journal of Political Science39 (2): 291–321.
Robinson, W. S. 1950. “Ecological Correlations and the Behavior of Individuals.” Ameri-can Sociological Review15 (3): 351–57.
Schonhardt-Bailey, Cheryl. 2003. “Ideology, Party and Interests in the British Parliament of 1841–47.”British Journal of Political Science33 (4): 581–605.
Seymour, Charles. [1915] 1970.Electoral Reform in England and Wales: The Develop-ment and Operation of the ParliaDevelop-mentary Franchise, 1832–1885. Newton Abbot, UK: David & Charles.
Smith, F. B. 1966. The Making of the Second Reform Bill. Cambridge: Cambridge University Press.
Spirling, Arthur, and Kevin Quinn. 2010. “Identifying Intraparty Voting Blocs in the UK House of Commons.”Journal of the American Statistical Association105 (490): 447–57.
Stenton, Michael. 1976.Who’s Who of British Members of Parliament, Vol. 1. 1832– 1885: A Biographical Dictionary of the House of Commons Based on Annual
Volumes of Dod’s Parliamentary Companion and Other Sources. London:
Harvester Press.
Stenton, Michael, and Stephen Lees. 1978.Who’s Who of British Members of Parliament, Vol. 2. 1886–1918: A Biographical Dictionary of the House of Commons Based on Annual Volumes of Dod’s Parliamentary Companion and Other Sources. London: Harvester Press.
Thomas, J. A. 1925. “The House of Commons, 1832–1867: A Functional Analysis.”
Economica13: 49–61.
Walker, Brian Mercer. 1978. Parliamentary Election Results in Ireland, 1801–1922. Dublin: Royal Irish Academy.
Ziblatt, Daniel. 2008. “Does Landholding Inequality Block Democratization? A Test of the ‘Bread and Democracy’Thesis and the Case of Prussia.”World Politics60 (4): 610–41.
Supporting Information
Additional Supporting Information may be found in the online version of this article at the publisher’s website:
Table A4.1. The Impact of Separated Party-Mediated Material Interests on Democratic Vote
Table A4.2. Robustness Check: Different Model Types Used to Predict Pro-Democratic Vote