Whole Body Locomotion Planning of Humanoid Robots
based on a 3D Grid Map
Fumio Kanehiro Takashi Yoshimi Shuuji Kajita Mitsuharu Morisawa
Kiyoshi Fujiwara Kensuke Harada Kenji Kaneko Hirohisa Hirukawa Fumiaki Tomita
National Institute of Advanced Industrial Science and Technology(AIST)Tsukuba Central 2, 1-1-1 Umezono, Tukuba, Ibaraki, 305-8568 JAPAN
{f-kanehiro, tak-yoshimi, s.kajita, m.morisawa,
k-fujiwara, kensuke.harada, k.kaneko, hiro.hirukawa, f.tomita}@aist.go.jp
Abstract— This paper proposes a method for a humanoid robot to generate 3D model of the environment using a stereo vision, find a movable space using it and plan feasible locomotion online. The model is generated by an accumulation of 3D grid maps which are made from the range data of the field of view obtained by a correlation based stereo vision. The locomotion is planned by an online whole body pattern generator which can modify robot’s waist height, an upper body posture and so on according to the size of the movable space.
Index Terms— Humanoid Robot, Stereo Vision, 3D Grid Map, Whole Body Locomotion
I. INTRODUCTION
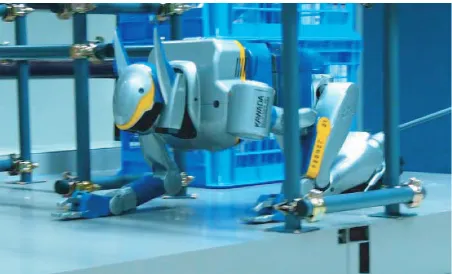
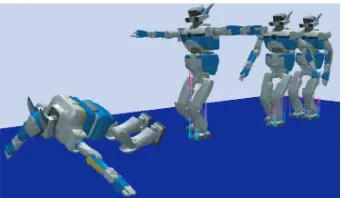
One of advantages of a humanoid robot as a mobile robot is that it can move around in 3D space. It can climb up/down stairs and a ladder, crawl(Fig.1) and so on in addition to an ordinary biped walking on the flat floor. To make full use of the advantage, the robot must be able to observe the environment in 3D and plan feasible locomotion according to the observation result.
There are so many researches on an environmental map generation mainly for wheeled robots. However most of them intended 2D map because of a movable space re-striction of wheeled robots. ASIMO[1] can climb up/down stairs but a step height and a depth are given beforehand. Several humanoid robots can detect a flat floor and plan landing positions, but their locomotion is in 2D.
This paper proposes a method for a humanoid robot to generate 3D model of the environment using a stereo vision, find a movable space using it and plan feasible loco-motion online. The model is generated by an accumulation of 3D grid maps which are made from the range data of the field of view obtained by a correlation based stereo vision. The locomotion is planned by an online whole body pattern generator which can modify robot’s waist height, an upper body posture and so on according to the size of the movable space.
This paper is organized as follows. Section 2 surveys related works. Section 3 describes how to make a 3D model of the environment using a stereo vision. Section 4 explains how a humanoid robot finds a movable space using the 3D model and plans feasible locomotion online. Section 5 presents a simulation in which a humanoid robot passes through narrow spaces using the proposed method. Section 6 concludes the paper.
Fig. 1. Crawling locomotion to pass through narrow spaces
II. RELATED WORKS
There are so many researches on an environmental map generation mainly for wheeled robots. A laser range finder, a camera or their combination are used for mapping. And there are several kinds of map representation, i.e. grid, raw measured points [2], [3], a set of edges[4], a set of planes[5], [6] and so on.
Several humanoids are already able to control walking based on visual information. QRIO[7] from SONY gener-ates range data by a correlation based stereo vision, finds a ground plane using Hough transformation, updates a occupancy grid and plans a walking trajectory. Okada et al. also developed a ground plane finder based on Hough transformation and called itplane segment finder[8]. Using it a movable space is extracted and a walking trajectory is planned[9]. Kagami et al. assign the height of an obstacle to grids of 2D map which is generated by a correlation based stereo vision and call it 2.5D model[10]. Using the map, a humanoid robot H7[11] chases a target object while avoiding obstacles. Loach et al. developed a robot which detects obstacles by a segment based stereo vision and its motion is selected from stepping over or avoiding according to the size of the obstacle[12], [13].
These humanoid robots mainly observe the ground and plan landing positions for biped walking. Therefore the required map representation is 2D for avoiding obstacles and 2.5D for stepping over. However to pass through
Proceedings of the 2005 IEEE
Fig. 2. Sample environment including narrow spaces
Fig. 3. Limitation of locomotion planning based on the only one image
narrow spaces or duck under an obstacle, 3D information is required. There are several researches which plans lo-comotion under the assumption that all the environment is known[14], [15]. But there are a few researches on a locomotion planning based on observed information. Probably this is because a 3D map demands large amount of memory and computing power and 3D information is not required by wheeled robots.
Fujimoto et al. developed a locomotion selector which select locomotion according to the size of gates. Its size is detected by Hough transformation of range data[16]. Authors proposed a locomotion planning method to pass through narrow spaces in an environment like one in Fig.2. Using this method, a humanoid can pass through these gates using visual information[17]. In the method, a 3D polygon model of the environment is generated from the images and an appropriate locomotion style is selected by checking collision between the model and bounding boxes corresponds to styles(side stepping, crawling and so on) which are prepared in advance. However this method had following problems.
1) Wide space must be included in the field of view. Because a selection is done based on an environmental model generated from a set of images. So the selection must be done at the position far from an obstacle like one in Fig.3.
2) Since a built map is not memorized, a robot can not recognize an existence of an obstacle in the case shown in Fig.3.
3) If a wrong result of the image processing is included in the model, for instance, because of noise, an improper locomotion may be selected.
4) A locomotion style is selected from a pre-defined list and they are switched discretely. Therefore, in some cases, it takes long time to switch styles and a robot gets down its waist more than necessary.
To solve these problems, the planning must be based not on only a set of image but on an environmental map which is accumulated and memorized and a robot motion must be generated online according to the map. So this
CCD Camera
144[mm]
70[mm]
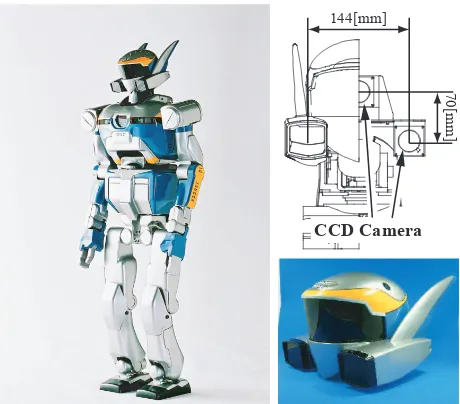
Fig. 4. The exterior of HRP-2 and a camera system
paper proposes a method for a humanoid robot to generate 3D model of the environment using a stereo vision, find a movable space using it and plan feasible locomotion online.
III. 3DGRID MAP GENERATION A. Humanoid robot HRP-2 and its vision system
Figure 4(left) shows a humanoid robot 2[18]. HRP-2 was developed in HRP(Humanoid Robotics Project)[19]. It has comparable size as a human, 154[cm] height and 58[kg] weight.
HRP-2 has a stereo vision system composed of three cameras(Fig.4 upper right). Two horizontal cameras are separated by 144[mm], and the third camera is 70[mm] up-per than them. Three cameras system is adopted since it is difficult to detect the lines parallel to the epipolar line for a stereo vision system composed of two cameras . Relatively short focus lens is used whose standoff is from 0.5[m] to 4[m]. The shutter speed of the camera is controllable by a computer to adapt various lighting condition. The image processing is based on VVV System[20]. VVV consists of several image processing modules, 3D shape model reconstruction, an object recognition, an object tracking and so on.
Through a plastic shield in front of the cameras(Fig.4 lower right), the object image is distorted. It is practically difficult to model the shield shape and the position of the camera precisely. So a conversion table between a distorted image and an image without the shield is made using a calibration board. Lens distortion is also corrected using the same method. As a result, the distortion is reduced within 0.2 pixel.
B. Range data generation
HRP-2 uses a stereo vision system with correlation method to obtain 3D information of the environments.
of Absolute Difference) to estimate difference between intensities in the corresponding windows. The SAD value is calculated as where S is an SAD value of address(x, y)with disparity d,wis half window size, andIL andIR is the intensity of address (x, y) of left and right cameras respectively. The disparity Dmin(x, y) that gives the minimum SAD value is the result forIL(x, y).
We added new features for improving measurement resolution and for noise reduction as follows.
1) Disparity Interpolation: To improve measurement resolution of distance, we introduce interpolation of the disparity with quadric fitting to around the minimum value. With this application, each disparity can be obtained by sub-pixel value, and the surface of objects can be obtained more smoothly.
2) Competitive Filter: When pixels more than one in the left image correspond one pixel of the right image, ones except the best one should be wrong correspondences and can be noisy result. Such case occurs when no correspond-ing point of a point in the left image exists in the right image.
The competitive filter extract such cases and leaves the best one. For each scan line, a series of cells BR(x) is prepared. Each cell has entries forxandS.
When a correspondence is calculated, BR(x +
Dmin(x, y)) holds the address of the pixel of left image
x, and the minimum value of SADS(x, y, Dmin(x, y)). If the cell already has values for the previous correspondence, the new SAD is compared with the previous one, and the better (smaller) correspondence is stored. As the scan line is completed,Dmin(x, y)are calculated for all storedBR values.
3) Sharpness Filter: Sharpness is defined by estimating the difference of intensity around the minimum SAD disparity. The sharpnessSharpis defined as:
Sharp(x, y) = 1− S(x,y,DS(x, y, Dmin) min−1)+S(x,y,Dmin+1)
2
. (2)
When Sharp(x, y) is smaller than the given threshold Sharpthd, the result is eliminated.
4) Minimum SAD Filter: WhenS(x, y, Dmin)is larger than the given threshold, the result is eliminated.
5) Texture Mask Filter: When the space where texture is not identical, in other words, variation of intensity is small, the result of correlation method is not reliable. A mask image of low space frequency is generated and the results where the flags are ON are eliminated.
6) Limit Filter: Let the range of disparity is [dmin, dmax]. Even if the SAD value atdmin or dmax is the minimum, it is not guaranteed that it is also a local minimum. For example, the resultdmin suggests the true value is much smaller. This filter eliminatesdminanddmax results.
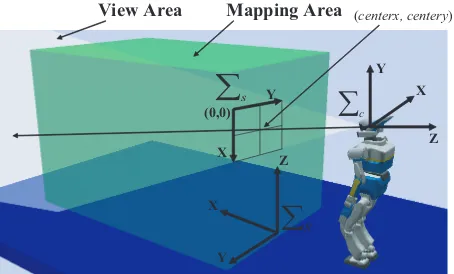
(centerx, centery)
X Y
∑
sFig. 5. Definitions of coordinates
7) Spike Filter: A wrong correspondence may result a small space far from neighboring correct space. This filter eliminates the space smaller than given space size Spikearea and surrounded by disparity difference larger than given threshold Spikethd.
C. 3D grid map
The most serious problem in describing the environment in 3D is that it consumes a large amount of memory and computing power. With the advance of computer technol-ogy, this restriction is relaxed in some degree. However it is still a serious problem for self-contained robots because of its size and weight limitation. HRP-2 has two PCs with PentiumIII 1.26[GHz] and Memory 512[MB]. They used for a motion control and an image processing.
The simplest way to make a 3D map from range data can be using raw points as it is or making polygons by connecting those points. However, there are several issues in these ways. When simply accumulating maps, its amount of consumed memory increases. Therefore, some kind of an integration method is required. In addition, polygons equal to an obstacle, but it is difficult to distinguish a vacant space and a hidden space. From these reasons, in this paper, a 3D grid map is used as an environmental representation. In the case of a grid map, the amount of consumed memory is constant. If its resolution is very small, it demands large amount of resources. But in this case, the map is built to find a movable space and a high resolution required for an object recognition is not required. So the resolution can be set to somewhat large.
The 3D grid map is generated as follows. Coordinates and other parameters which are used in a following expla-nation are defined in Fig.5.
1) Label all the grids asOutOfView which means that a grid is not observed yet.
2) Generate range data.
3) Convert a grid coordinate gR in a map coordinate
row=−xf
z +centerx, (4)
where f is a focal length and (centerx, centery) is a point at the intersection of a line of sight with a screen.
5) If gS is within the screen, a following procedure is executed.
a) If a 3D coordinate for gS is calculated, Z coordi-nate of it and z are compared and gR is labeled
according to its result.
i) If an absolute difference of them is smaller than a grid resolution, the grid is occupied by an obstacle. So it is labeled as Occupied.
ii) Ifzis larger, the grid is vacant. So it is labeled as Vacant.
iii) Ifzis smaller, the grid is hidden by an obstacle. So it is labeled asHidden.
b) If a 3D coordinate is not calculated, the grid is labeled asUnknown.
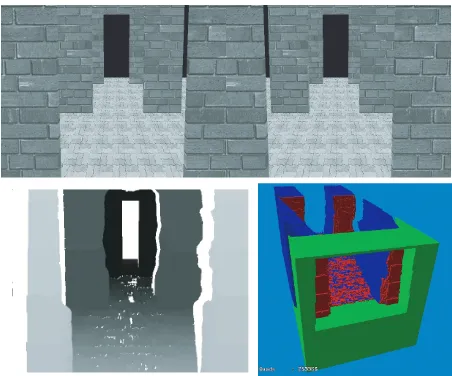
Figure 6 shows a generation example of the 3D grid map. Upper row is input images at the situation in Fig.2. Lower left one is a disparity image and lower right one is a 3D grid map. The input images are generated by a humanoid software platform OpenHRP[23] and their size is 616×472[pixel]. In the disparity image, the light part means near and the dark part does far. The window size w for correlation is 15 and a range calculation space is between 1[m] to 10[m] in front. Spikearea is set to 300 and Spikethd 5. Red(or dark) cubes in the 3D grid map corresponds to grids which labeled asOccupied, green(or light) as OutOfView, blue as Hidden respectively and a grid resolution is 2[cm]. Unknown grids are hidden for viewability. The mapping space is from 2.5[m] to 7.5[m] in depth direction, 2[m] in width and 2[m] in height from 0.5[m] under the floor. Under these settings, it takes 1.3[s] to generate the map since images are captured on a PC which has Pentium4 3.06[GHz]×2. In this case, the number of grid is(2.0
0.02+ 1)×( 2.0
0.02+ 1)×( 5.0
0.02+ 1) = 2560451, and 4[byte] is assigned for each grid. As a result, about 10[MB] memory is consumed by this map.
D. Map accumulation
In the previous section, a method is explained to make a map from a set of images. However, to accumulate maps an accumulation method is required. The map accumulation is done by changing a part of the map generating method 5) as follows. A generation and an accumulation is done at the same time.
a) If a 3D coordinate forgS is calculated, Z coordinate of it andz are compared and gR is labeled according to its result.
i) If the absolute difference of them is smaller than a grid resolution, the grid is labeled as Observed which means that the grid is observed and a counter CN To which means that the grid is occupied is incremented.
Fig. 6. Example of 3D grid map generation(upper row:input images, lower left:disparity image, lower right:3D grid map)
ii) Ifzis larger, the grid is labeled asObserved, and a counterCN Tvwhich means that the grid is vacant is incremented.
iii) Ifzis smaller and its label is neitherObservednor Unknown, the grid is labeled asHidden.
b) If a 3D coordinate is not calculated and its label is not Observed, the grid is labeled asUnknown.
After these procedures, a probability p(gR)that a grid
gR which is labeled asObservedis occupied is calculated by,
p(gR) = CN To
CN To+CN Tv
×100. (5)
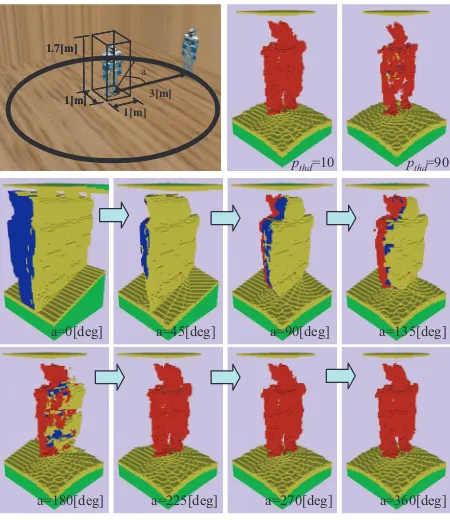
Whether a grid is occupied or not is determined by comparing p(gR) with a threshold pthd. Introducing this probabilistic method, wrong results caused by a matching error of correlation or a measurement error can be erased. Figure 7 shows an example of the map accumulation. In this example, HRP-2 walks around another HRP-2. Its radius is 3[m] and the map is accumulated at ev-ery 15[deg] rotation. The size of a mapping space is 1[m]×1[m]×1.7[m](width×depth×height) around HRP-2. Upper left one is a simulation world, lower rows show 3D grid maps while walking at every 45[deg]. In these maps, a yellow(or light) space meansUnknowngrids andpthdis set to 50[%]. Upper right maps are generated by setting pthd to 10[%] and 90[%] respectively. In the case pthd is set to high probability, a detected object is expanded slightly than an actual object and in the case to low probability, it is shrunk. An optimal value of pthd should be decided by evaluating the modeling error, but in this paper it is decided a priori.
IV. LOCOMOTION PLANNING A. Biped locomotion
a=0[deg] a=45[deg] a=90[deg] a=135[deg]
a=180[deg] a=225[deg] a=270[deg] a=360[deg]
3[m]
Fig. 7. Example of 3D grid map accumulation(upper left:world setup, upper right:accumulated 3D grid map for differentpthd, lower
rows:snapshots while HRP-2 walks around another HRP-2)
pattern with a specified heightzc of the center of the mass of the robot, i.e.
¨
where(x, y)denotes the trajectory of the center of the mass projected on the horizontal plane,gthe gravity acceleration and (px, py) that of the ZMP. This pattern generator can generates not only an ordinary walking by settingzc to a constant, but also ducking under an obstacle by changing zc at every step.
Figure 8 shows the structure of a whole body pattern generator. A part of biped pattern generator inputs step information which consists of a waist height zc, pos-ture/attitude of the next step, duration of a single leg support phase and that of a double leg support phase and generates trajectories of waist and feet in the world coordinate system and ZMP in waist coordinate system based on Eq.6 and 7. This generator regards a robot as a single mass point and generates patterns. Its coordinate is determined by calculating the center of the massciat the initial postureqi. Therefore, if the robot twists its waist to pass through narrow spaces, its center of the mass deviates and its walking becomes unstable. In the cases inertial force cased by the upper body motion is not so large, a stable walking pattern can be generated by translating its waist in the horizontal plane according to the error of the center of the mass. Let c is the center of the mass at a posture
which is made by replacing an upper body posture of the initial posture qi by required one qu,cerr is a difference
+
Fig. 8. Block diagram of whole body pattern generator
-0.1
Fig. 9. Upper:deviation of the center of the mass, middle:inclination around roll axis, lower:inclination around pitch axis
between ci and c. cerr is used to modify a waist and ZMP trajectories(note Z element ofcerris ignored). Lower body postureqlis calculated using modified waist and feet trajectories, and whole body postureqis generated merging ql andqu.
Figures 9 and 10 shows simulation results with and without this center of the mass compensation. In this example, a robot walks forward 3[m]. 3[s] after starting walking, it stretches its right arm forward and left arm leftward taking 5[s]. Figure 9(upper row) shows cerr caused by this motion. c deviates about 2[cm] forward
and leftward. Figure 10 shows snapshots taken every 5[s] in the case of without compensation. It can walks with swinging its upper body by the contribution of a walking stabilizing controller. But it falls down at the same time with stopping. Figure 9(middle and lower row) compares body inclinations around roll and pitch axes in cases of with and without compensation. In the case of without compensation, the body inclines forward and leftward and with the compensation they are suppressed.
Fig. 10. Snapshots of simulation result without compensation
Hc
θ
H
l
θ
D qn
Fig. 11. Parameter definition for view direction control
in the space which is observed many times. This space is called a walking planning space. A walking at low waist height has heavy load on knee joints and a step width is limited by the limitation of joint movable ranges. So the waist height should be high if possible. And at first, the height of a movable space in the walking planning space at the minimum walking width is found and the minimum rate of waist height change is selected. Using it with the step width, the next waist height is calculated and the next step width is updated. And then the maximum width at the height is found and the walking width is decided by the same method. From the width, the upper body posture is decided by twisting waist and folding arms.
In order to observe the environment in a wide range, a view direction is controlled according to a waist height. Let a vertical field of view is θ, robot’s height in a standard walking posture H, a camera height in a current posture Hc, a distance from a robot which is required to get a wide field of view that covers H in height D, a looking down angle from horizontal line qn, an angle between a horizontal line and lower limit of a field of view θl(see Fig.11).
Between these parameters, there are relations described by,
tanθl=
Hc
D, tan(θ−θl) =
H−Hc
D . (8) From these equations,tanθl can be calculated by,
tanθl=
−H+
H2+ 4H
c(H−Hc)tanθ2 2(H−Hc)tanθ
, (9)
where θl is calculated by this formula and qn is found by,
qn=θl−
θ
2. (10)
Fig. 12. Simulation setup and Generated 3D grid map
Here qn is applied to a neck joint around pitch axis. In the case of HRP-2, H is 1.5[m] andθ is 25.4[deg]. IfHc is set to 1.2[m], 3.3[m] is required to determine whether a robot can walk through at a standard posture.
V. SIMULATION
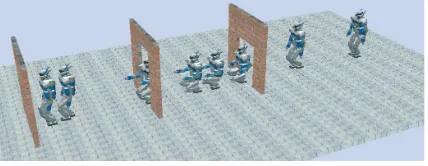
The validity of a proposed method is examined by a simulation. Figure 12 shows simulation world(upper) and a 3D grid map after the simulation(lower). A robot walks forward while changing its waist height, an upper body posture and so on according to a situation until it can’t pass through the environment. There are three board like obstacles on its walking path. A distance between obstacles is 3[m] and one between the robot and the first obstacle is 4[m]. The size of obstacles is 2[m]×2[m] and the size of their openings are 1.0[m]×1.2[m](the nearest one) and 0.8[m]×1.6[m](width×height). The size of a standard walking posture of HRP-2 is 0.75[m]×1.5[m]. Therefore, to pass through these obstacles, it must get down its waist at the first obstacle and narrow its width by twisting waist at the second obstacle. In the simulation, it is given that there is no obstacle in the space from robot’s position to 3.5[m] forward a priori. A 3D grid map is allocated for the space, its depth is 7[m] from 3.5[m] in front of the robot, the width is 2[m], height is 1.5[m]. The grid size is set to 2[cm]. A map accumulation is done only in the space in front of the robot from 2[m] to 4[m] and pthdis set to 80[%]. Because an accuracy of range data becomes worse in a far space. A step planning space is between robot’s position and 1[m] forward.
Figure 13 shows the width and height of a movable space(red line) which is found using a 3D grid map and width and height of the robot motion(green points). Green points correspond to each step information. Distances be-tween those points are not constant because a step width is modified according to the waist height. boxes(blue) mean the space that obstacles exist actually.
Figure 14 shows snapshots while a simulation at every 9[s].
0.6
Fig. 13. Width and height of the environment and HRP-2
Fig. 14. Snapshots of the passing gates simulation
VI. CONCLUSIONS
This paper proposed a method for a humanoid robot to generate a 3D model of the environment using a stereo vision and plan feasible locomotion online and its validity is confirmed by a simulation. The proposed method is summarized as follows.
• The range data for the field of view is generated by a correlation based stereo vision and they are accumulated as a 3D grid map.
• Using a biped pattern generator which can change a waist height and a compensator of the center of the mass derivation, it became possible to generates a feasible whole body motion pattern according to the size of the movable space.
The future works includes a map accumulation method considering locomotion error.
REFERENCES
[1] M. Hirose, Y. Haikawa, T. Takenaka, and K. Hirai. Development of Humanoid Robot ASIMO. InInt. Conference on Itelligent Robots and Systems, Workshop2, 2001.
[2] F. Lu and E. Milios. Globally consistent range scan alignment for environment mapping. Autonomous Robots, Vol. 4, pp. 333–349, 1997.
[3] J.S.Gutmann and K.Konolige. Incremental Mapping of Large Cyclic Environments. In Proceedings of the Conference on Intelligent Robots and Applications(CIRA), 1999.
[4] Raja Chatila and Jean-Paul Laumond. Position referencing and consistent world modeling for mobile robots. InProc. of the 1985 IEEE International Conference on Robotics & Automation, 1985. [5] L.Iocchi, K.Konolige, and M.Bajracharya. Visually Realistic
Map-ping of a Planar Environment with Stereo. InProceedings of the 7th International Symposium on Experimental Robotics, 2000. [6] Christian Martin and Sebastian Thrun. Real-Time Acquisition of
Compact Volumetric 3D Maps with Mobile Robots. InProc. of the 2002 IEEE International Conference on Robotics & Automation, pp. 311–316, 2002.
[7] Yoshihiro Kuroki, Masahiro Fujita, Tatsuzo Ishida, Ken’ichiro Na-gasaka, and Jin’ichi Yamaguchi. A Small Biped Entertainment Robot Exploring Attractive Applications. InProc. of the 2003 IEEE International Conference on Robotics & Automation, pp. 471–476, 2003.
[8] K.Okada, S.Kagami, M.Inaba, and H.Inoue. Plane segment finder: Algorithm, implementation and applications. InProc. of the 2001 IEEE International Conference on Robotics & Automation, pp. 2120–2125, 2001.
[9] Kei Okada, Masayuki Inaba, and Hirochika Inoue. Walking Navi-gation System of Humanoid Robot using Stereo Vision based Floor Recognition and Path Planning with Multi-Layered Body Image. InProc. of the IEEE/RSJ International Conference on Intelligent Robotics and Systems (IROS’03), pp. 2155–2160, 2003.
[10] Satoshi Kagami, Koichi Nishiwaki, James J. Kuffner, Kei Okada, Masayuki Inaba, and Hirochika Inoue. Vision-based 2.5D terrain modeling for humanoid locomotion. InProc. of the 2003 IEEE International Conference on Robotics & Automation, pp. 2141– 2146, 2003.
[11] Satoshi Kagami, Koichi Nishiwaki, James Kuffner Jr., Yasuo Ku-niyoshi, Masayuki Inaba, and Hirochika Inoue. Design and Imple-mentation of Software Research Platform for Humanoid Robots:H7. InProc. of the IEEE-RAS International Conference on Humanoid Robots, pp. 253–258, 2001.
[12] Oliver Lorch, Amos Albert, Joachim Denk, Marc Gerecke, Robert Cupec, Javier F. Seara, Wilfried Gerth, and G¨unther Shmidt. Ex-periments in Vision-Guided Biped Walking. In Proc. of the IEEE/RSJ International Conference on Intelligent Robotics and Systems (IROS’02), pp. 2484–2490, 2002.
[13] Javier F. Seara, Klaus H. Strobl, and G¨unther Schmidt. Information Management for Gaze Control in Vision Guided Biped Walking. InProc. of the IEEE/RSJ International Conference on Intelligent Robotics and Systems (IROS’02), pp. 31–36, 2002.
[14] Zvi Shiller, Katsu Yamane, and Yoshihiko Nakamura. Planning Motion Patterns of Human Figures Using a Multi-layered Grid and the Dynamics Filter. InProc. of the 2001 IEEE International Conference on Robotics & Automation, pp. 1–8, 2001.
[15] Tsai-Yen Li and Pei-Zhi Huang. Planning Humanoid Motions with Striding Ability in a Virutual Environment. InProc. of the 2004 IEEE International Conference on Robotics & Automation, pp. 3195–3200, 2004.
[16] Takashi FUJIMOTO, Koichi NISHIWAKI, Satoshi KAGAMI, Masayuki INABA, and Hirochika INOUE. Generation Method of Locomotion in Narrow Space for Humanoid Robots. In JSME Annual Conference on Robotics and Mechatronics(ROBOMEC ’03), pp. 2P2–1F–F3, 2003.
[17] Fumio Kanehiro, Hirohisa Hirukawa, Kenji Kaneko, Shuuji Kajita, Kiyoshi Fujiwara, Kensuke Harada, and Kazuhito Yokoi. Locomo-tion Planning of Humanoid Robots to Pass through Narrow Spaces. InProc. of the 2004 IEEE International Conference on Robotics & Automation, pp. 604–609, 2004.
[18] Kenji KANEKO, Fumio KANEHIRO, Shuuji KAJITA, Masaru HIRATA, Kazuhiko AKACHI, and Takakatsu ISOZUMI. Humanoid Robot HRP-2. InProc. of the 2004 IEEE International Conference on Robotics & Automation, pp. 1083–1090, 2004.
[19] Hirochika Inoue, Susumu Tachi, Yoshihiko Nakamura, N.Ohyu, Shi-geoki Hirai, Kazuo Tanie, Kazuhito Yokoi, and Hirohisa Hirukawa. Overview of Humanoid Robotics Project of METI. InProc. of the 32nd ISR, 2001.
[20] Fumiaki Tomita, Takashi Yoshimi, Toshio Ueshiba, Yoshihiro Kawai, Yasushi Sumi, Toshio Matsushita, Naoyuki Ichimura, Kazuhide Sugimotio, and Yutaka Ishiyama. R&D of Versatile 3D Vision System. InProc. IEEE Int’l Conf. on SMC’98, pp. 4510– 4516, 1998.
[21] S.Kagami, K.Okada, M.Inaba, and H.Inoue. Design and Imple-mentation of Onbody Real-time Depthmap Generation System. In
Proc. of the 2000 IEEE International Conference on Robotics & Automation, pp. 1441–1446, 2000.
[22] O.Faugeras, B.Hots, H.Mathieu, T.Vi´eville, Z.Zhang, P.Fua, E.Th´eron, L.Moll, G.Berry, J.Vuillemin, P.Bertin, and C.Proy. Real Time Correlation-Based Stereo: Algorithm, Implementation and Applications. InTechnical Report N ˚ 2013, INRIA, 1993. [23] Fumio Kanehiro, Hirohisa Hirukawa, and Shuuji Kajita. OpenHRP:
Open Architecture Humanoid Robotics Platform.The International Journal of Robotics Research, Vol. 23, No. 2, pp. 155–165, 2004. [24] Shuuji KAJITA, Fumio KANEHIRO, Kenji KANEKO, Kiyoshi