PAPER • OPEN ACCESS
The Detection and Quantification of Adulteration in
Ground Roasted Asian Palm Civet Coffee Using
Near-Infrared Spectroscopy in Tandem with
Chemometrics
To cite this article: D Suhandy et al 2018 IOP Conf. Ser.: Earth Environ. Sci.147 012011
View the article online for updates and enhancements.
Related content
Indonesian palm civet coffee discrimination using UV-visible spectroscopy and several chemometrics methodsM Yulia and D Suhandy
-Discrimination of several Indonesian specialty coffees using Fluorescence Spectroscopy combined with SIMCA method
D Suhandy and M Yulia
-Physical Land Suitability for Civet Arabica Coffee: Case Study of Bandung and West Bandung Regencies, Indonesia
E Chairani, J Supriatna, R Koestoer et al.
The Detection and Quantification of Adulteration in Ground
Roasted Asian Palm Civet Coffee Using Near-Infrared
Spectroscopy in Tandem with Chemometrics
D Suhandy1, M Yulia2, Y Ogawa3 and N Kondo3
1 Department of Agricultural Engineering, The University of Lampung, Indonesia.
2 Department of Agricultural Technology, Lampung State Polytechnic, Indonesia
3 Laboratory of Bio-Sensing Engineering, Kyoto University, Japan.
E-mail: [email protected]
Abstract. In the present research, an evaluation of using near infrared (NIR) spectroscopy in tandem with full spectrum partial least squares (FS-PLS) regression for quantification of degree of adulteration in civet coffee was conducted. A number of 126 ground roasted coffee samples with degree of adulteration 0-51% were prepared. Spectral data were acquired using a NIR spectrometer equipped with an integrating sphere for diffuse reflectance measurement in the range of 1300-2500 nm. The samples were divided into two groups calibration sample set (84 samples) and prediction sample set (42 samples). The calibration model was developed on original spectra using FS-PLS regression with full-cross validation method. The calibration model exhibited the determination coefficient R2=0.96 for calibration and R2=0.92 for validation. The prediction resulted in low root mean square error of prediction (RMSEP) (4.67%) and high ratio prediction to deviation (RPD) (3.75). In conclusion, the degree of adulteration in civet coffee have been quantified successfully by using NIR spectroscopy and FS-PLS regression in a non-destructive, economical, precise, and highly sensitive method, which uses very simple sample preparation.
1. Introduction
Coffee is one of the most popular beverages in the world [1]. Coffee can be regarded as a large global commodity which has one of the greatest socio-economic impacts when compared with the different activities involved in the agricultural trade [2]. Recent data shows that global coffee exports amounted to 9.13 million bags in October 2016, with 0.9% estimated increase in global coffee production in 2015/2016 as compared to 2014/2015 [3].
Up to now, coffee has approximately 70 species [4]. However, in term of popularity and profitability, the two most important species grown in the world are Arabica (Coffea arabica) and Robusta (Coffea canephora). Arabica coffee accounts for approximately 64% of the world production, with the remaining 36% derived from Robusta coffee [5-6]. Another important type of coffee is luwak coffee or Asian palm civet coffee or kopi luwak (Indonesian words for coffee and palm civet) which is well known
as the world’s priciest and rarest coffee [7-8].
2
Several methods both in quantitative and qualitative analysis of civet coffee has been conducted such as using gas chromatography (GC) [9] and UV-Vis spectroscopy [8] with acceptable results. However, those techniques have several disadvantages such as time-consuming (need sample preparation such extraction), produce chemical waste, relatively expensive method and difficult for on-line measurement system.
On the other hand, another spectroscopic method based on vibrational techniques, such as NIR (near infrared) spectroscopy is particularly prone to the development of method that is fast, reliable, simple to implement and require no pretreatment of the sample. The use of NIR spectroscopy almost always requires its combination with multivariate chemometric tools, providing direct, non-destructive, and low-cost methods, with no consumption of reagents or solvents and in accordance with the principles of green chemistry. To the best of our knowledge, there is no reported studies so far on the use of NIR spectroscopy for quantification of degree of adulteration in civet coffee. Therefore, the objective of this research is to develop and evaluate a PLS calibration model for quantification of degree of adulteration in civet coffee.
2. Materials and methods
2.1. Samples
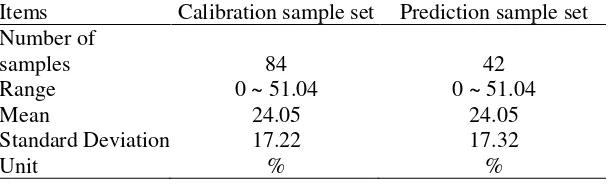
A number of 2 kg ground roasted civet and non-civet coffee samples were collected directly from coffee farmers at Liwa, Lampung, Indonesia. All samples were grinded using home-coffee-grinder (Sayota). Particle sizes were not uniform in the ground coffee powder. Since particle size in coffee powder has a significant influence on the spectra obtained [10], we sieved all coffee samples through a nest of U. S. standard sieves (mesh number of 40) on a Meinzer II sieve shaker (CSC Scientific Company, Inc. USA) for 10 minutes to obtain a particle size of 420 µm. These experiments were performed at room temperature (around 27-29°C). In this study, a total of 126 civet ground roasted coffee samples with different degree of adulteration (0-51%) were prepared for samples. The 126 datasets were randomly split into two subsets: calibration (84 samples) and prediction (42 samples) sets. Calibration set was used for developing PLS calibration model while prediction set was used to evaluate the performance of the developed PLS calibration model. Table 1 shows the characteristics of calibration and prediction sample sets.
Table 1. Characteristics of calibration and prediction sample sets.
Items Calibration sample set Prediction sample set Number of
samples 84 42
Range 0 ~ 51.04 0 ~ 51.04
Mean 24.05 24.05
Standard Deviation 17.22 17.32
Unit % %
2.2. Spectral acquisition
The NIR spectra were acquired using a V-670 UV-Visible-NIR Spectrophotometer (JASCO Co., Japan). This spectrometer was equipped with an integrating sphere beside detector (ISN-723, JASCO Co.) which is connected to the spectrometer by an optical fiber. The V-670 double-beam spectrometer utilizes a unique, single monochromator design covering a wavelength range from 190 to 2500 nm. This spectrometer has two detectors: A PMT detector is provided for the UV/VIS region and a Peltier-cooled PbS detector is employed for the NIR region. For light source, this spectrometer utilizes two types of lamps: Halogen lamp and Deuterium lamp.
the sample surface kept flat. Each spectrum was measured from 1300 to 2500 nm, with a bandwidth of 20.0 nm, and a scan speed of 1000 nm/min. All experiments were conducted at room temperature (around 20°C).
2.3. Multivariate analysis
Principal component analysis (PCA) was done before developing the partial least squares (PLS) calibration model in order to analyze the relevant and interpretable structure in the data [11]. The PLS regression was used to develop the calibration model for original spectra. The quality of the calibration model was evaluated by analyzing the values of the coefficient of determination between predicted and actual degree of adulteration for the calibration set (R2
cal), root mean square error of calibration (RMSEC), and root mean square error of cross-validation (RMSECV). As mentioned by reference [12], a calibration model with R2 value greater than 0.91 is considered to be an excellent calibration, while an R2 value between 0.82 and 0.90 results in good prediction. A small difference between RMSEC and
RMSECV value was also important to avoid ‘over-fitting’ in the calibration model [13].
Prediction set was provided and it was used to evaluate the prediction ability of the model through the value of coefficient of determination between predicted and actual degree of adulteration for the prediction set (R2
pred), the root mean square error of prediction (RMSEP), bias between actual and predicted degree of adulteration and ratio prediction to deviation (RPD) value (RPD = SD validation set/SEP) [14]. The calibration model should have as high as possible RPD value. The RPD value is desired to be larger than 3 for an acceptable calibration [12]. An RPD value less than 1.5 indicates incorrect predictions and the calibration model cannot be used for further prediction [12, 15]. RMSEP is generally not higher than 1.2 times the RMSEC [16]. PCA and PLS regression were generated using the Unscrambler 9.8 program (CAMO, Oslo, Norway).
3. Results and discussion
3.1. Spectral data of civet coffee with several degree of adulteration
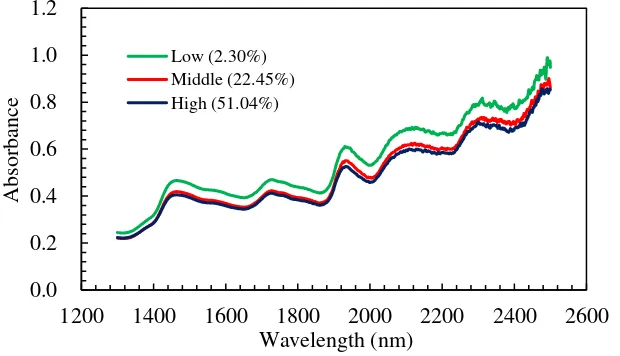
Figure 1 shows spectral data of civet coffee samples with three level of degree of adulteration (low, middle and high) in the range of 1300-2500 nm. There are several peaks at 1460 nm, 1740 nm and 1930 nm. The wavelengths in the region 1400-1500 nm may refer to the first overtone of the OH functional group [17-18], of chlorogenic acids, water, alcohols, and especially carbohydrates present in the civet coffee samples [5, 19-20]. It is noted that increasing of degree of adulteration tends to decrease the intensity of absorbance.
Figure 1. Spectral data of civet coffee samples with different degree of adulteration (low, middle and high) in the range of 1300-2500 nm.
0.0
1200 1400 1600 1800 2000 2200 2400 2600
4
3.2. PCA
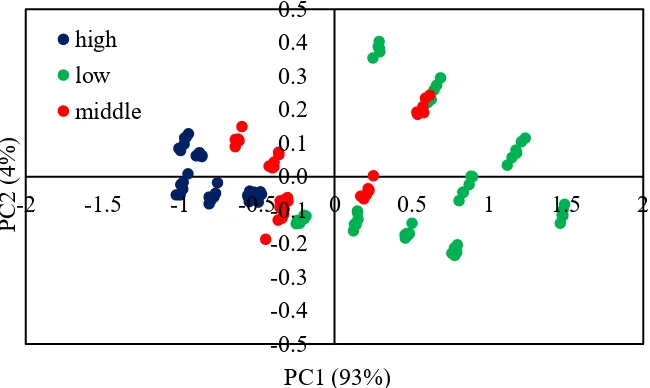
Prior to developing PLS calibration model, an exploratory analysis using PCA (principal component analysis) on all spectral data was performed in order to investigate the presence of outliers and any trend of discrimination among civet coffee samples from different degree of adulteration. The scores plot of the two first principal components (PC1 vs PC2) is presented in figure 2. PC1 accounted for 93% of the variation explanation and described most variation in the calibration spectra. PC2 represented 4% of the variation in the spectra. The first two PCs accumulatively accounted for 97% of the variation among samples. Figure 2 shows that the samples can be clustered into three level of degree of adulteration: low (0-15.60%), middle (20.12-35.54%) and high (40.52-51.04%). It is interesting that in general there is a tendency of an increase in adulterant content in the negative direction of PC1, i.e., PC1 < 0. The civet coffee with 100% purity (0% of degree of adulteration) is found in the positive quadrant of PC1, i.e., PC1 > 0, (figure 2). Therefore, as the adulterant content in the blend increases, the samples are positioned in the direction of the negative quadrant of PC1, i.e., PC1 < 0.
Figure 2. The result of PCA on all samples with different degree of adulteration (low, middle and high).
3.3. Developing PLS calibration model
The PLS calibration model using original spectra was developed with PLS1 regression and full-cross validation method. The result is depicted in figure 3. The quality of model is very excellent with very high coefficient of determination (R2
cal=0.96), low RMSEC (3.62%) and low RMSECV (4.83%). The difference between RMSEC and RMSECV is also small and relatively low number of latent variables (LVs) was included in the model. The quality of the developed calibration model was comparable to that of several previously reported studies on the determination of adulteration in civet coffee using other methods [8]. The quantification of adulteration in civet coffee using UV-Vis spectroscopy has been reported with the best calibration model, was observed using Savitzky-Golay smoothing spectra with R2
Figure 3. Scatter plot between actual and predicted degree of adulteration in the calibration model.
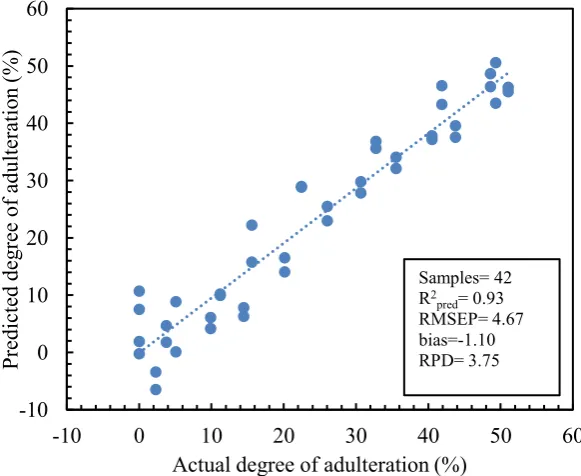
Figure 4. Scatter plot between actual and predicted degree of adulteration in the prediction step.
3.4. Prediction unknown new samples
In order to evaluate the performance of the developed PLS calibration model, a prediction of degree of adulteration in unknown new samples of prediction set was performed. For this purpose, a number of 42 samples was provided. The result for prediction was shown in figure 4. The quality of prediction is also very good with high coefficient of determination (R2
6
bias (-1.10%). It is noted that the RMSEP value is not exceed 1.2 times than the RMSEC value. The prediction resulted in high RPD value (RPD=3.75). The model prediction results with R2 > 0.80 and RPD in the 2.5–3.0 range was considered reliable and the model could be used as a good prediction model for determination of degree of adulteration in civet coffee. Based on figure 4 and using a method proposed by reference [21], the limit of quantification of this method was 6.98%.
4. Conclusion
In this research, NIR spectroscopy, combined with full spectrum PLS regression model, is confirmed to be an interesting tool for non-destructive quantification of degree of adulteration in civet coffee. The PLS calibration model gives acceptable result with high coefficient of determination both in calibration and validation step. The prediction of unknown new samples using the proposed PLS calibration model resulted in low RMSEP and high RPD value. This result can be potentially applied for non-destructive authentication system for civet coffee.
Acknowledgements
The authors would like to thank Laboratory of Bio-Sensing Engineering of Kyoto University for giving the author permission to use NIR spectrometer and its supporting devices (through JASSO Follow up Research Program 2016). Some part of this research was also funded by Kemenristekdikti Indonesia (Hibah Strategis Nasional/STRANAS 2016–2017 No. 585/UN26.21/KU/2017).
References
Assis C, Oliveira L S and Sena M M 2017 Food Anal. Methods. In press Grinshpun H 2014 J Consum Cult14:343–64
ICO 2016 http://www.ico.org/profiles_e.asp. Accessed 10 October 2017
Ludwig I, Clifford M, Ashihara H and Crozier A 2014 Food Funct29: 1695–1717.
Barbin D F, Felicio A L S M, Sun D W, Nixdorf S L and Hirooka E Y 2014 Food Res Int61: 23– 32
Damatta FM, Ronchi CP,Maestri M and Barros RS 2007 Braz J Plant Physiol19: 485–510 Marcone MF 2004 Food Res. Int. 37: 901–12
Suhand D and Yulia M 2017 Int. J Food Sci
Jumhawan U, Putri SP, Yusianto BT and Fukusaki E 2016 J Biosci Bioeng122: 79–84
Suhandy D and Yulia M 2017 Proc. of the 1st Int. Conf. on the Role of Agricultural Engineering for Sustainable Agriculture Production (Bogor: Institut Pertanian Bogor) pp 6–10
Naes T, Isaksson T, Fearn T and Davies T 2002 A User-Friendly Guide to Multivariate Calibration and Classification (Chichester: NIR Publications)
Saeys W, Mouazen A M and Ramon H 2005 Biosys. Eng. 91: 393−402 Gomez A H, He Y and Pereira AG 2006 J Food Eng. 77: 313−9 Brereton RG 2000 Analyst 125: 2125−54
Sunoj S, Igathinathane C and Visvanathan R 2016 Comput. Electron. Agric. 124: 234−42. Zhan H, Fang J, Wu HW, Yang HJ, Li H, Wang Z J, Yang B, Tang LY and Fu M H 2017 Chinese
Herbal Medicines9: 250−7
J Workman and Weyer L 2008 Practical Guide to Interpretive Near-Infrared Spectroscopy, (CRC Press: Taylor & Francis Group)
Kasemsumran S, Thanapase W and Kiatsoonthon A 2007 Anal. Sci. 23: 907−10
Alessandrini L, Romani S, Pinnavaia G and Rosa MD 2008 Anal. Chim. Acta625: 95–102 Suhandy D and Yulia M 2017 Int. J. Food Prop.20: S331–9