THE EFFICIENCY AND PRODUCTIVITY
OF THEREGIONAL DEVELOPMENT
BANKS IN INDONESIA: AN APPLICATION
OF DATA ENVELOPMENT ANYLYSIS
(DEA)- MULTISTAGE (INPUT ORIENTED
VRS) APPROACH COMPARE WITH
CAMEL APPROACH
Marthen Sengkey
Staff Pengajar Fakultas Ekonomi Universitas Klabat
The study employs DEA-Multistage (input oriented VRS)-model to investigate the efficiency and productivity of the 26 regional development bank in Indonesia from 1994 to 2004. DEA results suggest that the average estimate scores of sample banks have ranged from 19.14 percent to 69.14 percent. From this approach, BPDWS is the most efficient with the highest average estimate efficiency score of 69.14 percent and has the lowest average input inefficiency of 30.86 percent. On the other hand BPDP has the lowest average efficiency score, whis is 19.14 percent with the highest average input inefficiency of 80.86 percent. Moreover, 69.2 percent of banks have the estimate efficiency score above the mean of 33.28 percent. In general, the efficiency scores of all banks showed a decline when the financial crisis stuck the Asian region in 1997. Another significant contribution of DEA model is a possible explicit determination of bank’s excesses in input resources and also output deterioration for the first itme in Indonesia development banks. Among four input variables, capitas has the highest average input slack of 11.26 percent followed by deposit, fixed assets and total operating expenses with the average imput slacks of 10.13 percent, 6.44 percent, 6.44 percent, and 3.65 percent respectively.
Keywords: DEA multistage input oriented VRS, regional development banks, efficiency,
Introduction
Since the Data Envelopment Analysis (DEA) model was proposed by Charmer et al., (1978), it has been widely used in non-profit and non-profit organizations to measure the efficiency and productivity. It is used in non-profit organization, such as hospital (Sarkis and Talluri, 2002; Ferrier and Valdmanis, 2004); 87 Countries/Capital and
GDP growth (Kruger, 2003)
Taiwan/Multinational R&D Project (Kuang, 2005); Norway/Traffic Accidents & Safety (Odeck, 2005). For profit organizations such banking industry or financial institution: see Avrikan, (1999) Zenios et al., (1999); Drake, Howcroff (2002) Chien, Dauw (2004); Krishnasamy et al., (2004); Wai et al., (2003); Karr (2005) etc.
DEA modeling allows the anylist to select inputs and outputs in accordance with a managerial foucs. Furthermore, the technique works with variables of different units without the need for standardization (e.g. dollars, number of transactions, or number of staff) (Banker, 1984; Burle, 1995; Mester, 1996). .. That is, DEA does not assume a particular production technology or correspondence. The importance of this feature of DEA is that a banks’s efficiency can be assessed based on other observed performance. As an efficient frontier technique. DEA identifies the inefficiency, in a particular Decision Making Units (DMU) comparing it to similar DMUs regarded as efficient, rather than trying to associate a DMU’s performance with statistical average that may not be applicable to that DMU.
Assessment of operational-performance through DEA can be complemented by ratio analysis that measures financial performance of a branch (Oral et al., 1992). DEA is that it alloswa management to nominate the inputs and ouputs entering the analysis. DEA allows to be classified as either controllable or uncontrollable by management. This facilities an analysis where performance can be interpreted in the context of unctrollable environmental conditions (Banker and Morey, 1986; Epstein and Henderson, 1989). Dea models
can offer much potential for a significant advance in the comparative analysis of financial institution by enabling the the concurrent study of the multiple varibales that affect bank efficiency overtime (Bauer et al., 1997).
Data envelopment analysis is used to compare the efficiency estimates among the Indonesia regional development banks and to determine the input usage/saving and ouput deterioration for each bank’s performances.
There are four input variables (deposit, operationg expenses, capital and fixed assets and one variable (loan) as output used in this study.
Overview of the Banking System in Indonesia
Indonesia’s financial system stability relies heavily on the banking industry, covering, of about 90 percent of total asset of the country’s financial system Indonesia’s banking system is dominated by 13 large banks, including ten (10) recapitalization banks, which represent 74.8 percent of the total assets of banking industry. Therefore, ensuring the soundness of these large banks is the key in maintaining stability of banking system and financial system (BI 2002).
Before the 1997 crisis, Indonesia evolved into five stages: (1) the rehabilitation period (1967-1973) to restore the economy from high inflation; (2) the ceiling period (1974-1983) where interest rates ceing were applied; (3) the growth period (1983-1988) following banking deregulation of June 1983 removed the interest rate ceiling; (4) the acceleration period (19881991) following the impact of extensive bank reforms in October 1988; and (5) the consolidation (1991-1997) in which prudential banking principles were introduced including capital adequency and bank ratings (Batunaggar, 2002).
closures. For the 3rd round closures on March 13, 1999, 38 private banks were frozen. Other strategies made by the bank authority are bank take over and recapitalization. On April 4, 1998, seven (7) private banks had taken over (BTO) and on May 29, 1998, one (1) private bank had taken over for the 1 st round of take over. For the 2nd and 3rd rounds of take over March 13 and April 4, 1998, respectively, seven (7) private banks and two (2) private banks had been taken over.
Recapitalization for private banks accrued on April 21, 1999 and March 2000 for the 1st and the 4th rounds, where seven (7) and three (3) banks had been recapilatalized, respectively. There were 12 regional development banks and four (4) state banks that had been recapitalized (BI, 2000).
During the resolution of banking crisis, m there are 12 cut of 26 regional development banks that received injection of capital from the bank’s authority. Fourteen (14) banks grouped in A category with CAR greater thatn 4 percent, eight (8) banks grouped in B category with CAR greater than negative twenty five percent but less thatn four percent (-25%<CAR, 4%), and the rest four (4) banks be categorized in level C with CAR less than -25 percent (BI, 2002).
Regional Development Bank (BPD) was established based on the Law No. 13,1962, which stipulated the establishment of regional development bank in each province in Indonesia, serving as an intermediator to the investors in that area.
Methodology
DEA – MultistageModel (Input-oriented
variable retruns to scale _VRS
technology). DEA was originally
introduced by Charnes et aL ( 1978) and is a non-parametric linear programming approach, capable of handling multiple inputs as well as multiple outputs. DEA assumes that the inputs and outputs have been correctly identified. Usually, of 1 as they become too specialized to be evaluated with respect to other units. On the other
hand, if there are too few inputs and outputs, more DMUs tend to be comparable. In any study, it is importand to focus on correctly specifying inputs and outputs. According to Krugger (2003), DEA is a local method in that calculates the distance to the frontier function through a direct comparison with only those observations in the samples that are most similar to the observation for which the inefficiency is to be determined.
The Piece-wise linear form of non-parametric frotntier in DEA can cause a few difficulty in efficiency mearure. The problem arises because of the sections of the piece-wise linear frontier, which run parallel to the axes which do not occur in most parametric function Coelli et al., 1998).
Environment is the factor which could influence the efficiency of a firm, where such factors are not traditional inputs and are assumed not under the control of manager. Some examples of environmental variables include ownership, location, labor, and government regulation (Fried et al., 1999). If the values of the environmental variable can be ordered from the least to the most detrimental effect upon efficiency, then the approach of Banker and Morey (1986a) can be natural ordering of the environmental variable then one can use a method proposed by Chames et al. (1985).
Chames et al. (1978) stated that the DEA technique as an efficiency measure of production unit by its position relative to the frontier of the best performance, established mathematically by the ration of weighted of sum of inputs; different decision makin units (DMU) can be compared based on productivity and efficiency. A common practice in this case is to run DEA where all the inputs are treated as controllable and then regress the emerging efficiency scores on non-discretionary inputs.
political crisis etc, may cause the bank to be not operating at an optimal level in practice.
The fall of Soeharto and five (5) years after the financial crisis, Indonesia is still struggling to deal with economics restricting and recovery, political transition, decentralization and redefining national identity (Deuster, 2002). Moreover, the Asian financial and economic crisis of 1997-1998 hit the country hardes, which caused its real GDP declined by 13 percent in 1998 as its banking and modern corporate sectors collapsed in the wake of short-term capital outflows. Corporate debts remain largely unreconstructed, bank lending is limited, the government owns or controls most of the banking system and substantial business assets, fiscal sustainability is questionable, inflationary pressures are strong and investment climate is unattractive.
To consider all these environmental factors that may affect the banking performance in Indonesia, this study adopted Baker at al. (1984) DEA model of variable returns to scale (VRS). Due to the consequence of the heavy intervention by the government in banking system in indonesia as mentioned earlier, bankers amy well have been prevented from operating at the optimal level in their operation. Therefore, technical efficiency in this study is calculated using the input-oriented VRS model. The envelopment form of the input-oriented of CRS and VRS DEA model is specified as stated by Coelli et al. (1998, pp. 150, 151). of constants, N*1 is an vector of one.
In this study, θἰ efficiency score for efficiency score will satisfy if the value of θ is less and equal than one. If there is a difference in the CRS and VRS TE (Coelli et al, 1998, pp.134, 140, and 141). Furthermore, the nature of the scale inefficiencies for particular firm can be determined by seeing whether the non increasing return to scale (NIRS) technical efficiency (TE) of NIRS TE score is equal to the VRS TE score. If they are unequal, then increasing return to scale exists for the firm. If they are equal, the decreasing return to scale applies. And if TECRS = TEVRS the firm is operating under constant return to scale CRS (Coelli et al., 1998, pp. 150-151). The efficiency scores in this study were estimated, using the computer program known as Efficiency Measurement System – EMS (Scheel, 2000).
Slacks. The piece-wise linear form of the non-parametric frontier in DEA can cause a few difficulties in efficiency measurement. The problem arises because of the sections of the piece-wise linear fronties which run parallel to the axes which do not occur in most parametric functions Coelli et al. (1998). Some authors argue that both the Farrell measure of technical efficiency (θ) and any non-zero input or output slacks should be reported to provide an accurate indication of technical efficiency of firm in DEA analysis Coelli et al. (1998). They sated that the output slacks will be equal to zero if and only if Yλ-y1=0 and the input slacks will be equal to zero if and only if θx1- Xλ=0 (for the given optimal values of θ and λ).
Coelli et al. (1998) stated that there are two major problems associated with the second stage LP. The first and most obviouse problem is that the sum of the slacks is maximized rather than minimized. Hence, it identifies not the nearest efficient point but the furthest efficient point. The second major problem associated with the
the two problems mentioned, the multi-stage DEA method was used. Coelli (1998) staed that the multistage method involves a sequence of radial DEA models and hence is more computationally demanding that the first-stage and second stage methods. However, the benefits of the approach are that it identifies efficient projected points which have input and output mixes as similar as possible to those of ineffiecient points, and that it also invariant to units of measurement. For a detailed explanation, see Coelli et al. (1998).
Data and Variables
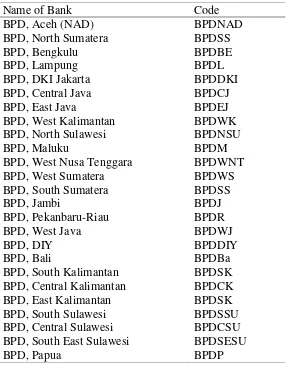
Data. This study uses a panel data set of 26 regional: development:’ banks is in Indonesia from 1994 to 2004. The sample include all the regional development banks, owned by 26 provinces in Indonesia. The time period from 1994 to 2004 was selected based on data for the audited financial reports. The number of Indonesia’s regional development banks is shown in Table 1 below:
Table 1. Regional Development Bank
Variables. This study used one (1)
output variable and four (4) input variables to evaluate bank’s efficiency through the DEA multistage model (input oriented VRS techonology). The output variable is total loans and input variables are (1) total
Deposits, (2) total opearational expenses, (3) capital, (4) total fixed assets.
Total loans are composed of loan of rupiah currency (related parties and third parties) and loan of foreign currency (related parties and third parties). Total deposits are composed of demand deposits, saving deposits, time deposits, and certificate
Name of Bank Code
BPD, Aceh (NAD) BPDNAD
BPD, North Sumatera BPDSS
BPD, Bengkulu BPDBE
BPD, Lampung BPDL
BPD, DKI Jakarta BPDDKI
BPD, Central Java BPDCJ
BPD, East Java BPDEJ
BPD, West Kalimantan BPDWK
BPD, North Sulawesi BPDNSU
BPD, Maluku BPDM
BPD, West Nusa Tenggara BPDWNT
BPD, West Sumatera BPDWS
BPD, South Sumatera BPDSS
BPD, Jambi BPDJ
BPD, Pekanbaru-Riau BPDR
BPD, West Java BPDWJ
BPD, DIY BPDDIY
BPD, Bali BPDBa
BPD, South Kalimantan BPDSK
BPD, Central Kalimantan BPDCK
BPD, East Kalimantan BPDSK
BPD, South Sulawesi BPDSSU
BPD, Central Sulawesi BPDCSU
BPD, South East Sulawesi BPDSESU
deposits. Total operating expenses consist of interest expenses, fees and commissions, general and administrative expenses, salary and employees’ benefits, loss on fair value on trading account securities and foreign exchange. Capital is composed of capital stock, donated capital, increment of financial report, unrealized gain (loss) from trading account securities, and other comprehensive income, and difference on affiliated retained earning. Lastly, fixed assets are composed or premises and equipment, assets in direct financing lease and real and chattel properties.
Emperical Results
DEA and CAMEL. DEA was used in this study to compare the efficiency estimates among the Indonesia’s regional development banks and evaluate the input usage savings and output deterioration for each bank’s performance. The key advantage of DEA over other methods of performance evaluation is that it allows one to consider a nuber of outputs and inputs simultaneously, regardless of whether all the variables of interest are measured in common units. (Sexton, 1986).
In this evaluation process, the study used four (4) Variables (deposit, operating expenses, capital, and fixed assets) as inputs and loans as output. The result of efficiency score and inputs slacks compared with the summarized in Table 2, 3 and 4, respectively.
Results reveal that bank, which has the highest efficiency estimate score among 26 banks is BPDWS (69.14 percent), whch means BPDWS could possibly reduce the usage of all input (deposit, operating expenses, capital an fixed asset) by 30.86 percent (1-0.6914) without reducing the current output. This same bank had an efficiency score of 100 percent in1994 and 1995, which means that it did not incur input excesses.
Even though, BPDWS showed a decline from 93.21 percent in 1996 to 53.7 percent in 2004, this bank still posted the highest efficiency performances for the entire evaluation period.
BPDDKI posted an efficiency score of 100 percent from 1997 to 1998, however, this bank occupied the eight rank in terms of efficiency scores of 28.17 percent (1994 1996) and 27.35 percent (1997-2004). The banks that have the second and third ranks with a higher efficiency estimate score are BPDENT and BPDBE with scores of 61.20 percent and 58.34 percent, respectively. Results imply that BPDENT and BPDBE could reduce their given inputs by 38.80 percent and 41.66 percent, respectively without reducing the present output. Otherwise, the: bank that has the lowest efficiency score is BPDP with a 19.14 percent efficiency estimate score. This means that this bank has-been wasting in using all the inputs-by 80.86 percent.
Table 2. Summary of Efficiency Score (%) of Regional Development Banks in Indonesia (1994-2004)
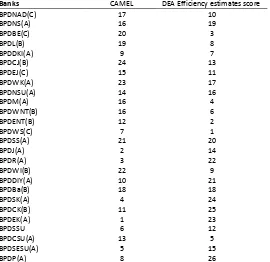
Table 3. Rank Based on Average Rank of CAMEL Ratios and Average Rank of
Efficiency Estimates Score (DEA) of Regional Development Banks in Indonesia (1994-2004)
Banks CAMEL DEA Efficiency estimates score
BPDNAD(C) 17 10
BPDNS(A) 16 19
BPDBE(C) 20 3
BPDL(B) 19 8
BPDDKI(A) 9 7
BPDCJ(B) 24 13
BPDEJ(C) 15 11
BPDWK(A) 23 17
BPDNSU(A) 14 16
BPDM(A) 16 4
BPDWNT(B) 16 6
BPDENT(B) 12 2
BPDWS(C) 7 1
BPDSS(A) 21 20
BPDJ(A) 2 14
BPDR(A) 3 22
BPDWI(B) 22 9
BPDDIY(A) 10 21
BPDBa(B) 18 18
BPDSK(A) 4 24
BPDCK(B) 11 25
BPDEK(A) 1 23
BPDSSU 6 12
BPDCSU(A) 13 5
BPDSESU(A) 5 15
BPDP(A) 8 26
Note: CAMEL rank is computed by sum of the rank of each ratio divided by total ratios (8)
Banks 1994 1995 1996 1997 1998 1999 2000 2001 2002 2003 2004 Mean
BPDNAD(C) 39.8 36.21 33.38 34.8 61.3 22 57 5743 45 72 39.05 32.19 51 5 41 27 BPDNS(A) 31.3 28.28 28.53 2867 35.4 1441 36.21 38.78 27.56 31.90 44.97 31 45 BPDBE(C) 82.6 56.44 51.43 4797 44.0 7294 76.02 56A5 48.52 46.10 59.4 58.34 BPDL(B) 45.3 38.20 35.62 40.1 t 259 2911 65.64 64.24 45.71 46.07 58.5 44.94 BPDDKI(A) 23.6 25.35 35.48 100 too 100 14.49 11,82 14.61 23.22 35.6 44.19 BPDCJ(B) 28.8 29.18 3592 34.95 39 5 36.74 36.70 4150 41.24 4109 53.8 3912 BPDEJ(C) 31.9 34.58 40.89 4+21 497 3670 32.28 40.62 39.39 44.95 49.3 40.33 BPDWK(A) 50.2 48.23 32.86 30.68 23.5 26.14 23.36 29.83 34.17 37.42 49.6 35.09 BPDNSUA 32.9 35.62 32.54 33.20 21.2 19.84 72.74 48.96 27.51 28.35 35.6 35.32 BPDM(A) 63.1 66.11 63.12 63.12 100 3634 24 19 39.44 30.81 35.95 35.2 50.67 BPDWNT(B) 41.4 41.51 40.13 19.46 96.4 3253 45.59 4700 40.15 44.32 65.3 49.53 BPDENT(B) 73.4 78.00 72.72 55.77 100 31.62 56.86 41.69 42.69 44.44 76.1 61.20 BPDWS(C) 100 100 93.21 67.78 62.9 61.95 56.48 54.83 50.18 59.48 53.7 69.14 BPDSS(A) 39.1 33.88 30.06 30.07 16.3 1790 25.89 29.10 23.88 24.45 23.9 26.78 BPDJ(A) 611 48.01 36.17 36.34 27.5 27.18 2991 31.38 33.29 33.80 30.7 35.93 BPDR(A) 27.7 28.88 29.74 25.83 9.54 11.13 1783 23.52 25.60 28.83 33.9 2387
Banks 1994 1995 1996 1997 1998 1999 2000 2001 2002 2003 2004 Mean
Table 4. The Rank Based on CAMEL Ratio and Efficiency Estimate Score (DEA) of the 26 Regional Development Banks in Indonesia (1994-2004)
Determine the input usage/savings and output deterioration for each bank’s performance (DEA approach)
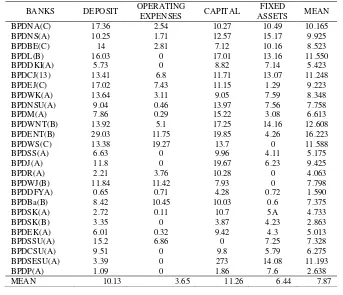
Input slacks. The summary of input slacks over the evaluation period 1994 of
this study is shown in Table 5. Keep in mind that input slacks refer to input surplus or excess that a bank need to reduce to be efficient.
Table 5. Summary of input Slacks (%) of Regional Development Banks in Indoesia (1994-2004)
Bank DE
A
C/TP A
TE/TEL O
TLO/ TA
NPL/
TLO Exp/TA ROA ROE
CPCB/ TDB
BPDNAD(C) 10 25 20 6 22 2 23 20 5
BPDNS(A) 19 4 7 16 8 15 24 26 22
BPDBE(C) 3 24 26 21 23 7.5 16 11 11
BPDL(B) 7 13 22 23 9 6 18 18 24
BPDDKI(A) 8 10 19 12 2 3 21 23 to
BPDCJ(13) 13 12 21 20 24 16 20 22 25
BPDEJ(C) 11 22 24 15 11 8 12 8 14
BPDWK(A) 17 18 18 14 21 12 22 25 17
BPDNSU(A) 16 6 14 19 20 14 8 13 16
BPDM(A) 4 14 13 9 26 5 17 17 2
BPDWNT(B) 6 5 12 25 10 13 13 21 23
BPDENT(B) 2 21 23 17 13 4 6 3 19
BPDWS(C) 1 19 1 1 19 25 5 2 8
BPDSS(A) 20 8 16 22 6 21 19 24 26
BPDJ(A) 14 2 4 10 16 9 1 1 12
BPDR(A) 22 23 3 3 12 7.5 10 6 1
BPDWJ(B) 9 20 25 26 1 24 14 16 20
BPDM(A) 21 9 Is 18 14 23 9 6
BPDBa(B) Is 11 17 24 7 26 11 14 15
BPDSK(A) 23 3 2 7 18 19 4 10 3
BPDCK(B) 25 15 10 4 17 20 15 15 9
BPDEK(A) 24 17 5 2 3 1 17 5 2
BPDSSU 12 26 6 11 4 17 3- 7 4
BPDCSU(A) 5 16 8 5 25 10 19 19 7
BPDSESU(A) 15 1 11 13 15 18 2 4 13
BPDP(A) 26 7 9 8 5 22 9 12 18
BANKS DEPOSIT OPERATING
EXPENSES CAPITAL
FIXED
ASSETS MEAN
BPDNA(C) 17.36 2.54 10.27 10.49 10.165
BPDNS(A) 10.25 1.71 12.57 15.17 9.925
BPDBE(C) 14 2.81 7.12 10.16 8.523
BPDL(B) 16.03 0 17.01 13.16 11.550
BPDDKI(A) 5.73 0 8.82 7.14 5.423
BPDCJ(13) 13.41 6.8 11.71 13.07 11.248
BPDEJ(C) 17.02 7.43 11.15 1.29 9.223
BPDWK(A) 13.64 3.11 9.05 7.59 8.348
BPDNSU(A) 9.04 0.46 13.97 7.56 7.758
BPDM(A) 7.86 0.29 15.22 3.08 6.613
BPDWNT(B) 13.92 5.1 17.25 14.16 12.608
BPDENT(B) 29.03 11.75 19.85 4.26 16.223
BPDWS(C) 13.38 19.27 13.7 0 11.588
BPDSS(A) 6.63 0 9.96 4.11 5.175
BPDJ(A) 11.8 0 19.67 6.23 9.425
BPDR(A) 2.21 3.76 10.28 0 4.063
BPDWJ(B) 11.84 11.42 7.93 0 7.798
BPDDFYA) 0.65 0.71 4.28 0.72 1.590
BPDBa(B) 8.42 10.45 10.03 0.6 7.375
BPDSK(A) 2.72 0.11 10.7 5A 4.733
BPDSK(B) 3.35 0 3.87 4.23 2.863
BPDEK(A) 6.01 0.32 9.42 4.3 5.013
BPDSSU(A) 15.2 6.86 0 7.25 7.328
BPDCSU(A) 9.51 0 9.8 5.79 6.275
BPDSESU(A) 3.39 0 273 14.08 11.193
BPDP(A) 1.09 0 1.86 7.6 2.638
Table 5 shows in detail how much each bank input could be reduced to reach the best practice frontier (efficiency level). In terms of deposit as an input, all banks incurred input slacks. Banks with a higher input slack have a lower efficiency performance. The result shows that the most inefficient bank is BPDENT, with the needs to reduce its deposit of 29.03 percent. Otherwise, bank which has the lowest slack of deposit is BPDIY. Anallytically, this bank needs only to reduce its depost of 0.65 percent to be a 100 percent efficient.
The second input is operating expenses. Chic study found out that there are eight (8) banks that do not need to reduce their operating expenses due to zero slack result. Those banks are the following: BPDL, BPDKI, BPDSS, BPDJ, BPDCK, BPDCSU, BPDSESU and BPDP. On the other hand BPDWS, which is known as the top performer in the efficient estimate score, has the highest slack in operating expenses of 19.27 percent, compared with the highest efficiency estimate score of 69.14 percent.
The third input variable is capital. The result shows that most of the banks have capital surpluses, except for BPDSSU, which has a zero slack. There are three banks which have the highest input slack of capital among 26 banks. Those banks are the following: BPDSESU, with a capital surplus of 27.30 percent, BPDENT of 19.85 percent and BPDJ of 19.67 percent. In other words, these banks need to reduce their capital as much as their slack rating without reducing their current output.
The last input variable is fixed asset. There are two (2) banks that posted zero slack. Those banks are the following: BPDR and BPDWJ. BPDR occupied the third rank with the lowest slack in terms of deposit, eleventh rank in terms of operating expense slacks, and the fourteenth rank in terms of capital slacks. While BPDWJ has the sixteenth rank in terms of deposit slacks, the
eight rank in the highest slack in terms of operating expenses, and the sixth rank in the lowest slack in terms of capital. By using the DEA approach, the result shows that no bank in the sample has a consistent efficiency performance in terms of efficiency or inefficiency score. The results of DEA approach seems to be similar with the result of the CAMEL analysis: none of the banks has a consistence performance for all variables used in DEA or CAMEL.
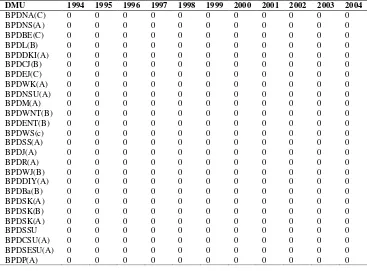
Table 5 shows that, on average, the highest slacks of all input variables were posted by BPDENT (12.68 percent) while the lowest slacks were posted by BPDIY (1.59 percent). BPDIY has managed to utilize efficiently its deposit, operating expenses, capital, and fixed assets to the production of loans (as an output): it calls for a reduction of all inputs by 1.59 percent only to become efficient. However, Table 1 shows that none of the banks incurred output slack, because the output slacks of all banks are zero. Thus, the presence of input slacks in deposit, operating expenses, capital and fixed assets did not effect to produce the loan as an output.
Table 6. Summary of Loan Slack (%) of Regional Development Bank in Indonesia (1994-2004)
Conclusions and Future Research
The significant findings and
contributions of the study are as follows: Bank performance is modeled again using a non- parametric DEA model. This model fills in the limitation of CAMEL model (Financia), which generates single or partial measurement of efficiency and productivity, by accommodating multiple variables to generate a broader measurement of efficiency and productivity. DEA results suggest that the average estimate scores of sample banks have ranged from 19.14 percent to 69.14 percent.
From this approach, BPDWS is the most efficient with highest average estimate efficiency score of 69.14 percent and has the lowest average input inefficiency of 30.86 percent. On the other hand, BPDP has the lowest average efficiency score, which is 19.14 percent with the highest average input inefficiency of 80.86 percent Moreover, 69.2 percent of banks have the estimate efficiency score above the mean of 33.28 percent. In general, the efficiency scores of all banks showed a decline when the financial crisis struck the Asian region in 1997.
Another significant contribution of DEA model is a possible explicit determination of bank’s excesses in input resources and also output deterioration for the first time in Indonesian development banks. Among four input variables, capitall has the highest average input slack of 11.26 percent followed by deposit, fixed assets and total operating expenses with the average input slacks of 10.13 percent, 6.44 percent, and 3.65 percent respectivel. For the capital variable, BPDSESU has the highest input slack of 27.30 percent that calls for a reduction of 27.30 percent of the capital used without reducing the output. Further, banks with the highest ratio of other input slacks are BPDENT (29.03 percent) for deposit, BPDWS (19.27 percent) for operating expenses, and BPDNS (15.17 percent) for fixed assets. Otherwise, ther are five banks that have a zero input slack for operating expenses (BPDL, BPDDKI, BPDSS, BPDJ, BPDCK), one bank for capital (BPDSSU), and three banks (BPDWS, BPDR, BPDWJ) for fixed assets. Overall, bank that has the highest weighted mean of the input slack for all variables in BPDENT with the mean value of 16.223
DMU 1994 1995 1996 1997 1998 1999 2000 2001 2002 2003 2004
BPDNA(C) 0 0 0 0 0 0 0 0 0 0 0
BPDNS(A) 0 0 0 0 0 0 0 0 0 0 0
BPDBE(C) 0 0 0 0 0 0 0 0 0 0 0
BPDL(B) 0 0 0 0 0 0 0 0 0 0 0
BPDDKI(A) 0 0 0 0 0 0 0 0 0 0 0
BPDCJ(B) 0 0 0 0 0 0 0 0 0 0 0
BPDEJ(C) 0 0 0 0 0 0 0 0 0 0 0
BPDWK(A) 0 0 0 0 0 0 0 0 0 0 0
BPDNSU(A) 0 0 0 0 0 0 0 0 0 0 0
BPDM(A) 0 0 0 0 0 0 0 0 0 0 0
BPDWNT(B) 0 0 0 0 0 0 0 0 0 0 0
BPDENT(B) 0 0 0 0 0 0 0 0 0 0 0
BPDWS(c) 0 0 0 0 0 0 0 0 0 0 0
BPDSS(A) 0 0 0 0 0 0 0 0 0 0 0
BPDJ(A) 0 0 0 0 0 0 0 0 0 0 0
BPDR(A) 0 0 0 0 0 0 0 0 0 0 0
BPDWJ(B) 0 0 0 0 0 0 0 0 0 0 0
BPDDIY(A) 0 0 0 0 0 0 0 0 0 0 0
BPDBa(B) 0 0 0 0 0 0 0 0 0 0 0
BPDSK(A) 0 0 0 0 0 0 0 0 0 0 0
BPDSK(B) 0 0 0 0 0 0 0 0 0 0 0
BPDSK(A) 0 0 0 0 0 0 0 0 0 0 0
BPDSSU 0 0 0 0 0 0 0 0 0 0 0
BPDCSU(A) 0 0 0 0 0 0 0 0 0 0 0
BPDSESU(A) 0 0 0 0 0 0 0 0 0 0 0
percent. On the other hand bank with the lowest weighted mean of the input slack for all variables is BPDIY with the value of 1.59 percent. Regarding output slack, the result shows that none of the banks has the output slack. In the operation of the banks to produce loans during 1994 to 2004, banks did not incur any deficiency.
New original findings of this study can also provide a starting point for further inverstigation on performance, efficiency and productivity for other banks or industries by using different models of
CAMEL, and DEA. Moreover, results will be further validated by the aid of other statistical tools aside form tests used in this study. Significantly, results of this study contribute significantly to the theoretical modeling of performance (financial, efficiency, and productivity) extensively in banking sector as evident in the Indonesian state banks. The new empirical findings provided by the study are added new contributions to the literature on the banking performance management.
References
Athanassopoulus, Anrtreas D. (1998). Nonparametric frontier models for assessing the market and cost efficiency of large-scale bank branch networks. Journal of Money, Credit, and Banking 30 (2), 172-192.
Avkiran, Nechm K. (1999). The Evidence on Efficiency Gains: The Role of Mergers and the Benefits to the Public. Journal of Banking and Finance 23, 991-1013.
Avkiran, Nechmi K. (1999). An application reference for data evelopment analysis in branch banking: helping thenovice researcher. The International Journal of Bank Marketing 17(5), 206.
Bank Indonesia. (2002). Bank Indonesia Annual Report 2002.
Banker, R. D. and Morey, R. C. (1986). Efficiency Analysisis for Exogenously Fixed Inputs and Outputs. Operating Research 34(4), 513-521.
Banker, R. D., A. Charries., and W.W. Cooper. (1984). Some Models for Estimating Technical and Scale Inefficiencies in Data Envelopment Anlysis. Management Science 30(9), 1078-1092.
Bauer, P. W., Berger Allen. N., Ferrier, Garry. D., and Humprey, David. B. (1997). Consistency conditions for regulatory analysis of financial institutions: A comparison of frontier efficiency methods. Working paper 02(97), Federal Reserve Financial Services.
Bauer, P. W., A.N. Berger Allen. N., Ferrier, Garry. D., and Humprey, David. B. (1997). Consistency conditions for regulatory analysis of financial institutions: A comparison of frontier efficiency methods. Journal of Economics and Business 50 (2), 85-114.
BI (2000). Monthly reports. www.bi.go.id
Chames, A., W. W. Cooper and E. Rhodes. (1981). Evaluating Program Managerial Efficiency: An Application of Data Envelopment Analysis to Program Follow Through. Management Science 27(6), 668-697.
Charnel-l’a [to and Dauw-Song Zhu. (2004). Performance measurement of Taiwan’s commercial banks. International Journal of Productivity and Performance Management 53 (516), 425.
and Productivity Analysis. Dordrecht Kluwer Academic Publishers.
Deuster, Paul. (2002). Survei of Recent Developments. Bulletin of Indonesian Economics. Studies 38 (1), 2-37.
Drake, Leigh, and Howcrof Barry. (2002). An insight into the size; efficiency a UK bank branch network. Managerial Finance 28 (9), 24-37.
Epstein, M. K. and Henderson, J. C. (1989). Data envelopment analysis for managerial control and diagnosis. Decision Sciences 20, 90-119
Fama, G. D.and Jensen, M. C. (1985). Organizational forms and investment decisions. Journal of Financial Economics 14, 101-109.
Ferrier, G. D. and Valdamanis, V.G. (2004). The Journal of the Operational Research Society, October (2004). 55. (10), 1071.
Ferrier, Garry. D. and Lovell, C. A. Konox. (1990). Measuring Cost Efficiency in Banking Econometric and Linear Programming Evidence. Journal of Econometrics 46, 229-45.
Fried, H. O., Schmidt S.S. and Yaisawarng S. (1999). Incoporating the Operating Environment into a Nonparametric Measure of Technical Efficiency. Journal of Productivity Analysis 12, 249- 267.
Karr, John. (2005). Performance Measurement in Banking: Beyond ROE. Journal of performance management 18 (2), 56-71.
Kruger, Jean J. (2003). The global trends of factor productivity: Evidence from the nonparametric Malmquist index approach. Oxford, April 2003, 55 (2), 265.
Kuang-Hua, Hsu. (2005). Using Balanced Scorecard and Fuzzy Data Envelopemtn Analysis for Multinational R & D Project Performance Assessment. Journal of American Academy of Business, 7 (1), 189197.
Mester, Lorreta. J. (1996). A study of bank efficiency taking into account risk-preferences. Journal of Banking and Finance 20, 1025-45
Odeck, James. (2005). Evaluation Target Achievement in the Public Sector: An Application of a Rare Non-Parametric DEA and Malmquist Indices. Journal of Applied Economics 8(/i.171-191).
Oral. \il-. Kettani, O., and Yolalan, R. (1992) Lkn empirical study on analyzing the productivity of bank branches. HE Transactions 24 (5), 166-76.
Sarkis, Joseph, Talluri, Srinivas. (2002). Efficiency measurement of hospitals: Issues and exxtensions. International Journal of Operations & Production Management 22 (3), 306-08
Wai,Ho Leong, Dollery, Brian and Coelli, Tim. (2003). Measuring the Technical Efficiency of Banks in Singapore for the Period 1993-99:An Application and Extension of the Bauer et al. (1997) Technique. ASEAN Economic Bulletin 20 (3), 195-111.