SPATIO TEMPORAL DETECTION AND VIRTUAL MAPPING OF LANDSLIDE USING
HIGH-RESOLUTION AIRBORNE LASER ALTIMETRY (LIDAR) IN DENSELY
VEGETATED AREAS OF TROPICS
T. Bibi a *, K. Azahari Razak A. Abdul Rahman, A. Latif
a
Department of Geoinformation, Faculty of Geoinformation and Real Estate, Universiti Teknologi Malaysia, Skudai 81310, Johor, Malaysia - [email protected], [email protected],
UTM RAZAK School of Engineering and Advanced Technology, Universiti Teknologi Malaysia, 54100 Jalan Sultan Yahya Petra, Kuala Lumpur, Malaysia; Tel: +6019-3649495; Fax: +603-26934844; [email protected]
b
Dept. of Education, Azad Jammu and Kashmir, Muzaffarabad, [email protected]
KEY WORDS: Landslide, Virtual mapping, Airborne LiDAR, DTM, Kundasang, Inventory, Spatio temporal
ABSTRACT:
Landslides are an inescapable natural disaster, resulting in massive social, environmental and economic impacts all over the world. The tropical, mountainous landscape in generally all over Malaysia especially in eastern peninsula (Borneo) is highly susceptible to landslides because of heavy rainfall and tectonic disturbances. The purpose of the Landslide hazard mapping is to identify the hazardous regions for the execution of mitigation plans which can reduce the loss of life and property from future landslide incidences. Currently, the Malaysian research bodies e.g. academic institutions and government agencies are trying to develop a landslide hazard and risk database for susceptible areas to backing the prevention, mitigation, and evacuation plan. However, there is a lack of devotion towards landslide inventory mapping as an elementary input of landslide susceptibility, hazard and risk mapping. The developing techniques based on remote sensing technologies (satellite, terrestrial and airborne) are promising techniques to accelerate the production of landslide maps, shrinking the time and resources essential for their compilation and orderly updates. The aim of the study is to provide a better perception regarding the use of virtual mapping of landslides with the help of LiDAR technology. The focus of the study is spatio temporal detection and virtual mapping of landslide inventory via visualization and interpretation of very high-resolution data (VHR) in forested terrain of Mesilau river, Kundasang. However, to cope with the challenges of virtual inventory mapping on in forested terrain high resolution LiDAR derivatives are used. This study specifies that the airborne LiDAR technology can be an effective tool for mapping landslide inventories in a complex climatic and geological conditions, and a quick way of mapping regional hazards in the tropics.
1. INTRODUCTION
The landslide hazard has been a topic for many research studies like Carrara et al. (1995), Klimeš (2007), Havlín et al. (2011), Bibi et al. (2016), Razakand Mohamad (2015), Freeborough et al. (2016) etc. It is a form of mass movement in which the rock, debris, or earth moves down along slope, under the influence of gravity (Cruden and Varnes, 1996). While the terms ―mass movement‖, ―slope failure‖, and ―landslide‖ are commonly used words as synonyms. Although this natural phenomenon can cause serious hazard but it is quite difficult to predict it. Mapping, monitoring and modelling of such events are rather challenging tasks. The intensity of hazard increases many folds, when it came across with anthropogenic activities. The anthropogenic activities play vital role to slope failure in lose morphology, especially on tropical terrain where excessive rainfall and humidity exist. In this situation landslides convert from natural hazard to natural disasters.
The importance of mapping of new landslides with in fleeting time cannot be denied. It is equally important for updating of landslide inventories, susceptibility and hazard maps as well as for efficient post-disaster response (Van Den Eeckhaut., 2012). The availability of high resolution remote sensing data has been facilitating such efforts. Due to instant advances in Remote sensing techniques the research about landslides are becoming
easier as compare to past (Jaboyedoff et al. 2012., Jing et al.2016). It is easy to map fresh landslide with the help of their scars and strong spectral contrast to their surrounds because of the absence of vegetation cover (Martha et al. 2010, Roback et al. 2017). But Various inactive or reactivated landslides are also a key threat especially in tropical areas where vegetation cover grow very fast because of excessive rain and high humidity. Generally, it is assumed that the probability of reoccurrence of a landslide in wet and moist climate increases many folds because of lithology, slopes, weathering rate, climate, etc., which are not changeable. In this situation, the significant mitigation and prevention measures should be implemented. For the mitigation and prevention, it is very important to have a historical record for old or dormant landslides. In other words, a landslide inventory could not be completed without historical records of landslides.
The use of Remote sensing techniques for landslides examination is experiencing rapid developments. The probability of obtaining 3D information of the terrain with high precision and spatial resolution is opening innovative ways of exploring the landslide phenomena. Recent advances in sensor electronics and data treatment make these techniques affordable. The two major remote sensing techniques that are rapidly developing in landslides investigation are interferometric synthetic aperture radar (InSAR) (Fruneau et al. 1996; Colesanti The International Archives of the Photogrammetry, Remote Sensing and Spatial Information Sciences, Volume XLII-4/W5, 2017
et al. 2003; Squarzoni et al. 2003; Mantovani et al. (2016), Ciampalini et al. (2015), Del Ventisette et al. (2014), Bianchini et al. (2013), Greif and Vlcko (2012), Bateson et al. 2015), and light detection and ranging (LIDAR) (Carter et al. 2001; Haugerud et al. 2003; Slob and Hack 2004; Chigira et al. 2004; Schulz, 2007; Booth et al. 2009; Guzzetti et al. 2012; Hölbling et al. 2012; Jaboyedoff, 2012; Pradhan et al. 2012; Wang et al. 2013; Lin et al. 2014; Scaioni et al. 2014; Chen et al. 2015; Li et al. 2015; Mahalingam and Olsen 2015; ).
InSAR techniques are usually ground-based (Stow 1996; Tarchi et al. 2003) or satellite-based (Carnec et al. 1996; Singhroy 2009), and only rarely airborne. Although InSAR is not dependent on clear skies for data collection as compare to other optical sensors but even then, the application of SAR data for landslide inventory mapping is inadequate due to foreshortening, layover effects, atmosphere propagation effects, and vegetation decorrelation in forested terrain (Rott, 2009). LIDAR (or laser scanning) provide high-resolution point clouds of the topography and has several applications that range from mapping (Ardizzone et al. 2007; Jaboyedoff et al. 2008a) to monitoring deformation (Gordon et al. 2001), landslides or rockfall displacements (Teza et al. 2007; Oppikofer et al. 2008; Abellan et al. 2010) to landslide in soils (Jaboyedoff et al. LiDAR and its wide range of derivatives has become a powerful tool in landslide research, particularly for landslide morphology analysis (Glenn et al. 2006) and landslide identification and inventory mapping (Razak et al. 2011).
LIDAR is an advanced technology to investigate landslide in tropical region where vegetation is dense because of hot and moist climate. The LIDAR digital terrain models (DTM) is a very high resolution (VHR) accurate and precise DTM in raster grids or triangulated irregular networks (TINs) , known as 2.5D representations of the Surface. Furthermore, the true 3D point clouds of LIDAR have a high density of information. This density is dominantly based on the position of the sensor: centimetric to millimetric resolution for terrestrial laser scanning (TLS) and metric to decimetric resolution for airborne laser scanning (ALS) (Shan and Toth 2008). However, the Helicopter-based ALS can give a higher resolution as compare to aircraft-based ALS because it allows the scanner to orientate in all directions (Vallet and Skaloud 2004).
2. LANDSLIDE INVENTORY MAPPING ISSUES AND CHALLENGES
Landslides are classified as third in natural disasters in terms of death rate amongst the top ten natural disasters (UNISDR, CRED, EM-DAT, 2011). Petley (2011) mentioned in his study that more than 80,000 people around the world have been killed in the last 10 years by landslides. According to National slope master plan (2009-2023) the estimated economic losses for past 34 years is RM 3 billion and it is expected to increase up to RM 17 billion over the next 25 years without a comprehensive mitigation plan, (PWD, 2009). The precise landslide inventory mapping needs an extra effort of compiling and updating landslide maps at regional, national and global scales as the
number of events is often misjudged, and inaccurate hazard and risk maps are produced (Guzetti et al., 2012)
Landslide occurs nearly every year in Malaysia which causes incredible damages to life and properties. The purpose of the Landslide hazard map is to identify the hazard regions for the execution of mitigation plans which can reduce the loss of life and property from future landslide incidences. Currently, the Malaysian research entities, academic institutions and Government agencies are trying to develop a landslide hazard and risk database for prone areas to back the prevention program, mitigation action, and evacuation plan. Though, there is a lack of attention regarding landslide inventory mapping as a basic input of landslide susceptibility and hazard mapping. The landslide inventory mapping provides detailed spatiotemporal information about the distribution of landslides. It contains the information regarding date, types, area/volume, depth, and so on of each particular landslide. The landslide inventory can be prepared by several ways e.g. image interpretation, virtual mapping, field mapping, by utilizing historical archive, local knowledge (interview), and with the help of combination of two or more methods.
Despite of incredible advances and extensive use of remote sensing data and its derivative products, it is notable that preparation and updating landslide inventories in rough and wooded terrains is difficult especially in tropical environment. The accuracy of inventory maps in the tropical region is still vague (Razak and Mohamed, 2015). Although the importance of landslide inventory maps for mitigation and planning cannot be denied but even then, they are rarely created (Guzzetti et al., 2012). The preparation of landslide inventory map is a tedious process due to the detailed mapping of each individual landslide (Van Westen et al., 2006).
Landslides covered a large portion of peninsula Malaysia. There limited government agencies which have the accountability for sustaining a landslide database, e.g., the Public Work Department (PWD). However, it only deals with already activated landslides which have some impact on life or property e.g. such as buildings or road. Other than that, the landslides which are for the time being not disturbing the life or value able property are ignored in database. Most of the time, after the completion of research projects the landslide inventory maps are not constantly updated. Hence the scarcity of reliable information on landslides effects the quality landslide susceptibility, hazard and risk assessment process at the regional, national and continental scales. To produce a precise landslide inventory map with respect to both, the area of interest and within the time investigated is rather a difficult task to complete (Ibsen and Brunsden, 1996; Glade, 2001).
There are different approaches for landslide inventory mapping which have some pros and cons e.g. geomorphology based landslide mapping via field can be highly accurate if supported by Global Navigation Satellite System (GNSS) and other instruments like laser rangefinder (Santangelo et al., 2010), but it is an expensive and time-consuming process and, and therefore is not applicable widely (Santangelo et al., 2010). The DTM generated by topographic maps are usually less precise because general the altitude is extracted from aerial photographs for topo maps. The accuracy of DTMs in thickly forested and built-up areas are normally depends on photogrammetry e, g, sunlight, flight height, camera and sensor type, and at least a relevant point on surface should be visible from at least two imaging locations (Kraus, 2007). However, the aerial photos The International Archives of the Photogrammetry, Remote Sensing and Spatial Information Sciences, Volume XLII-4/W5, 2017
based topo maps did not complete the criteria therefore, the representation of surface in photogrammetric DTMs of rough and wooded terrain leads to inadequate and capricious landslide inventories.
The Virtual examination based on an enormously high-resolution image by remote sensing, proved to be effective to map fresh landslides in a large forested terrain as the landslides have left very clear signs of their existence (Guzzetti et al., 2012; Razak et al., 2011a). The multispectral information is very useful for Semi-automatic detection of landslides for fresh or reactivated landslides (e.g., Mondini et al. 2011). Though, it is not very effective to characterize the old and dormant landslides under thick vegetation cover. Thus, the resulted inventory maps poorly represent the landslides in such places (Wills & McCrink, 2002; Brardinoni et al., 2003).
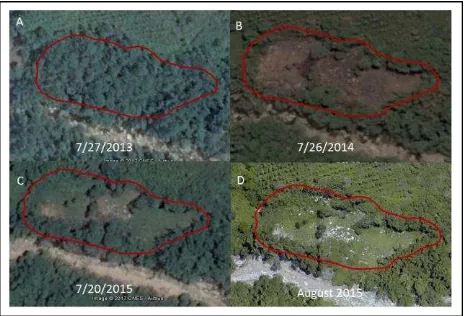
The precision of airborne laser scanning (ALS) to map vegetated dormant landslides in temperate regions is varified e.g. the Flemish Ardennes, Belgium (Van den Eeckhaut et al. 2007). Though, only a few researches assessed its suitability for landslide mapping in the tropics. In the tropical environment, the landslides are always rapidly covered by vegetation cover because of which it becomes difficult to prepare a precise landslide inventory map. Figure 1 is showing the common most scenario of landslides in Malaysia. Therefore, it is difficult to detect landslide morphological features with the help of optical satellite images and aerial photographs in tropical regions as it leads to unsatisfactory landslide inventory, which can disturb the quality of landslide susceptibility, hazard and risk analysis. Furthermore, the unsuccessfulness of field mapping method is due to limited access to data coverage and poor synoptic view, which is making this method inappropriate for regional landslide assessment.
The existing mapping techniques show considerable limitations, while a precise virtual deforested LIDAR image could provide a better intimation of morphology and drainage pattern underneath thick vegetation cover. Additionally, landslide mapping is a challenging task in a tropical mountainous environments due to rapid growth of vegetation cover within months or seasons.
Figure 1: Landslides in a tropical conditions: A) Google image of kundassang captured in 2013 (B) Google image of kundassang for the same area captured in 2014 showing slope
failer, (C) Google image of kundassang 2015 is showing the growth of vegetation cover on the slope failer. , (C) High resolution LiDAR Orthophoto of kundassang 2015 is showing
the rapid growth of vegetation cover on the slope failer.
3. STUDY AREA
The Kundasang area is located in the Sabah highlands on the southeast side of Gunung Kinabalu. Kundasang township straddles the trunk road between Tuaran and Ranau. The study area is situated in Ranau district and is an attractive tourism spot. It is located in the foot hills of the world first Heritage site Mount Kinabalu in Malaysia. There are numerous tourism sites near Kg. Mesilau e.g. Kinabalu Golf Club, Mesilou Nature Resort, and Desa Dairy Farm. The study area is located on the southern flank of Mount Kinabalu and approximate height is in between 500 to 2,000 m from mean sea level. Geomorphologically the Mesilau river valley, Kundasang is consist on river terraces and plateau. Moreover, the major activity in the area is agriculture (Sarman and Komoo, 2000). An attractive portion of the land is under plantation other than recreational and tourism (Sarman and Komoo, 2000)
The geology of the upper and lower part of the study area consists of igneous rock and sedimentary rock, respectively. The oldest igneous rock of the study area is gabbro and ultramafic, followed by granodiorite. The oldest sedimentary rock is Trusmadi Formation, Crocker Formation, and Pinosuk
Figure 2: Location map of Sg mesilau, Kundasang, Saba state of Peninsular Malaysia (Source: http://sam4605.blogspot.my/)
Gravel. Trusmadi Formation is described as strongly folded and faulted grey and dark grey argilite, slate, siltstone and sandstone with volcanics, whereas Crocker Formation is referred as strongly folded and faulted sandstone, silstone, red and grey shale, mudstone and argilite. Pinosuk Gravel is poorly consolidated unsorted gravel up to boulder size in a sandy to clayey matrix (JMG, 2003).
The dominant lithology in the study area is sedimentary rock, specifically Pinosuk Gravel as shown in Figure 1. There are two major active faults exist in the study area known as Mensaban fault and Lobo-Lobo fault segments. Mensaban fault is a normal fault trending northwest-southeast and west-east. Lobo-Lobo Fault is left-lateral strike slip fault, which trends N20°E (2007).
The topography of the research area is low-lying terrain with meanders and small flood plain. The straight channels are indication active faults. The main morphology features in study area are terraces.
Figure 3: Landslide caused by heavy rain in Kampung mesilau (Source: http//: thesundaily.my)
Figure 4: Slope fauiler at the bank of river mesilau(Source: http//:thestar.com.my).
4. MATERIAL AND METHODS
4.1 LiDAR Data Capturing And Processing
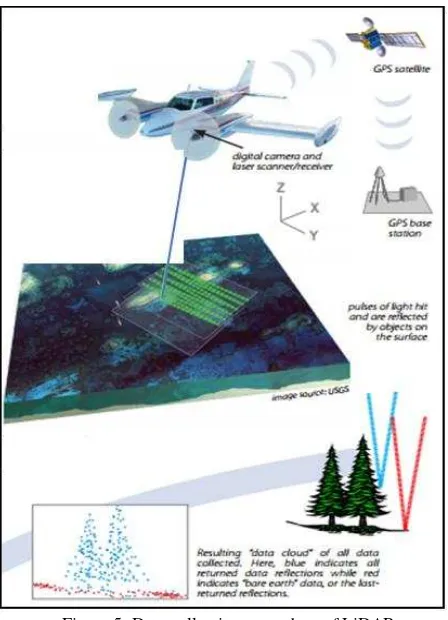
The research focused on a debris flow channel of Mesilau river valley in Kudasang located in the foothills of mount Kinabalu, Saba, Malaysia. Kundasang is recognized as one of the main geological hazardous area in Malaysia because of the abundant landslides incidences at various places (Omar S et al 2016). For inventory mapping the airborne LiDAR data was used using helicopter based RIEGL system. In this process millions of light rays are sent through each pulse, among which some reflect after hitting the top most cover of the earth (vegetation and buildings) known as ‗first return‘ or ‗full feature‘ while some reached to the ground surface known as ‗last return‘ or ‗bare -earth‘ . Furthermore, with the help of precise Global Positioning Satellite (GPS) tracking technology, the 3D (XYZ) positions of each returned light point reflected by earth can be calculated. These raw points are denoted as LiDAR ‗point cloud‘. After collecting 3D raw point cloud with the help of software and manual manipulation the orthophoto and Digital elevation model (DEM) or Digital Terrain Models (DTM) can be generated using selected points from the LiDAR point cloud.
This ‗bare-earth‘ DTM is the most interesting output of LiDAR point cloud for landslide identification. Most of the time the end users (geotechnical engineers and geologists) use the processed information in form of DTM as compare to directly working with the raw point cloud data of normally the raw LiDAR point clouds pre-processed and interpreted by the firms who collect the data because of specializing in this task.
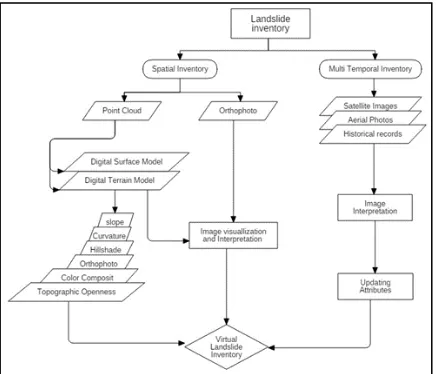
The data captured (August 2015) and processed (raw point cloud) by BUMITOUCH plmc Sdn Bhd. The 3D point clouds recorded up to 120 points per square meter which is the highest point density reported over the disaster areas in Malaysia. The processed LiDAR data comprises of classified 3D point clouds, 0.25 m digital terrain model (DTM), 0.25 digital surface model (DSM), and 0.07 m orthophoto of the debris flow area. The procedural flow of the inventory preparation is illustrated in Figure 6. The process of preparing a comprehensive inventory map is also supported by multi temporal and historical records of landslide occurrences in the study areas. This inventory has been cross checked by spatio temporal images from google pro and historical records. After the processing of LiDAR dataset by image visualization in 2D and 3D the visual interpretation in GIS environment is done.
Figure 5: Data collection procedure of LiDAR
4.2 Virtual Mapping of Landslide Inventory
Landslide inventory is the most straightforward method to assess the landslide susceptibility, highlighting the spatial distribution of landslides, symbolized either as points (small scale) or as polygons (large scale) having attribute information about type and activity. Usually the inventory maps are considered as base for the landslide susceptibility and hazard assessment process. According to Guzzetti et al. (2012) until now the landslide inventories are produced and assembled either continuous in time or based on each particular triggering event e.g, rainfall, flood and earthquake. There are four possible stages of development of a landslide is described in the literature as: i) pre-failure (strained but intact slope); ii) failure (formation of a continuous surface of rupture); iii) post-failure (after failure until stop the movement); and iv) reactivation, (movement of slope along pre-existing surfaces of rupture) (Van Den Eeckhaut et al., 2007; Hungr et al., 2012; Razak et al., 2015).
Figure 6: Procedural Flow for landslide inventory
Most of the time the dormant or inactive landslides are ignored while preparing landslide inventory database, which ultimately resultant as incomplete inventory database. This issue gains much more importance while dealing with landslides under thick forest cover and reactivated landslides (Razak et al., 2014a; Mohamad et al., 2015).
Figure 7: An example of an interpreted landslide map and its storage in GIS environment
The virtual mapping of landslide inventories with the help of very high resolution (LiDAR) images can allow to map the insight detailed characteristics of each landslide, e.g., zone of accumulation and depletion (Figure 7). Whereas zone of depletion represents the scarp refers as erosional part while the zone of accumulation represents the body of the slide where the material is deposited. Hence it is very important to identify the topography, geomorphology, geology, LULC and past landslide events of the study area to have an understand with the regional landslide process, causal and conditioning factors to interpret a landslide. The identification of landslide body types is another essential element. Usually the shape of the body either it is accumulation part of scarp of the slide varies depending on the type and activity of the landslide. An active landslide generally has semi-circular shape with visible tension crack at the scarp. While old or dormant landslide mostly represented by a perfect semi-circular shape. However, in some cases, for complex landslide, the scarp has incomplete semi-circular shape because due to overlapped and erased by another scarp. To identify the accumulation area of the landslide it is important to count the
shape of which normally looks like hummocky and bowl-shaped feature. Along the river banks, non-forested and developed areas, the accumulation area cannot be clearly seen as the displaced material is frequently removed after the event, either by river water or manually. That‘s why the delineation of accumulation area is quite challenging task.
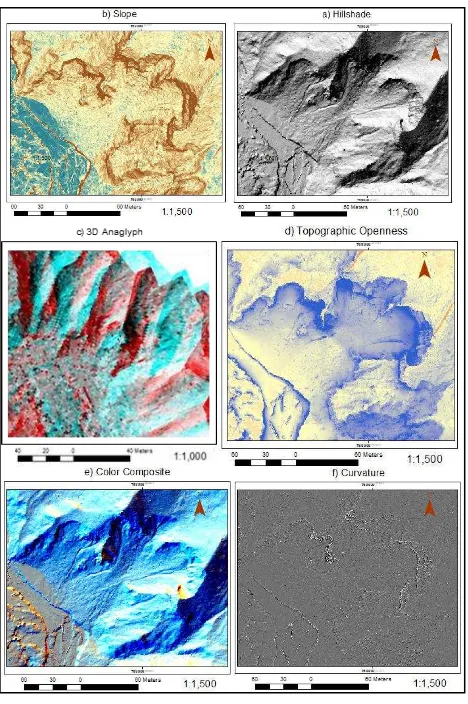
Several material and methods have been used to identify landslide in natural terrain. The high-quality dataset includes, (0.07m) orthophoto, (0.25m) DTM which is further used to generate the LiDAR derivatives such as hillshade, color composite, 3D anaglyph, Slope, contour etc. to visualize landslide in multiple modelling view by using standard tools in the ArcGIS, ILWIS, SAGA-GIS, and QGIS Software. Landslide identification is performed by visual analysis and interpretation of the representation of the topographic surface on all the above-mentioned DTM derivatives. Each landslide is characterized based on type, activity and process in attribute table and systematically stored in geodatabase. The historical landslides are interpreted and mapped from historical images of Google pro for five years (2008, 2012, 2013, 2014, 2016).
4.3 LiDAR Processing for Visualization
The importance of high resolution LiDAR image cannot be denied during identification and classification of landslide through Image visualization. The LiDAR-derived datasets are re-processed to improve the visualization in 2D and 3D models using open-source and commercial software‘s. The important most LiDAR-derivative for visualization is a default hillshade. Hillshade is a 3D representation of the surface in grayscale, with the relative position of sun, considered for shading the image. This function uses the altitude and azimuth properties (azimuth: 315, altitude: 45) to specify the sun's position. Hillshade image along with slope and curvature images are utilized for a better visualization and interpretation. In slope image, steep slope indicates the scarp or depletion zone and flatter slope can be indicated as body or accumulation zone. Moreover, in curvature image, concave slope denotes as denudation and scarp area and convex slope specifies debris or accumulation zone.
An advanced mode of visualization is utilized known as topographic openness, generated in SAGA-GIS software from digital terrain models (DTM). The Positive values of openness signifies convex topography and negative values of openness shows concave topography (Yokoyama et al., 2002). Another important visualizing technique based on LiDAR-derived DTM is color composite image (Razak et al., 2011). This technique converts the one color DTM into a combination of three shades of color (red, green, and blue), indicating the solar illumination of the image in three directions compared to the conventional hillshade.
A high-resolution 3D orthophoto (0.7m) from LiDAR is used to identify recent landslide and observe the morphological- and geological features along with geo-indicators in forested terrain. These visualization techniques generate 2-D outputs for landslide interpretation. The 3D anaglyph image generated in SAGA-GIS by creating stereo pair images from DTM is another possibility of visualization and interpretation of landslide. It is used to visualize landslide in 3D by highlighting the depth of landslide to differentiate between deep-seated and shallow landslides using 3-D glasses. These visualization techniques increased the accuracy of inventory map.
Figure 8: LiDAR derivatives used for interpretation and mapping of landslide inventory.
4.4 Landslide Interpretation through LiDAR Derivatives
The availability of high resolution data gains much importance in the visual interpretation of Landslides now days. All the LiDAR derivatives mentioned above are used to interpret the landslides precisely. Google pro images are used as data source to visualize the old or dormant landslides. In this study, a landslide geodatabase consists of landslide ID, body, type, activity and speed of movement, has been developed. Body attributes consist of scarp area, accumulation area (Figure: 7). Landslide types further divided in to shallow, flow, deep-seated, and rockfall. Under the Activity attribute the current state of landslide e.g. active, dormant, or stable is mentioned. The speed of movement of landslide divided in to two i.e. slow and fast. To interpret the landslides in the study area first geomorphology, geology, Landuse/ landcover (LULC), past landslide events, and topography of the study area were studied and mapped to understand regional landslide process in the area. The causal and conditioning factors were determined based on seismicity, climate, hydrology and topography. The parts of landslide body were interpreted and polygonised. Each landslide consists of two polygons as mentioned before (Figure: 7) though, the shape of polygon varies according to the type of the landslide. The Fresh, landslides generally have tension cracks at the scarp. Dormant or old landslide indicates a seamless semi-circular shape. The incomplete semi-circular shape of scarps indicates complex landslide because of overlapping and removal by the recent scarps. After delineating
the scarp of a landslide, the body or accumulation zone identified. The delineating accumulation area is quite challenging on steep slopes in the study area, because the accumulation or body is not distinctly seen. The displaced material frequently removed or washed out with rain or river etc.
5. RESULTS
The study area covers 5km middle channel of river Mesilou. The availability of high resolution LIDAR data, solved many issues and challenges faced by landslide inventory mapping in the past decades. The major finding of the study is that the ―bare earth‖ images increased the visual interpretation of active as well as dormant landslides in dense forest many times. Indeed, the mapping and monitoring of tropical landslides with rapid growth of vegetation cover is not out of coverage now a day. The detailed mapping of forested terrain through ALS and TLS data improved the ability of mapping landslides inventories, which eventually effects the quality of susceptibility, hazard and risk maps in the country.
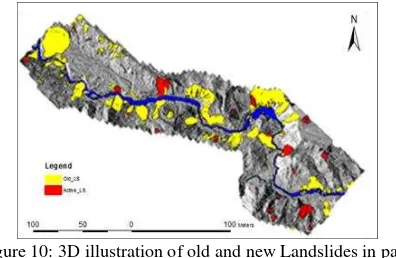
A detailed multi temporal landslide inventory is produces and stored in ArcGIS geodatabase by observing multi temporal satellite images and historical record as well as literature. It is concluded that the change in LULC is the main cause of landslides for the activation of landslides in the study area. The conversion of forest in agriculture is greatly contributing in the activation of landslide because of loose morphology of the area. The disconnected roads (Figure 9-A) along debris flow channel is very common impact of landuse change at Mesilau valley. The river Mesilau itself is contributing much in destabilizing the land by cutting the ground on meanders (Figure 9-B) and caused activation of landslides in most of the cases. (Figure 1) shows images of before, during and after the landslides event. It is desperately found that most of the houses are constructed either on the scarp or accumulation zone of the old landslides increasing the vulnerability to life and property. The damage in infrastructure e,g. roads and houses reveal the important of landslide inventory using VHR for land-use planning to avoid future life and property damages. From figure 10 It is very clear that the density and intensity of landslides is greater along the river bank and agriculture area as compare to the others. landslide inventory has been produced with the help of LiDAR-derivatives for the study area. The inventory is further upgraded by using multi temporal images from google pro, historical landslide records, news and literature etc. The visualization and interpretation techniques are based on plan curvature, hill shade image, color composite image, Slope image, topographic openness image, orthophoto and 3D anaglyph (Figure: 8).
These layers are used altogether to visualize and interpret the morphology of landslide e.g. scarp, body, concave-convex, type and topography. Though each individual image has some Pros and cons e.g. color composite image is brightening and its visual exposure is more as compare to the hillshade as it has shaded area in various perspectives. However, landslide scarp is sharply identifiable in topographic openness images (Figure 8). The visual interpretation of landslide is only possible through very high-resolution images as it is minor feature having significant impact on earth surface. LiDAR data is opening new horizons in the landslide investigations.
Figure 9: Diagnostic features of landslides in different morphological conditions.
Geomorphic features are playing key role in the interpretation of landslides e.g. from ortho photo fresh landslides can easily distinguished by observing vegetation pattern, river course, and anthropogenic features. Slope, color composite and topographic openness are good while interpreting the parts of landslide body. The color and bend of vegetation cover can also help in predicting landslides and for this purpose ortho photo play excellent role e, g. the tree density and pattern at the scarp and body have much different from each other. The vegetation color is darker in the scarp area as compare to body.
The tilt of the trees and the height of the vegetations are signs of fresh landslides. The difference of color in slope is also an
Figure 10: 3D illustration of old and new Landslides in part of Mesilau river valley.
indicator for recognizing scarp and body as the high and genital slope have distinct color tone. Another important predictor is curvature which is scale-dependent, and a suitable scale for
derivation of the geometry must be selected according to the scale of the features on ground to be detected. This method is very powerful to inevitably highlighting the location of shallow landslides and bank erosion, however by strong observation of interpreter it is possible to correctly recognize and outline the singularities. The brown patch is indicator of fresh slides on ground can easily be seen from very high resolution orthophotos. Consequently, there are numerous visualizing methods highlighting in the literature which can be helpful in the interpretation of landslides on a VHR images. The interpretation of LiDAR-derived datasets for landslide detection differs based on the accessibility and resolution of the dataset.
6. DISCUSSION AND CONCLUSION
From the observations and ground facts it is found that the slope failure in the research area is dominantly influenced by heavy rain followed by ground shaking incidences time to time. The major activity in the area is agriculture which is playing additional role in slope failure by making the material loose and pores. Landslide mapping via remote sensing techniques and are more efficient as compare to the field mapping in dense tropical forests and rugged mountains. It is an efficient way of producing and upgrading the event-based landslide inventory. The interpretation for landslides utilizing various image visualization techniques is helpful in preparing a precise and update inventory as compare to rely on single interpretation technique e.g. hillshade image. The VHR LiDAR helps to visualize and interpret landslides precisely because of its high visibility for minor features. The virtual mapping of landslides is more efficient as compare to paper mapping in several ways e.g. i) it can have visualized on multi scales, ii) Maps can easily upgraded and printed any time, iii) rapid mapping of new events in case of emergency for disaster evacuation and relief etc.
Landslide interpretation via LiDAR-derivatives is not only efficient in interpretation of fresh and active event but also having the ability of identify the historical landslides e.g. the topographic openness is providing a very clear view of dormant morphological disturbances on even small scale. made possible to map and characterize recent landslide induced by earthquake, dormant, and historical landslides. It is also efficient in highlighting the disrupted drainages, small to medium crake‘s due to ground acceleration and cracked- and displaced roads. The addition of LiDAR dataset as primary tool, of field investigation is quite beneficial but still challenging due to its cost and sensitivity. It is proved from the study that the LiDAR dataset is highly beneficial in field investigations for interpreting and verifying landslides on various scales. Based on landslide inventory it is very clear that the concentration of landslide is high in river incision areas, fault zones. The weak the lithology (Pinosuk Gravel) and presence of active faults (Mensaban Fault, Lobo-Lobo Fault) is a proof that the landslide activity in the Mesilau valley is dominantly controlled by structural and geological factors. The transport lines are more vulnerable in the area because of manual disturbance in to natural terrain for the construction of roads.
The paper presents the virtual mapping of landslide inventory in a loose morphology and tectonically active area in Mesilau, Kundasang (Borneo, Malaysia). It is an effort to contribute in disaster risk management activities facing by the community of Mesilau valley. The landslide inventory is mainly based on VHR airborne LiDAR coupled with temporal data and historical records in literature. LiDAR derivatives have transformed the The International Archives of the Photogrammetry, Remote Sensing and Spatial Information Sciences, Volume XLII-4/W5, 2017
assessment of hillslopes, morphology and structure in tropical conditions. Landslide interpretation and identification through LiDAR dataset along with geology, and topography revolutionized the landslide investigations. Field observation is getting easier and less time consuming by utilizing LiDAR data as field tool because of its wide-ranging characteristics in terms of scale, precision and exposure. There is still more room to enhance methods of preparing virtual landslide inventories by utilizing LiDAR datasets for disaster prone areas to cope with emergency situations. This study is an effort to capture the landslide activity in a part of Mesilau valley to contribute the inputs for planning and decision making at policy level for the mitigation action. As mentioned before that the change in LULC is destabilizing the geologically weak area of Mesilau valley that‘s why the landuse planning should be taken into consideration. The usefulness of landslide inventories for hazard, risk assessment and mitigation action cannot be denied.
REFERENCES
Abellan A, Vilaplana JM, Calvet J, Blanchard J., 2010. Detection and spatial prediction of rockfalls by means of terrestrial laser scanning modelling. Geomorphology 119:162– 171. doi:10.1016/j.geomorph. 2010.03.016
Ardizzone F, Cardinali M, Galli M, Guzzetti F, Reichenbach P., 2007. Identification and mapping of recent rainfall-induced landslides using elevation data collected by airborne Lidar. Nat Hazards Earth Syst Sci 7:637–650. doi:10.5194/nhess-7-637-2007
Bateson, L., Cigna, F., Boon, D., Sowter, A., 2015. The application of the Intermittent SBAS (ISBAS) InSAR method to the South Wales Coalfield, UK. Int. J. Appl. Earth Obs. Geoinf. 34, 249–257.
Bianchini, S., Cigna, F., Del Ventisette, C., Moretti, S., Casagli, N., 2013. Monitoring landslide-induced displacements with TerraSAR-X Persistent Scatterer Interferometry (PSI): Gimigliano Case Study in Calabria Region (Italy). Int. J. Geosci. 4 (10). http://dx.doi.org/10.4236/ijg.2013.410144
Bibi, T., Gul, Y., Rahman, A.A., Riaz, M., 2016. Landslide susceptibility assessment through fuzzy logic inference system (flis). Remote Sens. Spat. Inf. Sci. 42, 355e360. http://dx.doi.org/10.5194/isprs-archives-XLII-4-W1-355-2016. Booth AM, Roering JJ, Perron JT., 2009. Automated landslide mapping using spectral analysis and high-resolution topographic data: puget Sound lowlands, Washington, and Portland Hills, Oregon. Geomorphology. 109:132–147. DOI: 10.1016/j.geomorph.2009.02.027.
Brardinoni, F., Slaymaker, O., and Hassan, M. A.: Landslide inventory in a rugged forested watershed: A comparison between air-photo and field survey data, Geomorphology, 54, 3–4, 179– 196, 2003.
Carter W, Shrestha R, Tuell D, Bloomquist D, Sartori M., 2001. Airborne laser swath mapping shines new light on earth‘s topography. Eos, Trans, Am Geophys Union 82(46):549, 550, 555
Carrara, A., Cardinalli, M., Guzzetti, F. & Reichenbach P., 1995. GIS technology in mapping landslide hazard.
Geographical Information Systems in Assessing Natural Hazards, 5, 135−175. DOI: 10.1007/978-94-015-8404-3_8.
Carnec C, Massonnet D, King C., 1996 Two examples of the use of SAR interferometry on displacement fields of small spatial extent. Geophys Res Lett 23(24):3579–3582. doi:10.1029/96GL03042
Chen RF, Lin CW, Chen YH, He TC, Fei LY., 2015. Detecting and characterizing active thrust fault and deep-seated landslides in dense forest areas of Southern Taiwan using airborne LiDAR
DEM. Remote Sens. 7:15443–15466.
DOI:10.3390/rs71115443.
Chigira M, Duan F, Yagi H, Furuya T., 2004. Using an airborne laser scanner for the identification of shallow landslides and susceptibility assessment in an area of ignimbrite overlain by permeable pyroclastics. Landslides. 1:203–209. DOI:10.1007/s10346-004-0029-x.
Ciampalini, A., Raspini, F., Frodella, W., Bardi, F., Bianchini, S., Moretti, S., 2015. The effectiveness of high-resolution LiDAR data combined with PSInSAR data in landslide study. Landslides, 1–12. http://dx.doi.org/10.1007/s10346-015-0663-5.
Colesanti C, Ferretti A, Prati C, Rocca F., 2003 Monitoring landslides and tectonic motions with the permanent scatterers technique. Eng Geol 68:3–14.
doi:10.1016/S0013-7952(02)00195-3
Cruden,D.M., Varnes, D.J., 1996. Landslide Types and Processes, Special Report , Transportation Research Board, National Academy of Sciences, 247:36-75
Del Ventisette, C., Righini, G., Moretti, S., Casagli, N., 2014. Multitemporal landslides inventory map updating using spaceborne SAR analysis. Int. J. Appl. Earth Obs. Geoinf. 30 (1), 238–246.
EM-DAT., 2011. The CRED International Disaster Database,
Natural Disasters Trends.
http://www.emdat.be/naturaldisasters-trends.
Freeborough, K. A., Diaz Doce, D, Lethbridge, R, Jessamy, G, Dashwood, C, Pennington, C, and Reeves, H. J., 2016. Landslide Hazard Assessment for National Rail Network: The 3rd International Conference on Transportation Geotechnics (ICTG 2016), Volume 143, 2016, Pages 689–696.
Fruneau B, Achache J, Delacourt C., 1996. Observation and modelling of the Saint-E´tienne-de-Tine´e landslide using SAR interferometry. Tectonophysics 265(3–4):181–190. doi:10.1016/S0040-1951 (96)00047-9
Glade, T. & Crozier, M.J., 2005. The nature of landslide hazard and impact. In: Glade, T., Anderson, M. G. & Crozier, M.J. (Eds), Landslide Hazard and Risk. Wiley, London, pp. 43 - 74.
Gordon S, Lichti D, Stewart M., 2001 Application of a high-resolution, ground-based laser scanner for deformation measurements. In: Proceedings of the 10th international FIG The International Archives of the Photogrammetry, Remote Sensing and Spatial Information Sciences, Volume XLII-4/W5, 2017
symposium on deformation measurements, Orange, California, USA, 19–22 March 2001, pp 23–32
Greif, V., Vlcko, J., 2012. Monitoring of post-failure landslide deformation by the PSInSAR technique at Lubietova in Central Slovakia. Environ. Earth Sci. 66, 1585–1595.
http://dx.doi.org/10.1007/s12665-011-0951-x.
Guzzetti, F., Mondini, A.C., Cardinali, M., Fiorucci, F., Santangelo, M., & Chang, K.-T., 2012. Landslide inventory maps: New tools for an old problem. Earth-Sci. Rev., 112: 42-66. DOI: 10.1016/j.earscirev.2012.02.001.
Havlín, A., Bednarik, M., Magulová, B. & Vlčko J., 2011. Using logistic regression for assessment of susceptibility to landslides in the middle part of Chřib (Czech Republic) (in Czech). Acta Geologica Slovaca, 3(2), 153−161.
Haugerud R. A, Harding DJ, Johnson SY, Harless JL, Weaver CS, Sherrod BL., 2003. High-resolution lidar topography of the Puget Lowland, Washington—A Bonanza for earth science. GSA Today 13:4–10
Hölbling D, Füreder P, Antolini F, Cigna F, Casagli N, Lang S., 2012. A semi-automated object-based approach for landslide detection validated by persistent scatterer interferometry measures and landslide inventories. Remote Sens. 4:1310– 1336. DOI:10.3390/rs4051310.
Hungr, O., Leroueil, S., & Picarelli, L., 2012. Varnes classification of landslide types, an update. In: Eberhardt, E., Froesse, C., Turner, A.K. & Leroueil, S. (eds) Landslides and engineered slopes: protecting society through improved
understanding, vol 1. CRC Press, Boca Raton: 47–58
http://sam4605.blogspot.my/ (2009) map-kundasang-kundasang-war-memorial.html).
http//: thestar.com.my/news/nation/2015/06/26/things-go-sour- for-strawberry-farm-earthquaketriggered-landslide-brings-successful-business-crashing/ )
Ibsen, M. & Brunsden, D., 1996. The nature, use and problems of historical archives for the temporal occurrence of landslides, with specific reference to the south coast of Britain, Ventnor, Isle of Wight. Geomorphology 15: 241–258.
Jaboyedoff M, Oppikofer T, Abellán A, Derron MH, Loye A, M etzger R, Pedrazzini A., 2012. Useh of LIDAR in landslide investigations: a review. Nat Hazards. 61:5–28. DOI:10.1007/s11069-010-9634-2.
Jaboyedoff M, Oppikofer T, Locat A, Locat J, Turmel D, Robitaille D, Demers D, Locat P., 2009a. Use of ground-based LIDAR for the analysis of retrogressive landslides in sensitive clay and of rotational landslides in river banks. Can Geotech J 46:1379–1390. doi:10.1139/T09-073
Jaboyedoff M, Pedrazzini A, Horton P, Loye A, Surace I., 2008a., Preliminary slope mass movements susceptibility mapping using LIDAR DEM. In: Proceedings of 61th Canadian geotechnical conference, pp 419–426
JMG. Geological Terrain Mapping of the Kundasang Area,
Sabah. 2003.
Jing, W., Yang, Y., Yue, X., and Zhao, X., 2016. A
Comparison of Different Regression Algorithms for
Downscaling Monthly Satellite-Based Precipitation over
North China. Remote Sens. 2016, 8(10), 835;
doi:10.3390/rs8100835.
K. Kraus, Photogrammetry: Geometry from Images and Laser Scans (de Gruyter, 2007).
Li X, Cheng X, Chen W, Chen G, Liu S., 2015. Identification of forested landslides using LiDar data, object-based image analysis, and machine learning algorithms. Remote Sens. 7:9705–9726. DOI:10.3390/rs70809705.
Lin ML, Chen TW, Lin CW, Ho DJ, Cheng KP, Yin HY, Chen MC., 2014. Detecting large-scale landslides using LiDar data and aerial photos in the Namasha-Liuoguey area, Taiwan. Remote Sens. 6:42–63. DOI:10.3390/rs6010042.
Mahalingam R, Olsen MJ., 2015. Evaluation of the influence of source and spatial resolution of DEMs on derivative products used in landslide mapping. Geomat Nat Haz Risk:1–21. DOI:10.1080/19475705.2015.1115431.
Mantovani, M., Devoto, S., Piacentini, D., Prampolini, M., Soldati, M., Pasuto, A., 2016. Advanced SAR interferometric analysis to support geomorphological interpretation of slow-moving coastal landslides (Malta, Mediterranean Sea). Remote Sens. 8 (6), 443.
Martha, T.R., Kerle, N., Jetten, V., van Westen, C., & Vinod Kumar, K., 2010. Characterising spectral, spatial and morphometric properties of landslides for semi-automatic detection using object-oriented methods. Geomorphology 116: 24–36.
Mohamad, Z., Razak, K.A., Ahmad, F., Abdul Manap, M., Ramli, Z., Ahmad, A., & Mohamed, Z., 2015. Slope hazard and risk assessment in the tropics: Malaysia‘s experience. Geophys.
Res. Abstr., 17: EGU2015- 7746.
Mondini, A.C., Chang, K.T., Yin, H.Y., 2011a. Combining multiple change detection indices for mapping landslides triggered by typhoons. Geomorphology 134 (3–4), 440–451. doi:10.1016/j.geomorph.2011.07.021
Omar S., Mohamed Z., Razak K.A., 2016. Landslide Mapping Using LiDAR in the Kundasang Area: A Review. In: Yusoff M., Hamid N., Arshad M., Arshad A., Ridzuan A., Awang H. (eds) InCIEC 2015. Springer, Singapore
Oppikofer T, Jaboyedoff M, Keusen HR., 2008. Collapse at the eastern Eiger flank in the Swiss Alps. Nat Geosci 1:531–535. doi:10.1038/ngeo258.
Pradhan B, Latif ZA, Aman SNA., 2012. Application of airborne LiDAR-derived parameters and probabilistic-based frequency ratio model in landslide susceptibility mapping.
AMM. 225:442–447.
DOI:10.4028/www.scientific.net/AMM.225.442.
PWD (Public Works Department)., 2009. National Slope
Master Plan 2009 - 2023. Public Works Department (PWD),
Malaysia.
Petley, D.N., 2011. The landslide blog. http://blogs.agu. org/landslideblog/ .
Razak, K. A. and Mohamad, Z., 2015. Methodological Framework for Landslide Hazard and Risk Mapping using Advanced Geospatial Technologies: Malaysian journal of Remote Sensing and GIS. Vol. 4 Num. 2 Year 2015 ISSN: 1511-7049.
Razak, K.A., Mohamed, Z., Che Hasan, R., Aitin, A., Sheng, L.C., Abu Bakar, R., & Wan Mohd Akib, W.A.A., 2014a. Multi sensor lidar for hillslope geomorphology mapping: A step forward to geospatializing natural disaster in Malaysia. 7th AUN/SEED-Net Geological Engineering Conference (AGEC) and 2nd AUN/SEED- Net Natural Disaster Conference
(ANDC), 29-30 September 2014. University of Yangon,
Yangon, Myanmar.
Razak, K.A., Straatsma, M.W., van Westen, C.J. & de Jong, S.M., 2011a. Airborne laser scanning of forested landslides characterization: Terrain Model and visualization.
Geomorphology, 126: 186-200.
Razak, K.A., van Westen, C.J., Straatsma, M.W., & de Jong, S.M., 2011b. Mapping of elements at risk for landslides in the tropics using airborne laser scanning. In: FIG working week 2011: bridging the gap between cultures: Technical
programme and proceedings, Marrakech, Morocco, 18-22 May
2011. 16 p.
Roback, K., Clark, M. K., West, A. J., Zekkos, D., Li, G., Gallen, S. F., Chamlagain, D., Godt, J. W., 2017. The size, distribution, and mobility of landslides caused by the 2015 Mw7.8 Gorkha earthquake, Nepal, Geomorphology (2017), http://dx.doi.org/10.1016/j.geomorph.2017.01.030
Rott, H., 2009. Advances in interferometric synthetic aperture radar (InSAR) in earth system science. Prog. Phys. Geogr., 33: 769-791.
Santangelo, M., Cardinali, M., Rossi, M., Mondini, A.C., Guzzetti, F., 2010. Remote landslide mapping using a laser rangefinder binocular and GPS. Natural Hazards and Earth System Sciences 10, 2539–2546. doi:10.5194/nhess-10-2539-2010.
Sarman M, Komoo I. Kundasang-Ranau : Dataran Warisan Ais
Gunung. Geol. Soc. Malaysia Annu. Geol. Conf., 2000.
Scaioni M, Longoni L, Melillo V, Papini M., 2014. Remote sensing for landslide investigations: an overview of recent achievements and perspectives. Remote Sens. 6:9600–9652. DOI:10.3390/rs6109600.
Schulz WH., 2007. Landslide susceptibility revealed by LIDAR imagery and historical records, Seattle, Washington. Eng Geol. 89:67–87. DOI: 10.1016/j.enggeo.2006.09.019.
Singhroy V., 2009. Satellite remote sensing applications for landslde detection and monitoring. In: Sassa K, Canuti P (eds) Landslides—disaster risk reduction. Springer, Berlin/Heidelberg, pp 143–158
Slob S, Hack R., 2004. 3D terrestrial laser scanning as a new field measurement and monitoring technique. In: Engineering geology for infrastructure planning in Europe: a European
perspective, Lectures Notes in Earth Sciences, Springer, Berlin/Heidelberg, 104:179–189
Squarzoni C, Delacourt C, Allemand P., 2003. Nine years of spatial and temporal evolution of the La Valette landslide observed by SAR interferometry. Eng Geol 68:53–66. doi:10.1016/S0013-7952(02)00198-9
Stow R., 1996 Application of SAR interferometry to the imaging and measurement of neotectonic movement applied to mining and other subsidence/downwarp modeling. In: Fringe 96 proceedings ESA workshop on applications of ERS SAR interferometry, Zurich, Switzerland.
Tarchi D, Casagli N, Fanti R, Leva DD, Luzi G, Pasuto A, Pieraccini M, Silvano S., 2003. Landslide monitoring by using ground-based SAR interferometry: an example of application to the Tessina landslide in Italy. Eng Geol 68:15–30. doi:10.1016/S0013-7952(02)00196-5
Teza G, Galgaro A, Zaltron N, Genevois R., 2007. Terrestrial laser scanner to detect landslide displacement fields: a new approach. Int J Remote Sens 28:3425–3446. doi:10.1080/01431160601024234.
Tjia HD. Kundasang ( Sabah ) at the intersection of regional
fault zones of Quaternary age. Geol Soc Malaysia 2007;53:59–
66.
Van Den Eeckhaut, M., Kerle, N., Poesen, J., & Hervas, J., 2012. Object-oriented identification of forested landslides with derivatives of single pulse LiDAR data. Geomorphology, 171-174: 30-42.
Van Den Eeckhaut, M., Muys, B., Verstraeten, G., Vanacker, V., Nyssen, J, Moeyersons, J., Van Beek, L.P.H., & Vandekerckhove, L., 2007. Use of LIDAR-derived images for mapping old landslides under forest. Earth Surf. Proc. Land., 32: 754-769.
Vallet J, Skaloud J., 2004. Development and experiences with a fully-digital handheld mapping system operated from a helicopter. Int Archi Photogramm Remote Sens 35(B5):791– 796
Van Westen CJ, Van Asch TWJ, Soeters R., 2006. Landslide hazard and risk zonation—why is it still so difficult? Bull Eng Geol Environ 65:67–184. doi:10.1007/s10064-005-0023-0
Wang G, Joyce J, Phillips D, Shrestha R, Carter W., 2013. Deli neating and defining the boundaries of an active landslide in the rainforest of Puerto Rico using a combination of airborne and terrestrial lidar data. Landslides. 10:503–513. DOI:10.1007/s10346-013-0400-x.
Wills, C. J. and McCrink, T. P.: Comparing landslide inventories: The map depends on the method, Environ. Eng. Geosci., 8, 4, 279–293, 2002.