Siloam Hospital Internasional
Waiting for growth acceleration in 2H14
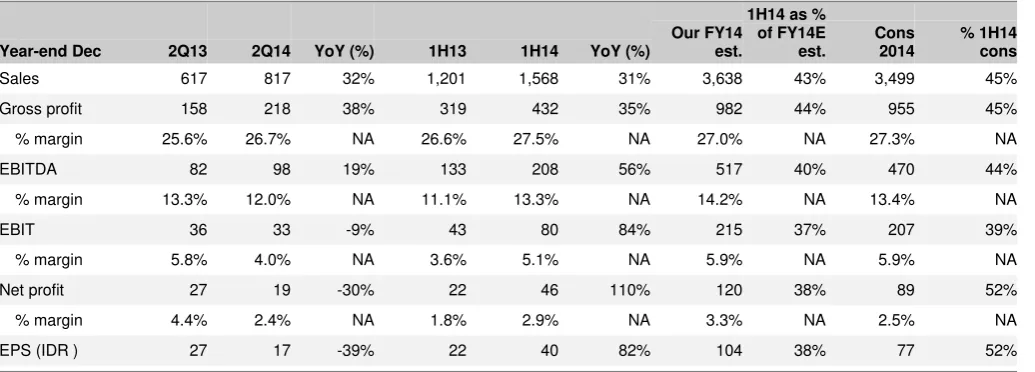
Siloam’s
revenue growth 2Q14 was in line with our and
consensus estimates. However, net profit came in below
our forecast, due to weaker-than-expected margins at some
of its key hospitals.
2Q14 results meet consensus.
Revenue was in line with our and
consensus estimates, accounting for 22% and 23%, respectively,
of full-year estimates. Net profit was in line with consensus (22% of
2014 estimates), but met only 16% of our full-year figure. Our initial
forecasts exceeded consensus, because we expected greater
operating leverage
–
as eight new hospitals (2012-13 vintage)
ramp up this year
–
and lower finance costs in 2014. We think
Siloam could still deliver strong 42% YoY revenue growth in 2014.
Mixed margin performance in 2Q14.
Siloam’s overall
2Q14
EBITDA margin of 12.0% was below our expectation of 14.2%.
EBITDA margins at two mature hospitals, Kebon Jeruk and
Surabaya, were 3-5ppt weaker QoQ at 13-15% in 2Q14, compared
to 16-20% in 1Q. Similarly, EBITDA margin at the Mochtar Riady
Comprehensive Cancer Centre (MRCCC) was lower than expected
at 2.2% in 2Q14 (1H14: 5.5%), compared with our assumption of
13-16% in 2014. Based on our margin assumption adjustments, we
lower our 2014-15E EBITDA margin by 20-30bps, translating into a
2-7% cut in our 2014-15E earnings.
Higher finance costs than expected.
Siloam’s interest expense
in 1H14 amounted to IDR 24bn (66% of our 2014 estimate). We
increase our effective interest rate assumption by 100bps to 12.5%
in 2014 and 11.5% in 2015. This adjustment accounts for the
remaining 1-2% cut in our 2014-15 earnings estimates.
Maintain IL; buy on any major pullback.
Siloam trades at 22.4x
2015E EV/EBITDA, and our PT offers 6% upside. We see Siloam
as a long-
term buy for exposure to Indonesia’s rapi
dly growing
healthcare market. Any strong pullback would be a good
opportunity to accumulate the leader of
Indonesia’s private hospital
31 July 2014 2
2Q14 results highlights
Siloam’s 2Q14 results were in line with consensus
, but below our estimates. Its 1H14
net profit met 52% of the consensus estimate, but only 38% of our forecast. We had
initially expected a stronger operating leverage than the street in 2014. We prudently
lower our 2014E EBITDA to IDR 506bn, which is close to management
’s
guidance of
IDR 508bn.
Source: Company, Standard Chartered Research
Revenue ramp-up is on track:
Siloam’s 2Q14 revenue was in line with our and
consensus estimates, at 22% and 23% of full-year 2014 estimates. Its revenue per
inpatient and revenue per outpatient rose up to 26% and up to 50% YoY,
respectively. We believe revenue growth will continue to pick up in 2H14 as patient
volume and revenue per patient ramp up at its younger vintage hospitals.
Management has indicated that 2H14 revenue growth will be stronger than 1H.
Figure 2: Revenue per inpatient
Figure 3: Revenue per outpatient
Weaker margins at some mature hospitals:
Siloam’s
consolidated 2Q14
EBITDA margin of 12.0% was below our expectation of 14.2%. We believe this is
attributable to weaker-than-expected margins at some of its mature hospitals (60%
of revenue in 2013) and at MRCCC (13% of revenue in 2013). EBITDA margins at
two mature hospitals, Kebon Jeruk and Surabaya, were 3-5ppt weaker QoQ at
13-15% in 2Q14, compared to 16-20% in 1Q14. EBITDA margin at Cikarang hospital
may have been weaker due to higher rental costs (this hospital has a base rent of
IDR 25bn p.a.), as Siloam said that it paid IDR 16bn in rent in 1H14 (+33% YoY).
Similarly, EBITDA margin at MRCCC was lower than expected at 2.2% in 2Q14
(1H14: 5.5%), compared to our assumption of 13-16% for 2014. We believe this
could be due to a changing case mix, as the volume of general cases could have
risen faster than specialist cancer cases at MRCCC.
Good margin pick-up at new hospitals:
One bright spot in the 2Q14 results is
that the ramp-up of its younger hospitals (established in 2012-13) is proceeding as
planned. We estimate the EBITDA margins at these newer hospitals at 9.5% in
2Q14, largely in line with our forecast of 10% for 2014. We see this as positive, as
it comes amid signs of weakness at
Siloam’s more established hospitals.
EBITDA margin assumption adjustments:
We temper our margin expectations
by 20-30bps for 2014-15, and lower our occupancy estimates for several key
hospitals, leading to a 2-7% cut in our 2014-15E earnings. We should note that
there are upside risks to our revised forecast if the margin weakness at some of
Siloam’s mature hospitals prove
s to be seasonal, due to Ramadan, which came
right after the long school holidays in June.
Higher finance cost than expected:
Siloam’s interest expense in 1H14
amounted to IDR 24bn (66% of our 2014 estimate). We increase our effective
interest rate assumption by 100bps to 12.5% in 2014 and 11.5% in 2015. This
adjustment accounts for the remaining 1-2% cut in our 2014-15E earnings.
31 July 2014 4
Reiterate In-Line
Our DCF-derived price target of IDR 15,100 (from IDR 15,137) translates into 23x
2015E EV/EBITDA and offers a 6% upside potential.
DCF valuation
We value Siloam based on DCF methodology, given its relatively predictable cash
flows from the hospital services business. Our DCF-derived price target assumes a
risk-free rate of 8.5%, cost of debt of 11.5%, equity risk premium of 6%, beta of 1.0x,
target debt to firm value of 0% and implied weighted average cost of capital of 14.5%.
Figure 4: DCF valuation
Stage 1: Explicit 2013-23E 2013 2014E 2015E 2016E 2017E 2018E 2019E 2020E 2021E 2022E 2023E
EBIT 79 192 338 606 950 1,562 2,128 2,949 3,664 4,414 5,422
Change YoY -14% 144% 76% 80% 57% 64% 36% 39% 24% 20% 23%
EBIT margin 3% 5% 6.5% 8.2% 9.4% 11.4% 12.8% 14.1% 15.1% 15.7% 16.9%
EBIT (1-tax) 59 144 253 455 712 1,171 1,596 2,212 2,748 3,311 4,067
(+) Depreciation and amortisation 233 303 446 588 737 854 945 1,022 1,077 1,128 987
(-) Change in working capital (67) (97) (120) (165) (196) (267) (226) (315) (265) (287) (316)
(-) Capital expenditure (598) (829) (1,124) (1,139) (1,192) (1,110) (1,004) (1,041) (1,061) (1,188) (1,228)
Unleveraged free cash flow (373) (480) (545) (261) 62 648 1,310 1,878 2,499 2,963 3,509
Discount factor 0.95 0.83 0.72 0.63 0.55 0.48 0.42 0.37 0.32 0.28
Present value of FCFs (453) (450) (188) 39 356 629 788 916 949 981
Stage 2: 2023-33E 2024E 2025E 2026E 2027E 2028E 2029E 2030E 2031E 2032E 2033E
Unleveraged free cash flow 3,808 4,131 4,482 4,863 5,277 5,725 6,212 6,740 7,313 7,934
Discount factor 0.24 0.21 0.19 0.16 0.14 0.12 0.11 0.09 0.08 0.07
Present value of FCFs 930 881 835 792 750 711 674 638 605 573
Stage 3: Terminal
Terminal value 98,948
Discount factor 0.07
Present value of terminal value 7,152
Equity value Growth rates assumptions WACC assumptions
DCF of operations: Stage 1 3,568 Stage 1: 2013-23E NM Risk-free rate 8.5%
DCF of operations: Stage 2 7,391 Stage 2: 2024-33E 8.5% Cost of debt 11.5%
NPV of the terminal value 7,152 Stage 3: Terminal 6.0% Equity risk premium 6.0%
Enterprise value (IDR bn) 18,111 Tax rate 25.0%
Net cash (debt) (640) Target debt to firm value 0.0%
Minorities (33) Equity beta 1.00
Equity value (IDR bn) 17,437 Cost of debt (after tax) 8.6%
Number of shares outstanding (bn) 1.156 Cost of equity 14.5%
Fair value per share (IDR) 15,100 WACC 14.5%
Current price (IDR) 14,300
Upside/(downside) 6%
Current 2015E PER 97
Target 2015E PER 102
EBITDA 2015E 783
Target EV/EBITDA 2015E 23
Note: Share price as of 25 July 2014
Relative valuation
Siloam is trading at 22x 2015E EV/EBITDA, at a 23% premium to its regional peers.
We believe the stock deserves to trade at a premium, given
the company’s
strong
growth pipeline and its EBITDA CAGR of 62% in 2013-16E.
Figure 5: Peer comparison
Name Ticker Rating
Price target
(LCY) Price (LCY)
Mkt. cap (USD mn)
3M avg. value traded (USD mn)
Last FYE
PER (x)
2Y EPS CAGR
2Y PEG
Price/ sales
2014
EV/EBITDA (x) Div. yield (%) 2014
ROCE (%) 2014
2013 2014 2015 2013 2014 2015
Siloam Intl. Hospitals SILO IJ IL 15,100 14,300 1,428 10.49 12/13 300.3 151.9 96.6 76% 1.3 4.2 50.0 34.0 22.4 0.1 7.7
Regional hospitals
Raffles Medical Group RFMD SP OP 4.47 3.91 1,768 1.21 12/13 34.5 30.0 26.5 14% 1.9 5.8 24.0 22.2 18.7 1.5 16.9 KPJ Healthcare KPJ MK OP 4.14 3.54 1,130 1.49 12/13 35.1 33.9 29.6 9% 3.4 1.4 20.5 18.4 16.6 1.5 7.6 Bumrungrad Hospital BH TB NR 119.50 2,729 5.34 12/13 34.5 33.9 28.5 10% 2.8 5.6 22.6 19.8 17.0 1.6 19.0 Bangkok Dusit Med. BGH TB NR 16.90 8,205 23.92 12/13 41.7 36.4 30.6 17% 1.8 4.6 26.1 22.4 19.4 1.3 20.6 IHH Healthcare IHH SP NR 1.81 11,898 0.34 12/13 59.5 48.8 40.3 22% 1.9 4.9 27.7 21.7 18.8 0.4 6.6 IHH Healthcare IHH MK NR 4.71 12,097 6.64 12/13 60.5 49.6 41.0 22% 1.9 5.0 28.1 22.0 19.1 0.4 6.6
44.3 38.8 32.7 15% 2.3 4.5 24.8 21.1 18.3 1.1 12.9
Note: Share price as of 25 July 2014 for Siloam, as Indonesian market is closed this week, and 30 July 2014 for its regional peers; Bloomberg consensus for NR companies.
31 July 2014 6
Source: Company, Standard Chartered Research estimates
Income statement (IDR bn)
Cash flow statement (IDR bn)
Year-end: Dec 2012 2013 2014E 2015E 2016E Year-end: Dec 2012 2013 2014E 2015E 2016E
Sales 1,788 2,504 3,548 5,186 7,434 EBIT 91 79 192 338 606 Gross profit 445 659 958 1,426 2,081 Depreciation & amortisation 120 202 303 446 588 SG&A (368) (583) (766) (1,089) (1,475) Net interest (14) (7) (27) (79) (145) Other income 15 3 9 13 19 Tax paid (33) (27) (43) (67) (121) Other expenses 0 0 0 0 0 Changes in working capital (45) (67) (97) (120) (165)
EBIT 91 79 192 338 606 Others 84 10 (11) (16) (22) Net interest (5) (0) (27) (79) (145) Cash flow from operations 203 189 317 502 741
Associates 0 0 0 0 0
Other non-operational (9) (7) (11) (16) (22) Capex (523) (598) (829) (1,124) (1,139) Exceptional items 0 0 0 0 0 Acquisitions & Investments (53) (163) 0 0 0
Pre-tax profit 77 72 155 243 439 Disposals 0 1 0 0 0
Taxation (25) (22) (43) (67) (121) Others 61 0 0 0 0 Minority interests (1) (0) (3) (5) (9) Cash flow from investing (515) (761) (829) (1,124) (1,139)
Exceptional items after tax 0 0 0 0 0
Net profit 50 50 109 171 309 Dividends 0 0 (11) (26) (62)
Issue of shares 0 0 0 0 0
Net profit adj. 50 50 109 171 309 Change in debt 320 (423) 500 500 500
EBITDA 212 281 495 783 1,194 Other financing cash flow 0 1,326 (200) (100) (50)
Cash flow from financing 320 904 289 374 388
EPS (IDR) 50 48 94 148 267
EPS adj. (IDR) 50 48 94 148 267 Change in cash 9 333 (222) (248) (9)
DPS (IDR) 0 5 9 22 53 Exchange rate effect 0 0 0 0 0 Avg fully diluted shares (mn) 1,000 1,047 1,156 1,156 1,156 Free cash flow (320) (409) (512) (622) (397)
Balance sheet (IDR bn)
Financial ratios and other
Year-end: Dec 2012 2013 2014E 2015E 2016E Year-end: Dec 2012 2013 2014E 2015E 2016E
Cash 169 515 293 46 36 Operating ratios
Short-term investments 0 0 0 0 0 Gross margin (%) 24.9 26.3 27.0 27.5 28.0 Accounts receivable 187 271 389 568 815 EBITDA margin (%) 11.8 11.2 13.9 15.1 16.1 Inventory 75 95 142 206 293 EBIT margin (%) 5.1 3.1 5.4 6.5 8.2 Other current assets 26 26 52 74 105 Net margin adj. (%) 2.8 2.0 3.1 3.3 4.2
Total current assets 457 907 876 894 1,249 Effective tax rate (%) 32.5 30.1 27.5 27.5 27.5 Sales growth (%) 42.0 40.0 41.7 46.2 43.3 PP&E 865 1,402 1,933 2,616 3,171 Net income growth (%) 15.4 -1.2 118.3 57.2 80.8 Intangible assets 61 188 184 179 175 EPS growth (%) 15.4 -5.6 97.7 57.2 80.8 Associates and JVs 0 0 0 0 0 EPS growth adj. (%) 15.4 -5.6 97.7 57.2 80.8 Other long-term assets 203 103 103 103 103 DPS growth (%) - nm 97.7 135.8 141.0
Total long-term assets 1,129 1,693 2,220 2,898 3,449
Efficiency ratios
Total assets 1,586 2,601 3,095 3,792 4,698 ROE (%) 23.8 5.3 6.4 9.4 15.3
ROCE (%) 8.2 4.3 7.7 11.3 16.8 Short-term debt 16 17 17 17 17 Asset turnover (x) 1.3 1.2 1.2 1.5 1.8 Accounts payable 156 164 230 334 476 Op. cash/EBIT (x) 2.2 2.4 1.7 1.5 1.2 Other current liabilities 96 115 142 185 242 Depreciation/capex (x) 0.2 0.3 0.4 0.4 0.5
Total current liabilities 268 296 389 536 735 Inventory days 16.2 16.8 16.7 16.9 17.0 Accounts receivable days 31.8 33.4 33.9 33.7 34.0 Long-term debt 55 43 543 1,043 1,543 Accounts payable days 36.6 31.6 27.8 27.4 27.6 Convertible bonds 0 0 0 0 0
Deferred tax 0 0 0 0 0 Leverage ratios
Other long-term liabilities 1,019 623 423 323 273 Net gearing (%) -40.0 -27.8 15.3 53.6 70.9
Total long-term liabilities 1,074 666 966 1,366 1,816 Debt/capital (%) 5.4 2.6 20.7 32.5 39.4 Interest cover (x) 10.7 6.5 5.0 3.6 4.0
Total liabilities 1,342 962 1,355 1,901 2,551 Debt/EBITDA (x) 0.4 0.2 0.6 1.0 1.1 Current ratio (x) 1.7 3.1 2.2 1.7 1.7
Shareholders’ funds 245 1,639 1,740 1,891 2,147
Minority interests 0 0 0 0 0 Valuation
EV/sales (x) - 4.1 4.7 3.4 2.4
Total equity 245 1,639 1,740 1,891 2,147 EV/EBITDA (x) - 36.1 34.0 22.4 15.1
EV/EBIT (x) - 129.0 87.5 52.0 29.8
Disclosures appendix
The information and opinions in this report were prepared by Standard Chartered Bank (Hong Kong) Limited, Standard Chartered Bank Singapore Branch, Standard Chartered Securities (India) Limited, Standard Chartered Securities Korea Limited and/or one or more of its affiliates (together with its group of companies, ”SCB”) and the research analyst(s) named in this report. THIS RESEARCH HAS NOT BEEN PRODUCED IN THE UNITED STATES.
Analyst Certification Disclosure: The research analyst or analysts responsible for the content of this research report certify that: (1) the views expressed and attributed to the research analyst or analysts in the research report accurately reflect their personal opinion(s) about the subject securities and issuers and/or other subject matter as appropriate; and (2) no part of his or her compensation was, is or will be directly or indirectly related to the specific recommendations or views contained in this research report. On a general basis, the efficacy of recommendations is a factor in the performance appraisals of analysts.
Where “disclosure date” appears below, this means the day prior to the report date. All share prices quoted are the closing price for the business day prior to the date of the report, unless otherwise stated.
9,400
10,547
11,695
12,842
13,990
15,137
Oct-13
Jan-14
Apr-14
Jul-14
IDR
Recommendation and price target history for Siloam Hospital Internasional
1 2
Date Recommendation Price target Date Recommendation Price target Date Recommendation Price target
1 8 Apr 14 OUTPERFORM 13,982 2 25 Jun 14 IN-LINE 15,137
Source: FactSet prices, SCB recommendations and price targets
Recommendation Distribution and Investment Banking Relationships
% of covered companies currently assigned this rating
% of companies assigned this rating with which SCB has provided investment banking services over the past 12 months
OUTPERFORM 55.8% 10.4%
IN-LINE 33.0% 10.1%
UNDERPERFORM 11.2% 8.1%
As of 30 June 2014
Research Recommendation
Terminology Definitions
OUTPERFORM (OP) The total return on the security is expected to outperform the relevant market index by 5% or more over the next 12 months IN-LINE (IL) The total return on the security is not expected to outperform or underperform the relevant market index by 5% or more over the next
12 months
UNDERPERFORM (UP) The total return on the security is expected to underperform the relevant market index by 5% or more over the next 12 months SCB uses an investment horizon of 12 months for its price targets.
Additional information, including disclosures, with respect to any securities referred to herein will be available upon request. Requests should be sent to [email protected].
31 July 2014 8
regulators. Data, opinions and other information appearing herein may have been obtained from public sources. SCB makes no representation or warranty as to the accuracy or completeness of such information obtained from public sources. SCB also makes no representation or warranty as to the accuracy nor responsible for any information or data contains on any third party’s website. You are advised to make your own independent judgment (with the advice of your professional advisers as necessary) with respect to any matter contained herein and not rely on this document as the basis for making any trading, hedging or investment decision. SCB accepts no liability and will not be liable for any loss or damage arising directly or indirectly (including special, incidental, consequential, punitive or exemplary damages) from the use of this document, howsoever arising, and including any loss, damage or expense arising from, but not limited to, any defect, error, imperfection, fault, mistake or inaccuracy with this document, its contents or associated services, or due to any unavailability of the document or any part thereof or any contents or associated services. This material is for the use of intended recipients only and in any jurisdiction in which distribution to private/retail customers would require registration or licensing of the distributor which the distributor does not currently have, this document is intended solely for distribution to professional and institutional investors.
Country-Specific Disclosures - If you are receiving this document in any of the countries listed below, please note the following:
United Kingdom and European Economic Area: SCB is authorised in the United Kingdom by the Prudential Regulation Authority and regulated by the Financial Conduct Authority and the Prudential Regulation Authority. This communication is not directed at Retail Clients in the European Economic Area as defined by Directive 2004/39/EC. Nothing in this document constitutes a personal recommendation or investment advice as defined by Directive 2004/39/EC. Australia: The Australian Financial Services Licence for Standard Chartered Bank is Licence No: 246833 with the following Australian Registered Business Number (ARBN:
097571778). Australian investors should note that this communication was prepared for “wholesale clients” only and is not directed at persons who are “retail clients”
as those terms are defined in sections 761G and 761GA of the Corporations Act 2001 (Cth). Bangladesh: This research has not been produced in Bangladesh. The report has been prepared by the research analyst(s) in an autonomous and independent way, including in relation to SCB. THE SECURITIES MENTIONED IN THIS REPORT HAVE NOT BEEN AND WILL NOT BE REGISTERED IN BANGLADESH AND MAY NOT BE OFFERED OR SOLD IN BANGLADESH WITHOUT PRIOR APPROVAL OF THE REGULATORY AUTHORITIES IN BANGLADESH. Botswana: This document is being distributed in Botswana by, and is attributable to, Standard Chartered Bank Botswana Limited which is a financial institution licensed under the Section 6 of the Banking Act CAP 46.04 and is listed in the Botswana Stock Exchange. Brazil:SCB disclosures pursuant to the Securities and Exchange Commission of Brazil (“CVM”) Instruction 483/10: This research has not been produced in Brazil. The report has been prepared by the research analyst(s) in an autonomous and independent way, including in relation to SCB. THE SECURITIES MENTIONED IN THIS DOCUMENT HAVE NOT BEEN AND WILL NOT BE REGISTERED PURSUANT TO THE REQUIREMENTS OF THE SECURITIES AND EXCHANGE COMMISSION OF BRAZIL AND MAY NOT BE OFFERED OR SOLD IN BRAZIL EXCEPT PURSUANT TO AN APPLICAB LE EXEMPTION FROM THE REGISTRATION REQUIREMENTS AND IN COMPLIANCE WITH THE SECURITIES LAWS OF BRAZIL. Germany: In Germany, this document is being distributed by Standard Chartered Bank Germany Branch which is also regulated by the Bundesanstalt für Finanzdienstleistungsaufsicht (BaFin).
Hong Kong: This document, except for any portion advising on or facilitating any decision on futures contracts trading, is being distributed in Hong Kong by, and is attributable to, Standard Chartered Bank (Hong Kong) Limited 渣打銀行 香港 有限公司 which is regulated by the Hong Kong Monetary Authority. India: This document is being distributed in India by Standard Chartered Securities (India) Limited, which is a SEBI-registered broker and a member of the Bombay Stock Exchange Limited and The National Stock Exchange of India Limited. Registered Address: 2nd Floor, 23-25 M. G. Road, Fort, Mumbai - 400 001. India | Telephone No: 022 - 6135 5999 | Fax No: 022 - 6135 5900| http://www.standardcharteredtrade.co.in | Email: [email protected]. | CIN: U65990MH1994PLC079263.
Indonesia: The information in this document is provided for information purposes only. It does not constitute any offer, recommendation or solicitation to any person to enter into any transaction or adopt any hedging, trading or investment strategy, nor does it constitute any prediction of likely future movements in rates or prices or represent that any such future movements will not exceed those shown in any illustration. Kenya: Standard Chartered Bank Kenya Limited is regulated by the Central Bank of Kenya. This document is intended for use only by Professional Clients and should not be relied upon by or be distributed to Retail Clients. Korea:
This document is being distributed in Korea by, and is attributable to, Standard Chartered Securities Korea Limited which is regulated by the Financial Supervisory Service. Macau: This document is being distributed in Macau Special Administrative Region of the Peoples' Republic of China, and is attributable to, Standard Chartered Bank (Macau Branch) which is regulated by Macau Monetary Authority. New Zealand: New Zealand Investors should note that this document was prepared for "wholesale clients" only within the meaning of section 5C of the Financial Advisers Act 2008. This document is not directed at persons who are “retail