Full Terms & Conditions of access and use can be found at
http://www.tandfonline.com/action/journalInformation?journalCode=tppc20
Download by: [103.212.43.138] Date: 26 July 2017, At: 19:15
Production Planning & Control
The Management of Operations
ISSN: 0953-7287 (Print) 1366-5871 (Online) Journal homepage: http://www.tandfonline.com/loi/tppc20
A framework for managing sustainable palm oil
supply chain operations: a case of Indonesia
Rika Ampuh Hadiguna & Benny Tjahjono
To cite this article: Rika Ampuh Hadiguna & Benny Tjahjono (2017) A framework for managing sustainable palm oil supply chain operations: a case of Indonesia, Production Planning & Control, 28:13, 1093-1106, DOI: 10.1080/09537287.2017.1335900
To link to this article: http://dx.doi.org/10.1080/09537287.2017.1335900
Published online: 08 Jun 2017.
Submit your article to this journal
Article views: 158
View related articles
VOL. 28, NO. 13, 1093 1106
https://doi.org/10.1080/09537287.2017.1335900
A framework for managing sustainable palm oil supply chain operations: a case of
Indonesia
Rika Ampuh Hadigunaa and Benny Tjahjonob
aDepartment of Industrial Engineering, Universitas Andalas, Padang, Indonesia; bCentre for Logistics and Supply Chain Management, Cranfield School
of Management, Cranfield University, Cranfield, UK
ABSTRACT
The challenges faced by the palm oil industry in Indonesia lie in the supply chain risk management, specifically in the integration of decision-making at the operational level. Problems at this level have
become more apparent while the industry continues to face pressures as a consequence of the strict conditions imposed by, predominantly, international trading communities, and in some cases, by the environmental issues from domestic and overseas. As part of an effort to address the underlying problems,
this paper aims to propose a conceptual framework that can be used to effectively manage the palm oil
supply chain, by integrating risk assessment, performance measurement and supply chain optimisation, which will be compiled into a decision-making tool. The perceived benefits from the implementation of
this framework include more realistic target planning, clearer prediction of risks and better visibility of the operating performance.
ARTICLE HISTORY Received 17 September 2015 Accepted 22 April 2017 KEYWORDS
Supply chain operations; palm oil; risk assessment; performance measurement; optimisation
© 2017 Informa UK Limited, trading as Taylor & Francis Group CONTACT Benny Tjahjono [email protected] 1. Introduction
The palm oil industry is experiencing a rapid growth in many countries in South-East Asia, especially Indonesia. Palm oil has become the leading trading commodity of the region in recent decades. Despite the growth, the Indonesian palm oil industry, nonetheless, continuously strives to improve their competitive-ness in the international oil trade. The Indonesian government, as well as the palm oil players in Indonesia, recognise the chal-lenges associated with the sustainability issues as a result of the dynamics and uncertainties (Widodo, Abdullah, and Arbita 2010). For that reason, research in palm oil supply chain management, e.g. Djohar, Tanjung, and Cahyadi (2003), Hadiguna and Machfud (2008), Hadiguna (2009), Alfonso-Lizarazo, Torres, and Franco (2013) and Cảceres, Avella, and Gòmez (2015) give considerable attention to the issues of operations effectiveness, especially those activities that are related to the mitigation of risks.
Risks in the palm oil supply chain are not solely caused by the susceptibility within the supply chain itself, but more importantly by threats imposed by the various conflicts of interest amongst ecological, economic and social aspects (Hadiguna 2012b; Widodo 2010). A decrease in the global palm oil price, for instance, will disrupt the stability of the supply chain, as palm oil farmers tend to be reluctant to sell the fresh palm fruit bunches, which subse-quently disrupts the fulfilment of the palm oil production targets. In addition, social threats, such as non-tariff barriers on palm oil waste pollution, are the risks that could also destabilise the entire supply chain. Under these circumstances, the economic, social
and environmental risks need to be managed effectively to ensure business stability (Bloemhof 2005), which otherwise could evolve into business challenges if not addressed early enough (Carter and Liane Easton 2011).
Mitigating the risks will subsequently reduce their impact (Nooraie and Mellat Parast 2015). In the case of the palm oil sup-ply chain management in Indonesia, risk mitigation is typically carried out by strengthening the coordination amongst the three components of the palm oil supply chain namely Plantation, Production and Port Storage (Hadiguna and Machfud 2008). This often requires a framework to manage the effective flow and usage of information from upstream to downstream and vice versa. The most common way to ensure the effectiveness of such coordination using a framework is to constantly predict the risks and measure the performance of the supply chain, so that the planning and control of the palm oil supply chain can be done more effectively and efficiently.
This paper proposes a conceptual framework that can be used to manage the sustainable palm oil supply chain by integrating the performance measurement, risk assessment and supply chain optimisation. The framework is deployed via a model, describing the detailed procedures that need to be carried out in order to plan and control the palm oil supply chain.
loss potential during transportation from farm to factory, inap-propriate or obsolete processing and ancillary equipment, lack of qualified food technologists, poor/inconsistent quality of pro-cessed products and inappropriate material packaging and high packaging costs.
Research in palm oil supply chain has been extensively car-ried out at least since early 2000’s, focusing on different levels of the supply chain, trends and risks. For instance, Hansen et al. (2015), using bibliometric analysis, described a particular trend in sustainable palm oil in academic papers published during the period of 2004–2013. The results of this study have revealed various academic and scientific contributions at both technical and policy levels. Oosterveer (2015) analysed the shifting power relationships in developing countries to address the challenges of palm oil supply sustainability. The characteristics of the global palm oil production and consumption, its usage and the number of actors involved, often prevent effective promotion of sustain-able palm oil. Cảceres, Avella, and Gòmez (2015) developed a model of a tactical optimisation of the palm oil supply chain to minimise the fixed costs of logistics infrastructure, as well as the variable costs such as harvesting, loading, lifting, transportation, material supply and product extraction.
Sustainable supply chain management is an approach to manage the processes and activities of the entire supply chain to improve company performance, by taking into account the eco-nomic, environmental and social aspects as a whole (Blengini and Shields 2010). The sustainability paradigm, therefore, balances economic development, environmental security and social justice (Sikdar 2003). According to Bloemhof (2005), the scope of today’s supply chain management has extended to cover two important areas: (1) maximising the economic, social and environmental benefits and (2) applying the closed-loop supply chain manage-ment (Guide 2009). This combines the forward and reverse sup-ply chain to minimise pollution and waste. The latter is closely related to the concept of reverse logistics (Pokharel and Mutha 2009), green Supply Chain Management (Shang, Lu, and Li 2010) and green marketing (Papadopoulos et al. 2010). The focus of sustainable supply chain management is, therefore, to adopt the sustainability principles starting from raw material procurement, to delivery of the finished products to consumers (Linton, Klassen, and Jayaraman 2007). Consequently, the supply chain must be viewed, not as the end of consumption, but as the starting point of origin (Svensson 2007).
Linton, Klassen, and Jayaraman (2007) argued that sustaina-bility is a critical integrated business policy as the current legal trends lead to sustainability issues. This is relevant to the palm oil supply chain, as the total cost should include the impact of primary output from this paper is a framework that will be
dis-cussed in detail in Section 4. In order to illustrate how the frame-work could be applied, a case example is presented in Section 5, before the discussion in Section 6. The paper concludes with discussion on the practical and theoretical implications of this paper and some future work.
2. Literature review
2.1. Related work
Generally, a supply chain can be defined as a set of companies, directly linked by one or more of the upstream and downstream flows, of products, services, finances and information from a source to a customer (Maryam and Habib 2013). In the con-text of an agricultural supply chain, a set of companies can be broadly substituted by a set of activities that produce fresh or processed products from farms, using appropriate technologies that add value to the final products. The supply chain of fresh agricultural products, such as vegetables, flowers and fruits, will therefore typically involve farmers, auctioneers, wholesal-ers, importers and exportwholesal-ers, retailers and speciality stores, and third-party logistics providers.
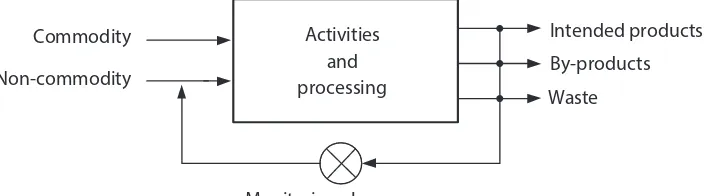
Palm oil is an agricultural-based product which is processed using a series of activities from the harvest of the palm fruit bunches to the palm oil production along the chain of storage and distribution. This may include handling, conditioned storing, packing, transportation and special trade goods. As with other perishable products, the main issue faced by the stakeholders in the palm oil supply chain is to ensure the product is fresh when reaching the hands of consumers. Palm oil, like other processed products such as canned meats, snacks, juices, desserts and cook-ing oil, has a high economic value and as such it is usually pro-cessed using a state-of-the-art technology to prolong its shelf life. A palm oil production system, in general, can be illustrated using a block diagram in Figure 1. The main inputs are commod-ity and non-commodcommod-ity raw materials. Commodcommod-ity raw materials are the palm fruits from the farm. The main outputs of the palm oil processing are intended products (palm oil) and by-products. Waste will inevitably be produced during the production process. Whilst waste does not add value, it still consumes energy, other additives and non-commodity raw materials that are needed in the process to produce high-quality palm oil. Monitoring clear-ance is required to monitor all the activities and processes in order to meet the production targets.
As with other supply chains of agricultural-based products, the palm oil supply chain also suffers from inconsistent raw material availability, perhaps due to seasonality in crops, high
Activities
resource consumption, converted into waste and pollutant. A sustainable palm oil supply chain should manage all the pro-cesses involved in the palm oil production and distribution, using environmentally friendly inputs, and the conversion of the inputs into the outputs, using technologies that cause no harm to the environment. This process also results in outputs that can be reclaimed and possibly reused at the end of the product life cycle (Kushwaha 2010).
Various models related to sustainable supply chain have been proposed and discussed by many researchers and the topic has continued to grow over time. Widodo (2010), for instance, formu-lated a scenario to integrate the palm oil industry in Indonesia by applying the system dynamics simulation technique. Solvang and Hakam (2010) built a conceptual model addressing economic and environmental interests in the context of logistics network in Norway. Chung and Wee (2006) developed a mathematical model to investigate the pricing and replenishment policy that involves remanufacturing the supply chain system regarding the supplier, manufacturer, retailer and the third party. Seuring and Müller (2008) discussed the important issues of a sustainable sup-ply chain from the environmental standpoint, whilst Sarkis, Zhu, and Lai (2011) reviewed the organisational theories of a green supply chain.
The issues surrounding the sustainability of palm oil supply chain management have also received substantial attention from relevant researchers. Risk management of the palm oil supply chain in Indonesia has been discussed by Hadiguna (2012a) who proposed a framework of supply chain risk assessment. Hadiguna (2012b) then applied the risk assessment model assessing the risk level of the sustainable supply chain in Indonesia, using non-nu-meric multi-criteria decision-making. Hidayat and Marimin (2014) and Hidayat and Nurhasanah (2014) applied agent-based model-ling to assess the operational risks and investment development of the industry and its derivatives, from the perspective of supply chain management. Gunarta, Eriyatno, and Fauzi (2013) built a model of geo-spatial multi-criteria decision-making to select the location of crude palm oil mills by considering sustainable crite-ria. Hidayatno et al. (2011) applied a system dynamics model to analyse the production chain of biodiesel from palm oil. Hayashi (2007) discussed the impact of environmental issues on the devel-opment of the palm oil industry in Indonesia. Alfonso-Lizarazo, Torres, and Franco (2013) developed a mathematical model to optimise the total production and energy costs in the context of a closed-loop supply of palm oil processing. von Geibler (2013) discussed the value chain of the palm oil sector that considers aspects of the legitimacy and effectiveness of the standard-set-ting stipulated in the Roundtable on Sustainable Palm Oil (RSPO). Finally, reasoning from a similar agricultural environment in Malaysia, Omain et al. (2010) and Padfield et al. (2011) discussed the practice of a supply chain of palm oil, and analysed its envi-ronmental, social and economic impacts.
2.2. Justification for research
This research derives its root from the concept of sustainable Operations Reference (SCOR) to evaluate the economic perfor-mances of a supply chain from the perspective of sustainability. The tool has been used to evaluate the sustainability indica-tors. Torres, Franco, and Blanco (2015) developed a framework using an inductive case study research to calculate the green-house gas emissions from the agro-industry supply chain at a corporate level. Marshall et al. (2015) built a conceptual model of supply chain management sustainability practices using a combination of the environmental and social supply chain as a theoretical framework. This study is aligned to that of Gopal and Thakkar (2016) who identified critical success factors of the implementation of sustainable supply chain management prac-tices in the automobile industry. Colicchia et al. (2016) formu-lated a multi-objective mathematical model for a supply chain network that emphasises efficiency and ecological aspects of choosing alternative transit and delivery points.
Increasing the competitiveness of the palm oil supply chain management requires a comprehensive approach. We argue that risk management, performance evaluation and production planning are the three important elements required to effectively manage this supply chain. However, frameworks that integrate risk, performance and production measures holistically, in the context of supply chain management of sustainable palm oil, appear to be lacking.
As with other agro-industry supply chain operations, material, information and financial flows in the palm oil supply chain are equally complex, as both inter and intra flows have interdepend-encies. The complex supply chain operations must therefore be managed using a set of key success factors which significantly improve the efficiency and effectiveness of supply chain opera-tions. These factors could therefore help the decision-makers plan, manage and control operations more effectively and efficiently.
3. Methodology
The study described in this paper has been conducted within the context of an internal supply chain system that includes palm oil plantations and processing plants located in Indonesia, who are also the main beneficiaries of the study described in this paper. The palm oil plantations might be nucleus, plasma or third-party sourced. The supply chain discussed in this research originates from an empirical case and thus a single case study has been deemed suitable and hence chosen as the research method. The primary data were collected from direct field observations corroborated by relevant stakeholders who were chosen because of their expertise, know-how and experience in the management of palm oil plantations and production, espe-cially at an operational level.
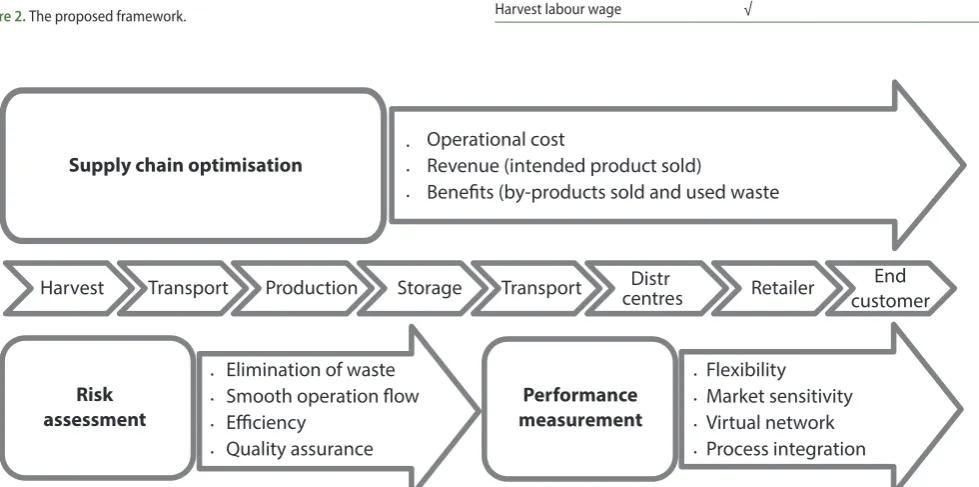
In this paper, the three main pillars, based on the concept of key success factors for managing the sustainable palm oil sup-ply chain, are proposed. These are: risk assessment, performance measurement and supply chain optimisation, and are illustrated in Figure 2.
(1) Formulation of the palm oil supply chain.
(2) Selection of the supply chain management concept. (3) Development of the relevant frameworks.
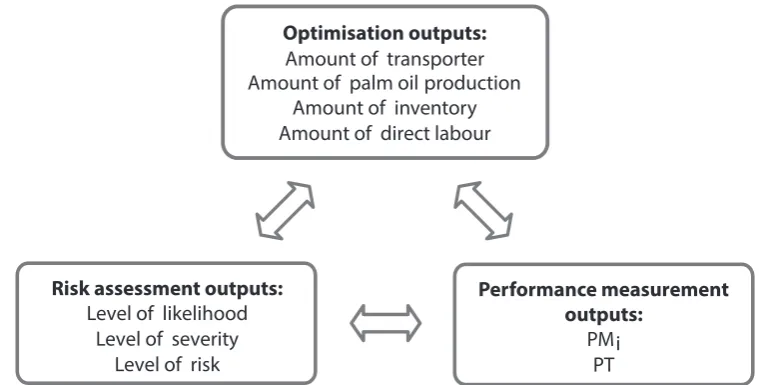
The role of each component in the framework is illustrated in Figure 3.
Risk assessment and the performance measurement system both act as models of non-numeric input to the supply chain optimisation models. The linkage between the two models with supply chain optimisation requires an interface that can convert non-numeric values into numeric values in the optimisation model.
The first step in the conversion is to identify the factors that need to be considered in the risk assessment and performance measurement. Risk assessment considers the elimination of waste and improvement of operational flow, efficiency and qual-ity assurance. These factors are then broken down into a num-ber of typical indicators in sustainability (Tables 1–3) required in the assessment process. By understanding these indicators, potential economic, environmental and social risks can be listed. Performance measurement consists of flexibility factors, market sensitivity, virtual network and process integration.
direction to be achieved by the company. The risk assessment and performance measurements represent the control and evaluation functions required to achieve the targets. The key success factors are located in the centre as the ‘heart’ of the management process. Decision variables in optimisation, assessment and measurement must then refer to the key success factors.
Risk assessment consists of criteria, likelihood, severity and algorithms, and is applied to predict the risks1 at an operational
level. Performance measurement will be applied to evaluate and control the entire supply chain targets and consists of perfor-mance indicators, scaling technique and algorithms. Supply chain optimisation will optimise the decision variables as the intended targets.
Guided by the three pillars, the development of a model will thereby follow a three-stage process, namely:
Supply chain
Figure 2. The proposed framework.
Supply chain optimisation ∙
Operational cost
Revenue (intended product sold)
Benefits (by-products sold and used waste
Harvest Transport Production Storage Transport Distr
centres Retailer
End customer
Risk assessment
∙ Elimination of waste Smooth operation flow Efficiency
Figure 3. The composition of the model.
Table 1. Indicators in upstream operations.
Indicators Economics Environment Social Availability of material √
Crop productivity √
Land √
Local culture √
Criminal attack √
Material price √
Quality of material √ Transportation security √
Transportation reliability √
Complaints √
Hazards √
Labour safety and security √ Unit cost of transportation √
Harvest cost √
The key success factors are shown in Table 1, listing all the indicators in the upstream operations. Table 2 shows the indica-tors to measure the performance of midstream operations, whilst indicators of downstream operations are shown in Table 3.
The indicators shown in Tables 1–3 originated from the direct observation of the palm oil industry followed by a number of discussions with industry practitioners and researchers. The observation was done by studying the activities involved from the palm oil plantation, processing and transportation. During the observation, discussions with the plant manager helped improve familiarisation with the palm oil supply chain.
The next stage is to formulate the indicators used to assess the risks and the operational performance of the supply chain. The results from the observation and discussion underlie the tri-ple bottom lines of the sustainability, namely economics, envi-ronmental and social. The indicators were then mapped against those sustainable aspects.
The final stage is to confirm and finalise the indicators formu-lated in the previous stages by involving five experts in palm oil consisting of academics and practitioners. The experts triangu-lated the list of indicators and checked if they are truly relevant to the sustainable supply chain.
4.2. Risk Assessment model
Palm oil supply chain activities involve several stakeholders, namely farmers, governments and companies who have distinct interests in both time and space dimensions. The pressure of the business environment and internal circumstances of the stake-holders will undoubtedly create disturbances and uncertainties. A risk, triggered by a particular disturbance or uncertainty, is considered to be any unexpected event and loss, be it financial or brand image, which could be detrimental to the business in the future.
The risk assessment model consists of two parts: an assessment of the likelihood of the risk and an assessment of impact from the risk. Risk aggregation is the outcome of probability and violence risk. The risk assessment model incorporates an algorithm based on a multi-expert model of multi-criteria decision-making (Yager 1993). The risk assessment that has been formulated comprises the following steps:
Step 1. Set the number of expert risk assessors (r) and the grading point scale (q) where r = 1, 2, .., m, q = 1,2 …, n.
Step 2. Provide assessment of possible risk to each expert k = 1, 2, …, r for all risk drivers i.
Step 3. Provide risk assessments by each expert k for all i risk drivers. Calculate the aggregation value of experts for likelihood and impact.
Step 4. Furthermore, the measures are initiated by the aggregation value reordering of values, based on the highest scale value to the lowest scale, B(j) for each j-th indicator where j = 1,2, …, r.
Step 5. Define alignment arithmetic function Q
A(j) for each indicator using the following formula: QA(j) = Integer[1 + k(q – 1)/r].
Step 6. Compare QA(j) and B(j). Select the minimum value of Max[Min {QA(j), B(j)}] for each j = 1,2, …, r.
Step 7. Repeat this process to obtain the aggregation factor levels.
The components of objective function include operational costs, revenues (intended product sold) and benefits (by-products sold and used products). In this instance, the objective function is to maximise the revenue or profit or minimise the operational cost. In addition, the model is formulated using multi-objective optimisation that minimises a sustainable operational cost index and maximises revenue or profit. The formulation of the objec-tive function depends on the management decisions. Constraints that are included in the mathematical models are, for instance; demand, availability of raw materials, processing capacity, etc.
4. System development
The decision-making framework has been implemented as an integrated model that includes key success factors, risk assess-ment, performance measurement and optimisation functions.
4.1. Key success factors
A typical palm oil supply chain can be split into three main groups of activities namely upstream, midstream and down-stream. Upstream activities are referred to as the harvesting and transportation of the fresh fruit bunch (FFB) which becomes raw material of the palm oil producer. Midstream activities include the production, storage and transportation of crude palm oil, whilst downstream activities involve storage and distribution of palm oil to end customers.
Table 2. Indicators in midstream operations.
Indicators Economics Environment Social Manufacturing cost √
Energy consumption cost √ Cost of waste treatment √ Labour cost and rewards √
Storage cost √
Complaints of the sewage plant √
Health and safety labour √
Reuse and recycle √
Re-manufacturing cycle time √
Table 3. Indicators in upstream operations.
Indicators Economics Environment Social
Demand √
Transportation schedule √ Delivery reliability √ Product warranty and quality √ Responsiveness to meet demand √ Forecasting accuracy of demand √
Customer complaints √
Transportation security √
Product inventory in port √ Reliability of shipping √ Accuracy of shipping documents √
Security of shipping to customers √ Transportation cost from plant to
port
√
Shipping cost to destination port √
bunches (FFB) from plasma in period t in the fuzzy numbers; Dt is availability of fresh fruit bunches (FFB) from third parties in period t in the fuzzy numbers; KP – is availability of plant capacity; Mt – is crude palm oil demand in period-t; rst – is fresh fruit bunches yield factor of the nucleus; rpt – is fresh fruit bunches yield factor of the plasma; rit – is fresh fruit bunches yield factor of the third parties; KT – is storage capacity available; SSt – is level of safety bunches from third parties in period t; CPOt is number of crude palm oil production in period t; INVt is amount of stock in period t; FFSt is quantity of fresh fruit bunches from nucleus in period t; FFPt is quantity of fresh fruit bunches from plasma in period t; FFLt is quantity of fresh fruit bunches from third parties in period t.
The mathematical formulation can be defined as:
subject to
The objective function is the total cost, consisting of minimising the cost of the purchase of fresh palm fruit bunches, process-ing costs, labour costs and cost of transportprocess-ing the fresh fruit, harvested from the palm plantation to the palm oil processing plant.
The model has five constraints. The first is the priority of fresh palm fruit supply, both from the plantation and plasma. Processing of the fruit is given priority to ensure the fresh fruit is (3) Step 8. Put the aggregate value of possibility of any risk
fac-tors as Pi and impact of factors as Ii.
Step 9. Set the negation of Ii as Neg(Ii). Get the value of final aggregation as Min[Max{Neg(Ii), Pi}]
4.3. Performance measurement model
Performance measurement is required to manage the supply chain both midstream and downstream. The performance meas-urement of the proposed framework focuses on the operational issues in which the indicators formulated into the model are thus specific to the palm oil supply chain operations. The model here has been aligned with the SCOR model, as it is sufficiently systematic yet reasonably generic to incorporate sustainability issues of the supply chain (Ntabe et al. 2014).
There are two types of performance measures, namely partial and total performance. Both performance types can be formu-lated as follows:
where PMi is a measure of partial performance for the i-th objec-tive, PT is a measure of total performance, wij is the weight for i-th and j-th factor. sij and mij are the scores for i-th and j-th objec-tive, respectively, i-th and j-th are the indices of the factors.
The computational outcome of the performance measure-ment model is obtained by multiplying the weight of each indica-tor with score achievement indicaindica-tors. The performance measure evaluation is as follows:
Step 1. Set the weight and performance of each indicator. Step 2. Calculate the score for each factor for period t and store in the database.
Step 3. Calculate each factor obtained by comparing perfor-mance with the targets set. Save the results in the database. The score of each indicator is based on the achievement of predeter-mined intervals and stored in the database.
Step 4. Calculate the PMi for the period t and store in the database. Retrieve the weighting for each factor of i-th objective. Calculate the product of wij and sij for j. Sum the results of time and store in the database. Calculate PT for period t and store in the database. Retrieve the weighting of each factor from the data-base. Retrieve the PMi from the database to compute the product wij and sij for i and store in the database.
Step 5. Repeat the calculation of each factor’s achievement of factors and objectives, if the weight does not change. If not, set the weight and performance of each indicator.
4.4. Optimisation model
Optimisation is a role model for incorporating risk assessment and performance measurement into supply chain planning and the sole objective is to minimise the total operational costs.
The model application consists of three stages. First, a user performs a risk analysis, based on the indicators specified in Tables 1–3. The level of risk is part of the production planning. The sec-ond is to measure the supply chain performance using the same indicators. Some indicators using separate data inputs must be prepared beforehand. Finally, the user executes the production planning optimisation model.
Combining the three main models will integrate both the operational and tactical levels. Risk assessment and performance measurement describe the macro conditions of the supply chain, which contain elements of uncertainty. Macro conditions will be an important consideration in production planning at the oper-ational level of the company. With the framework implemented, decisions can be made at both tactical and operational levels. This integration is required to plan and control a comprehensive supply chain.
Integrated risk assessment and performance measurement are important factors in the structured framework of the planning and operation of the palm oil supply chain. Having completed the risk assessment, the risk level of each indicator shows the weight-ing (wij) of any indicators of the performance measurement. In practical terms, companies can first define the importance of risk assessment as the initial application of the model. Risk assess-ment and performance measureassess-ment, taking into account expert judgment, are particularly useful at the tactical level.
5. Application of the framework
The conceptual framework has been built upon, and reflects, the supply chain of a state-owned palm oil company in Indonesia. The factors included in the framework are considered the core processes of the palm oil supply chain operations. Production planning, operations performance measurement and risk assessment shown in Figure 4, are the three main components required to manage the sustainable palm oil supply chain. The effectiveness of the application of this concept can be demon-strated in a case study.
Though the company owns a large number of plantations, spread across many locations on the island of Sumatra, the case processed and harvested completely. If there is a shortage in the
plantation, fresh palm fruit will be sourced from a plasma plan-tation before being bought out from the third-party planplan-tation. The second constraint is the volume of crude palm oil (CPO) produced in accordance with the supply of fresh fruit. Prior to the examination, specifications of fresh fruit processed are computed first. The yield factor of the fresh fruit bunches (FFB) will also affect the CPO produced. The relationship between the amount of palm oil produced and fresh fruit bunches is repre-sented by the quality and yield factors, and the total CPO pro-duction may not exceed the forecast demand in a certain period or the plant capacity.
The third is the CPO inventory control in the bulk tank. The level of the CPO inventory bulk tank is usually determined by the previous period, the current production and the current demand. An additional condition to consider is the safety stock that must be met in each period. The capacity of the bulk tank will itself become the constraint, as the stock cannot exceed the capacity of the bulk tank.
The fourth is the manpower requirement of the harvested fresh fruit that cannot exceed the availability of labour. The max-imum labour during harvest (Max CPM) can be calculated, based on the amount of fresh fruit harvested, divided by the capacity per person. The final constraint is the truck requirement that also must not exceed the availability.
4.5. Model configuration
As previously mentioned, this research proposes a framework that can be used to assist decision-making in the planning and operation of the palm oil supply chain. Risk assessment, per-formance measurement and production optimisation models, therefore need to be integrated. This integration will subse-quently show the relationship between the models.
The model configuration allows the components of the frame-work throughout the entire system to interact and support the decision-making process. Technically, the configuration consists of a database, a model base and a knowledge base system shown in Figure 4.
Risk assessment outputs:
Level of likelihood Level of severity
Level of risk
Optimisation outputs:
Amount of transporter Amount of palm oil production
Amount of inventory Amount of direct labour
Performance measurement outputs:
operational flow and efficiency. The contributions of this study thus reinforce the significance of a holistic view of the integrated risk assessment, performance measurement and optimisation of production of palm oil.
The case example discussed in this paper has illustrated how the proposed framework might be implemented to support deci-sion-making. To become more practically applicable, the frame-work must be deployed in the form of a software tool, and be embodied into a Decision Support System (DSS) that can be used by decision-makers in the planning and operation of the palm oil industry supply chain.
Many palm oil companies, especially in Indonesia, often emphasise the improvement of productivity by solely focusing on production planning yet consider risk assessment and perfor-mance measurement as a separate issue2. In reality, companies
need to better understand future potential risks in order to set realistic targets. For this, performance measurement is necessary to conduct a proper risk assessment. The levels of risk identified from this risk assessment can then be used in setting the realistic targets required in production planning.
There are three distinct aspects that act as the backbone of the framework. They are risk assessment, performance measurement and production planning. This framework can help decision-mak-ers evaluate the performance of the supply chain, and the results of the performance measurement model can be used to optimise palm oil production. The performance measurement results are also useful to predict the risk level in the supply chain.
Farmers, processors and distributors are the three stakeholders with significant influence on the performance of the palm oil sup-ply chain. In this study, we made an underlying assumption that the stakeholders are able to coordinate well as equal partners. This assumption is deemed valid due to the fact that the existing management system of palm oil plantations in Indonesia follows the so-called ‘nucleus-plasma’ system. The nucleus plantations are owned by a particular palm oil company which usually acts as the palm oil producer, whereas plasma palm oil plantations are owned by farmers who are under a commercial contract with the nucleus plantation company. Plasma farmers are required to sell the yields to the nucleus company. Supply chain management can be effective only if the availability of accurate information from various sources can be gained through cooperation.
The platform model proposed in this paper is intended to assist the decision-makers in the planning and control of the sup-ply chain. The tangible manifestation of this system is a software tool that acts as the DSS. The decision-making process, though assisted by the DSS, remains challenging if not supported by data. This means that the documents and the information flow are of utmost importance to support the effectiveness of the DSS. Supporting measures are needed to prepare the flow pattern of information that describes the types of data, measurement, responsibility and benefits from the information. Thus, the avail-ability of information technology infrastructure is critical.
Having developed and applied the framework, some of the perceived benefits to be gained are:
• Price stability of the fresh fruit bunches (FFB) could be maintained
• Supply chain costs could be better controlled through a more effective risk management
here only focuses on one location. The supply of palm fruit is sourced from different areas, including their own plantations, plasma plantations and third-party plantations. Plasma planta-tions are owned by local farmers, but the investment is made by the company.
The first step in the application of the framework is to set the indicators relevant to the enterprise supply chain systems, as described in the previous section. Setting the indicators is cru-cial in the planning and operation of the palm oil industry supply chain operation.
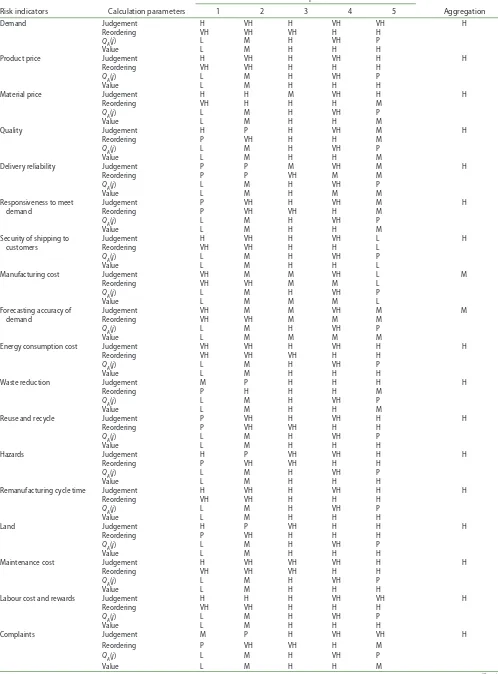
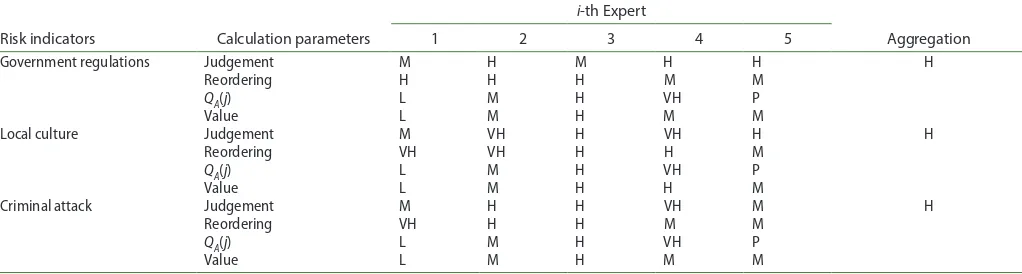
The second step is to analyse the supply chain risks. This involved five experts, consisting of academics and practitioners who have extensive expertise and experience in palm oil process-ing. The outcome of the risk assessment is shown in Table 4. The risk associated with each risk indicator, spans seven band scores, including perfect (P), very high (VH), high (H), medium (M), low (L), very low (VL) and none (N) (Yager 1993). The parameters include judgement, reordering, QA(j) and value. Judgement is the risk indi-cator provided by the experts. Reordering is the preparation of a risk value in order of highest to lowest. QA(j) is a value, referring to what has been explained in the previous section. Value is the risk level provided by i-th-expert. Aggregation is the aggregate value of all five experts. These principles are equally applicable to the measurement of performance.
The third step is to measure the supply chain performance, using the same scoring system as for the risk assessment. The scoring system must follow a certain condition, for example, the less the criminal threat, the better the performance. The outcome from the supply chain performance identified by experts is shown in Table 5.
The outcome from both the risk assessment and performance measurement would become a major consideration in produc-tion planning. The computaproduc-tional algorithm was then used as a basis of the heuristic rules. The formulation of rules is as fol-lows: IF (performance aggregation) AND (risk aggregation) THEN (adjusted). The term “adjusted” refers to the parameter value of the production planning (see Equations (4) to (13)).
In this research, the formulation of the rules has purposely not been done in great detail. The manager can observe the best performance, such as request (VH), whereas the risk of demand is H. Managers may assign (corresponding rule base) adjusted demand.
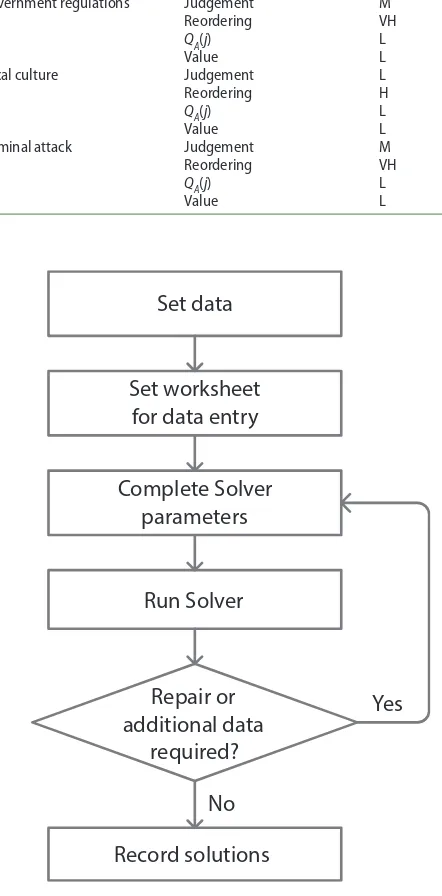
The results of the production planning model can be seen in Table 6. The calculation, using Excel Solver can be seen in Figure 5. This example illustrates the production planning for a twelve-month period.
6. Discussion
Table 4. Computational results of the risk assessment.
Risk indicators Calculation parameters
i-th Expert
Aggregation
1 2 3 4 5
Demand Judgement H VH H VH VH H
Reordering VH VH VH H H
QA(j) L M H VH P
Value L M H H H
Product price Judgement H VH H VH H H
Reordering VH VH H H H
QA(j) L M H VH P
Value L M H H H
Material price Judgement H H M VH H H
Reordering VH H H H M
QA(j) L M H VH P
Value L M H H M
Quality Judgement H P H VH M H
Reordering P VH H H M
QA(j) L M H VH P
Value L M H H M
Delivery reliability Judgement P P M VH M H
Reordering P P VH M M
QA(j) L M H VH P
Value L M H M M
Responsiveness to meet demand
Judgement P VH H VH M H
Reordering P VH VH H M
QA(j) L M H VH P
Value L M H H M
Security of shipping to customers
Judgement H VH H VH L H
Reordering VH VH H H L
QA(j) L M H VH P
Value L M H H L
Manufacturing cost Judgement VH M M VH L M
Reordering VH VH M M L
QA(j) L M H VH P
Value L M M M L
Forecasting accuracy of demand
Judgement VH M M VH M M
Reordering VH VH M M M
QA(j) L M H VH P
Value L M M M M
Energy consumption cost Judgement VH VH H VH H H
Reordering VH VH VH H H
QA(j) L M H VH P
Value L M H H H
Waste reduction Judgement M P H H H H
Reordering P H H H M
QA(j) L M H VH P
Value L M H H M
Reuse and recycle Judgement P VH H VH H H
Reordering P VH VH H H
QA(j) L M H VH P
Value L M H H H
Hazards Judgement H P VH VH H H
Reordering P VH VH H H
QA(j) L M H VH P
Value L M H H H
Remanufacturing cycle time Judgement H VH H VH H H
Reordering VH VH H H H
QA(j) L M H VH P
Value L M H H H
Land Judgement H P VH H H H
Reordering P VH H H H
QA(j) L M H VH P
Value L M H H H
Maintenance cost Judgement H VH VH VH H H
Reordering VH VH VH H H
QA(j) L M H VH P
Value L M H H H
Labour cost and rewards Judgement H H H VH VH H
Reordering VH VH H H H
QA(j) L M H VH P
Value L M H H H
Complaints Judgement M P H VH VH H
Reordering P VH VH H M
QA(j) L M H VH P
Value L M H H M
controlling the length of time crude palm oil is kept in the storage tank and improving the quality of care for crude palm oil in the storage tank.
(3) The storage at the port could be improved by controlled loading and unloading of the crude palm oil, ensuring the availability of tankers as needed, checking the qual-ity of the oil in the storage tank, controlling the length of time crude palm oil is kept in the storage tank and maintaining the reliability of storage tank.
The production plan consists of a list showing the volume of crude palm oil produced, under constraints such as plant capacity, supply of the palm fruit, percentage of material damage and yield. The production plan is a requirement of the senior management, typically scheduled monthly as part of the corporate strategy to address production issues. The total production of crude palm oil is affected by the value of all the available raw materials to be processed. The production plan involves all parties, both in terms of raw material procurement, production, quality assurance and marketing. The relevant decision-makers, such as the plantation manager, factory manager and the marketing section need to discuss the results of the production planning.
Important roles in the production planning system of crude palm oil supply chain include:
• Supporting the success of the marketing function to achieve sales targets.
• Participating in the preparation of budgets and financial plans of the company.
• As indicators of performance, required to control the over-all production strategy.
• Supporting the successful coordination between manage-rial functions.
• As a formulation of strategy, vertically and horizontally, at the enterprise level.
The application of this method relies on the availability and consistency in the interpretation of data. The risk assessment and performance measurement using the non-numerical evaluation can be done by the managers based on the benchmark set by the company. A database system will then determine the accuracy of their assessment. Coordination between the unit processes along the supply chain is therefore crucial to the success of this method.
Finally, consideration of performance was part of the process of coordination between supply chain operational units that requires a smooth flow of accurate and timely information. Models • Performance improvement could focus more on low value
indicators to enable the supply chain to operate more effectively and efficiently
• Waste management from the raw materials process-ing could be done in a more controlled manner, so as to increase the economic value for the company.
The managers will benefit from the implementation of this system if a user-friendly software tool is successfully designed. The benefits could include more realistic target planning, clearer prediction of risk and more focused performance improvement. The design of the system is based on focused execution of key success factors, allowing planning, control and evaluation. The effectiveness and efficiency of the palm oil supply chain can also be improved by adopting the system. The role of decision-makers can be supported by the system, so that the consistency of deci-sions can be well documented, maintained and reported.
Risk assessment developed in this study is an integral part of the supply chain management. The predictive value of risk is defined as the quality of risk that may occur. An assessment was carried out by decision-makers at the operational level. Having identified and assessed the risks, the decision-makers must select alternative options that should be carried out in order to mitigate any risks. One way to do this is to determine the actions to cope with any potential risk to the operational units.
The case study demonstrates that the framework is applica-ble to the operations of sustainaapplica-ble palm oil supply chain. The results also provide some important insights for improving the operational management issues of sustainable palm oil supply chain in Indonesia.
There are several recommendations that the industry should consider:
(1) At the plantation level, by increased surveillance during the harvesting of the palm fruit, minimising the trans-port times of harvested fresh fruit bunches to the fac-tory, reducing unnecessary handling in order to reduce the likelihood of the fruit being wasted or leftover, ensuring the availability of transport for the harvested fruit and supervising the loading and unloading from the truck.
(2) At the palm oil factory, by maintaining the accuracy of the sorting process, maintaining the quality of the fruit on the loading ramp (a temporary build-up), checking the reliability of the process parameters and machines, Risk indicators Calculation parameters
i-th Expert
Aggregation
1 2 3 4 5
Government regulations Judgement M H M H H H
Reordering H H H M M
QA(j) L M H VH P
Value L M H M M
Local culture Judgement M VH H VH H H
Reordering VH VH H H M
QA(j) L M H VH P
Value L M H H M
Criminal attack Judgement M H H VH M H
Reordering VH H H M M
QA(j) L M H VH P
Value L M H M M
Table 5. Computational result of performance measurement.
Performance indicators Calculation parameters
ith Expert
Aggregation
1 2 3 4 5
Demand Judgement VH VH VH VH VH VH
Reordering VH VH VH VH VH
QA(j) L M H VH P
Value L M H VH VH
Product price Judgement VH H L VL VH H
Reordering VH VH H L VL
QA(j) L M H VH P
Value L M H L VL
Material price Judgement VH M M H VH H
Reordering VH VH H M M
QA(j) L M H VH P
Value L M H M M
Quality Judgement VH H M H VH H
Reordering VH VH H H M
QA(j) L M H VH P
Value L M H H M
Delivery reliability Judgement H H H H H H
Reordering H H H H H
QA(j) L M H VH P
Value L M H H H
Responsiveness to meet demand
Judgement H VH VH H VH H
Reordering VH VH VH H H
QA(j) L M H VH P
Value L M H H H
Security of shipping to customers
Judgement L L L H M M
Reordering H M L L L
QA(j) L M H VH P
Value L M L L L
Manufacturing cost Judgement M L M VH H M
Reordering VH H M M L
QA(j) L M H VH P
Value L M M M L
Forecasting accuracy of demand
Judgement M M M VH H M
Reordering VH H M M M
QA(j) L M H VH P
Value L M M M M
Energy consumption cost Judgement M L H L H M
Reordering H H M L L
QA(j) L M H VH P
Value L M M L L
Waste reduction Judgement L L M L H M
Reordering H M L L L
QA(j) L M H VH P
Value L M L L L
Reuse and recycle Judgement L H M L M M
Reordering H M M L L
QA(j) L M H VH P
Value L M M L L
Hazards Judgement M VL VL L H M
Reordering H M L VL VL
QA(j) L M H VH P
Value L M L VL VL
Remanufacturing cycle time Judgement M L M L VH M
Reordering VH M M L L
QA(j) L M H VH P
Value L M M L L
Land Judgement H L L L M M
Reordering H M L L L
QA(j) L M H VH P
Value L M L L L
Maintenance cost Judgement H L L L H M
Reordering H H L L L
QA(j) L M H VH P
Value L M L L L
Labour cost and rewards Judgement M M M L M M
Reordering VH H M M M
QA(j) L M H VH P
Value L M M M M
Complaints Judgement M M M L L M
Reordering VH H M M M
QA(j) L M H VH P
Value L M M M M
providing assurance to the plasma plantations (external supplier of raw materials) which are needed by the companies to maintain the economies of scale. Coordination and collaboration create a close partnership between the company and suppliers, where suppliers have a responsibility to maintain the continuity of the availability of raw materials, based on the information provided.
7. Conclusions
This study provides a platform for the effective operation of a palm oil supply chain, especially in the context of Indonesia. From the study, it can be concluded that there are three criti-cal components involved in the supply chain management of palm oil, namely risk assessment, performance measurement and optimisation model. Key indicators that are required for risk assessment and performance measurement have been identified, formulated and applied as a conceptual framework, manifested in the form of the DSS that can aid decision-makers in solving the underlying problems facing the palm oil supply chain. The DSS achieves this by guiding them to the root of the problem, so that the problem resolution can be appropriately targeted and executed.
The DSS includes three models that are interdependent. The relationships between the models have demonstrated the effi -cacy of the framework and the DSS, especially in the planning and operations of palm oil supply chain. Although the concept presented in this paper is applicable to a variety of supply chains in manufacturing sectors, some parts would require minor modifi -cations, according to the needs and interests of the stakeholders. The direction of future research is to develop a software tool and continue to further test the framework, perhaps in similar industry settings, e.g. perishable products.
were developed to help the decision-makers because the com-pany can perform aggregate planning, and coordinate the results with the various units involved. Certainty is an important factor
Table 6. Production planning results.
Decision variables
Month
1 2 3 4 5 6 7 8 9 10 11 12
FFSt 3.397 3.583 3.002 3.216 3.108 3.072 2.550 2.518 2.510 2.927 2.429 3.095 FFPt 3.745 5.119 4.771 5.442 5.687 6.026 5.488 5.321 5.783 5.919 4.913 5.203
FFLt 0 0 0 0 0 0 85 3.611 3.398 2.935 4.924 3.956
CPOt 1.345 1.608 1.426 1.581 1.598 1.645 1.458 1.976 2.016 2.056 2.096 2.136
INVt 1.699 1.571 1.221 987 729 478 0 0 0 0 0 0
Set data
Set worksheet
for data entry
Complete Solver
parameters
Run Solver
Repair or
additional data
required?
Record solutions
No
Yes
Figure 5. Computation process of production planning. Performance indicators Calculation parameters
ith Expert
Aggregation
1 2 3 4 5
Government regulations Judgement M VH M H L M
Reordering VH H M M M
QA(j) L M H VH P
Value L M M M M
Local culture Judgement L H M L M M
Reordering H M M L L
QA(j) L M H VH P
Value L M M L L
Criminal attack Judgement M VH M L H M
Reordering VH H M M L
QA(j) L M H VH P
Value L M M M L
Bloemhof, J. 2005. “Sustainable Supply Chains for the Future.” Medium Econometrische Toepassingen 13 (1): 12–15.
Cảceres, R. G. G., M. E. M. Avella, and F. P. Gòmez. 2015. “Tactical Optimization of the Oil Palm Agribusiness Supply Chain.” Applied Mathematical Modelling 39: 6375–6395.
Carter, C. R., and P. L. Liane Easton. 2011. “Sustainable Supply Chain Management: Evolution and Future Directions.” International Journal of Physical Distribution & Logistics Management 41 (1): 46–62.
Chung, S. L., and H. M. Wee. 2006. “Sustainable Supply Chain Coordination Policy using Price Discounting.” In Proceedings of the 7th Asia Pacific Industrial Engineering and Management Systems Conference 2006, 1899–1911. Bangkok, Thailand
Colicchia, C., A. Creazza, F. Dallari, and M. Melacini. 2016. “Eco-efficient Supply Chain Networks: Development of a Design Framework and Application to a Real Case Study.” Production Planning & Control 27 (3): 157–168. Cramb, R., and McCarthy, J. F., eds. 2016. The oil palm complex: Smallholders,
agribusiness and the state in Indonesia and Malaysia. Singapore: NUS Press. Djohar, S., H. Tanjung, and E. R. Cahyadi. 2003. “Building a Competitive
Advantage on CPO through Supply Chain Management: A Case Study.” Jurnal Manajemen & Agribisnis 1 (1): 20–32.
von Geibler, J. V. 2013. “Market-based Governance for Sustainability in Value Chains: Conditions for Successful Standard Setting in the Palm Oil Sector.” Journal of Cleaner Production 56: 39–53.
Gopal, P. R. C., and J. Thakkar. 2016. “Sustainable Supply Chain Practices: An Empirical Investigation on Indian Automobile Industry.” Production Planning & Control 27 (1): 49–64.
Guide Jr, V. D. R., and L. N. van Wassenhove. 2009. “The Evolution of Closed-loop Supply Chain Research.” Operations Research 57 (1): 10–18. Gunarta, I. K., A. Eriyatno, M. Fauzi, and B. S. Kusmuljono. 2013. “Development
of Sustainable Palm Oil Industry using Geo-Spatial Multi-Criteria Decision Analysis Model.” Jurnal Bumi Lestari 13 (1): 16–26.
Hadiguna, R. A., and M. Machfud. 2008. “Model Perencanaan Produksi pada Rantai Pasok Crude Palm Oil dengan Mempertimbangkan Preferensi Pengambil Keputusan.” Jurnal Teknik Industri 10 (1): 38–49.
Hadiguna, R. A. 2009. “Model Persediaan Minyak Sawit Kasar di Tangki Timbun Pelabuhan.” Jurnal Teknik Industri 11 (2): 111–121.
Hadiguna, R. A. 2012a. “Decision Support Framework for Risk Assessment of Sustainable Supply Chain.” International Journal of Logistics Economics and Globalisation 4 (1–2): 35–54.
Hadiguna, R. A. 2012b. “Model Penilaian Risiko Berbasis Kinerja pada rantai pasok Minyak Sawit Berkelanjutan di Indonesia.” Jurnal Teknik Industri 14 (1): 13–24.
Hansen, S. B., R. Padfield, K. Syayuti, S. Evers, Z. Zakariah, and S. Mastura. 2015. “Trends in Global Palm Oil Sustainability Research.” Journal of Cleaner Production 100: 140–149.
Hayashi, K. 2007. “Environmental Impact of Palm Oil Industry in Indonesia.” In Proceeding of International Symposium on EcoTopia Science (ISETSO07), 646–651. Nagoya: EcoTopia Science Institute, Nagoya University. Hidayat, S., and M. S. Marimin. 2014. “Agent Based Modeling for Investment
and Operational Risk Considerations in Palm Oil Supply Chain.” International Journal of Supply Chain 3 (1): 34–40.
Hidayat, S., and N. Nurhasanah. 2014. “Added-value Utility Formulation in Palm Oil Supply Chain Based on Risk, Investment and Technology.” International Journal of Business and Economics Research 3 (6): 57–64. Hidayatno, A., A. Sutrisno, Y. M. Zagloel, and W. W. Purwanto. 2011. “System
Dynamics Sustainability Model of Palm Oil Based Biodiesel Production Chain in Indonesia.” International Journal of Engineering & Technology 11 (3): 1–6.
Kushwaha, G. S. 2010. “Sustainable Development through Strategic Green Supply Chain Management.” International Journal of Engineering and Management Science 1 (1): 7–11.
Linton, J. D., R. Klassen, and V. Jayaraman. 2007. “Sustainable Supply Chains: An Introduction.” Journal of Operations Management 25: 1075–1082. Marshall, D., L. McCarthy, C. Heavey, and P. McGrath. 2015. “Environmental
and Social Supply Chain Management Sustainability Practices: Construct Development and Measurement.” Production Planning & Control 26 (8): 673–690.
Maryam, H., and M. Habib. 2013. “Book Review: Exploring the Supply Chain: Theory and Practice.” International Journal of Supply Chain Management 2 (3): 65–68.
Notes
1. Whilst these operational risks have been carefully identified, there might be other risks (i.e. land rights, political issues of even/uneven power relations in the supply chain) that are beyond operational concerns but need to be carefully addressed. This, however, is beyond the scope of this paper.
2. Cramb and McCarthy (2016) provide more detailed discussion and debates surrounding the complexity of palm oil agribusiness in Indonesia. Furthermore, Wijedasa et al. (2017) exposed the dynamic and conflicted nature of these debates, especially with regard to peatland development in the region.
Acknowledgements
This paper is supported by the research grant from Universitas Andalas contract number 04/UN.16/PL/API/2014 and the bilateral research collab-oration between the Department of Industrial Engineering at Universitas Andalas and the Centre for Logistics and Supply Chain Management at Cranfield School of Management, U.K.. The authors would like to thank anonymous reviewers for their constructive feedback to improve the quality of the paper.
Disclosure statement
No potential conflict of interest was reported by the authors.
Notes on contributors
Rika Ampuh Hadiguna obtained an Industrial Engineer degree from Universitas Sumatera Utara (USU), Medan, Indonesia, and Masters Degree in Industrial Engineering from Institut Teknologi Sepuluh Nopember (ITS) and Doctorate Degree from Bogor Agriculture University (IPB) in field of Agro Industrial Technology. He conducted postdoctoral programme at the Malaysia Institute of Transport (MITRANS), Universiti Teknologi MARA (UiTM), Selangor, Malaysia. He is a senior lecturer at the Department of Industrial Engineering, Universitas Andalas (Unand), Padang, Indonesia. His current research focus is logistics and supply chain strategy with decision support systems.
Benny Tjahjono is a senior lecturer at the Centre for Logistics and Supply Chain Management, Cranfield School of Management in the UK. His overarching research area includes Production Engineering, Service Engineering, Operations Management and Sustainable Supply Chain Management. He is currently the Cranfield’s Principal Investigator of the Horizon2020 MSCA Innovative Training Network aiming to formulate the ser-vice-oriented business model for the European Circular Economy. He is an associate editor of the Journal of Simulation and is a member of several journal editorial boards.
ORCID
Rika Ampuh Hadiguna http://orcid.org/0000-0003-4956-2509 Benny Tjahjono http://orcid.org/0000-0001-7503-7500
References
Alfonso-Lizarazo, E. H. A., J. R. M. Torres, and E. G. Franco. 2013. “Modeling Reverse Logistics process In the Agro-industrial Sector: The Case of the Palm oil Supply chain.” Applied Mathematical Modelling 37: 9652–9664. Blengini, G. A., and D. J. Shields. 2010. “Overview of the Building Products
Seuring, S., and M. Müller. 2008. “From a Literature Review to a Conceptual Framework for Sustainable Supply Chain Management.” Journal of Cleaner Production 16 (15): 1699–1710.
Shang, K. C., C. S. Lu, and S. Li. 2010. “A Taxonomy of Green Supply Chain Management capability among electronics-related manufacturing firms in Taiwan.” Journal of Environmental Management 91 (5): 1218–1226. Sikdar, S. K. 2003. “Sustainable Development and Sustainability Metrics.” The
American Institute of Chemical Engineering Journal 49 (8): 1928–1932. Solvang, W. D., and M. H. Hakam. 2010. “Sustainable Logistics Networks in
Sparsely Populated Areas.” Journal of Service Science and Management 3 (4): 72–77.
Svensson, G. 2007. “Aspects of Sustainable Supply Chain Management (SSCM): Conceptual Framework and Empirical Example.” Supply Chain Management: An International Journal 12 (4): 262–266.
Torres, J. R. M., E. G. Franco, and E. E. Blanco. 2015. “Conceptual Framework for Measuring Carbon Footprint in Supply Chains.” Production Planning & Control 26 (4): 265–279.
Widodo, K. H. 2010. “Sustainable Supply Chain Based Scenarios for Optimizing Trade-Off between Indonesian Furniture and Crude-Palm-Oil Industries.” Operations and Supply Chain Management: An International Journal 3 (3): 176–185.
Widodo, K. H., A. Abdullah, and K. P. D. Arbita. 2010. “Crude-Palm-Oil Supply Chain System in Indonesia with Economical Revenue, Social Welfare and Environment Consideration.” Jurnal Teknik Industri 12 (1): 47–54. Wijedasa, L. S., J. Jauhiainen, M. K. Könönen, M. Lampela, H. Vasander, M. C.
Leblanc, S. Evers, T. E. Smith, C. M. Yule, H. Varkkey, and M. Lupascu. 2017. “Denial of Long-term Issues with Agriculture on Tropical Peatlands will have Devastating Consequences.” Global Change Biology 23 (3): 977–982. Yager, R. G. 1993. “Non-numeric Multi-criteria Multi-person Decision Making.”
Group Decision and Negotiation 2 (1): 81–93. Nooraie, S. V., and M. M. Mellat Parast. 2015. “A multi-objective Approach to
Supply Chain Risk Management: Integrating Visibility with Supply and Demand Risk.” International Journal of Production Economics 161: 192–200. Ntabe, E. N., L. Le Bel, A. D. Munson, and L. A. Santa-Eulalia. 2014. A Systematic Literature Review of the Supply Chain Operations Reference (SCOR) Model Application with Special Attention to Environmental Issues. International Journal of Production Economics 169: 310–332.
Omain, S. Z., A. B. A. Hamid, A. R. A. Rahim, and N. M. Salleh. 2010. “Supply Chain Management Practices in Malaysia Palm Oil Industry.” In The 11th Asia Pacific Industrial Engineering and Management Systems Conference and the 14th Asia Pacific Regional Meeting of International Foundation for Production Research, 1–12. Melaka
Oosterveer, P. 2015. “Promoting sustainable palm oil: viewed from a global networks and flows perspective.” Journal of Cleaner Production 107: 146– 153.
Padfield, R., C. Preece, S. Hansen, and E. Papargyropoulou. 2011. “Exploring Opportunities for Sustainability in the Malaysian Palm Oil Industry.” In Proceeding of 2011 International Conference on Environment Science and Engineering (IPCBEE), 175–178. Singapore: IACSIT Press.
Papadopoulos, I., G. Karagouni, M. Trigkas, and E. Platogianni. 2010. “Green Marketing: The Case of Greece in Certified & Sustainably Managed Timber Products.” EuroMed Journal of Business 5 (2): 166–190.
Pokharel, S., and A. Mutha. 2009. “Perspectives in Reverse Logistics: A Review Resources.” Resources, Conservation and Recycling 53 (4): 175–182. Sarkis, J., Q. Zhu, and K. H. Lai. 2011. “An Organizational Theoretic Review
of Green Supply Chain Management Literature.” International Journal of Production Economics 130 (1): 1–15.
Production
Planning &
Control
The Management of Operations
Publish open access in this journal
Enter keywords, authors, DOI etc
Advanced search
Submit an article
!
Citation search
This Journal
"
#
New content alerts
$
RSS
%Current issue &Browse list of issues
This journal
Aims and scope ''
Instructions for authors ''
Journal information ''
Editorial board ''
Related ''
Journal news
2016 Impact Factor: 2.369 ©2017 Clarivate Analytics, 2017 Journal Citation Reports®
Call for papers
Contribute to our special issue on "Rethinking supply chains in the age of digitalisation"
Latest articles
Article Article Article Article
Subscribe
Volume 28,
2017
Issue
Communicating supply chain risks
and mitigation strategies: a
comprehensive framework
Xiaojun Wang, Puneet Tiwari & Xu Chen
Pages: 1023-1036
Published online: 22 May 2017
Abstract|Full Text|References|
Using queueing models to estimate
system capacity
Björn Lantz & Peter Rosén
Pages: 1037-1046
Published online: 25 May 2017
Abstract|Full Text|References|
See all volumes and issues
)
'
knowledge sharing in product
design
Zahir Irani, Amir M. Sharif, Thanos Papadopoulos & Peter E. D. Love
Pages: 1047-1065
Published online: 23 May 2017
Abstract|Full Text|References|
PDF (1229 KB)
0
CrossRef citations
0
Altmetric
Managing demand variability and
operational effectiveness: case of lean
improvement programmes and MRP
planning integration
Paul Hong & Zachary Moran Leffakis
Pages: 1066-1080
Published online: 29 May 2017
Abstract|Full Text|References|
Article
PDF (1187 KB)
95
Views
0
CrossRef citations
0
Altmetric
Cost performance of public
infrastructure projects: the nemesis
and nirvana of change-orders
Peter E. D. Love, Zahir Irani, Jim Smith, Michael Regan & Junxiao Liu
Pages: 1081-1092
Published online: 29 May 2017
Abstract|Full Text|References|
Article
PDF (1647 KB)
140
Views
2
CrossRef citations
6
Altmetric
A framework for managing
sustainable palm oil supply chain
operations: a case of Indonesia
Rika Ampuh Hadiguna & Benny Tjahjono
Pages: 1093-1106
Published online: 08 Jun 2017
Abstract|Full Text|References|
Article
PDF (975 KB)
298
Views
0
CrossRef citations
0
Altmetric
* Top
Production Planning & Control
Submit an article
#
New content alerts
$
RSS
!
Citation search
View more
Explore
Most cited articlesOpen access articles
Case
studie
s in
opera
tions
mana
geme
nt
Childe
Published online: 18
Feb 2011
Views: 18454
Editorial
Develo
pment
of
supplie
r
relation
ship
includi
ng cost
of
defecti
ves in
the
cyclic
product
ion
Sharma
Published online: 8
Aug 2013
Views: 8444
Article
Applicat
ion of
value
stream
mapping
for lean
operatio
ns and
cycle
time
reductio
n: an
Indian
case
study
Seth * et al.Published online: 21
Feb 2007
Views: 6552
Article
Challe
nges
in
appar
el
produ
ction
plann
ing
and
contr
ol
Wallace et al.Published online: 11
Mar 2011
Views: 4730
Editorial