Study of factors Involved in Smartphone Brand Preference by Young
Consumers in Delhi
Faheem Ahmed*
Ph.D Research Schola r, faculty of management, Jamia Hamdard (Hamdard University),Hamdard Nagar, New Delhi-110062 email: [email protected]
Dr. Reshma Nasreen
Associate professor, faculty of management, Jamia Hamdard (Hamdard University), Hamdard Nagar, New Delhi-110062*corresponding author
Abstract
In today’s world the Smartphone users are increasing day by day as these Smart phones provide many facilities at one point. Smart phones can be considered to be the substitutes of laptops with an additional feature of calling. The study is carried out by the researchers to find out the Smartphone preferences by the consumers in the Delhi and NCR. The purpose of the study is also to better understand the current dynamics of the market for Smartphone and the usage behavior of consumers in Delhi and NCR. This study also looked into the familiarity of users towards Smart phones, choices of Smartphone brands and most importantly in determining the influencing factors that influence the purchase decisions of consumers. Additionally, the
consumer’s preferences on Smartphone specifications such as design, multimedia, operating platform, and price were investigated. The study also tries to find out the consumers perception for their Smartphone brands. The research consists of 100 respondents and among which are students and working people. The analysis is carried out through SPSS software and results were determined through various tests such as correlation, cross tabulation etc. The study will help the Smartphone companies to develop their marketing strategies as per the consumer preferences. Keywords: Consumer Behavior, Consumer Preference, Influencing Factors, Smartphone Strategies
Introduction
(Entner, 2010). Balakrishnan and Yeow, has observed that the Smartphone possession in US is skewed towards the younger generation people in age group of 25 to 44, (Balakrishnan and Yeow, 2007). Another study done by Scarborough Research concluded that the young Americans within the age bracket of 18 to 24 years are more familiar and comfortable with the text- messaging feature on their cell phones, (Texting, 2008).
Worldwide sales of Smart phones surpassed those of feature phones in early 2013. As of July 18, 2013, 90 percent of global handset sales are attributed to the purchase of Android and iPhone Smartphones. India is set to become the third- largest market for Smartphones in four years, according to researcher IDC, with phone makers launching more affordable 3G handsets and looking to tap buyers in small cities and towns.
Smartphone shipments to India are forecast to rise to 155.6 million units in 2017 from 27.8
million now, accounting for a 10.3% share of the global market behind China’s projected 30.2%
share and the US’s 12.1%, according to the IDC Wor ldwide Quarterly Mobile Phone Tracker report, released on 4 March. India currently ranks sixth with a global market share of 3%; China has a 32.8% share and the US 15%.
India’s Smartphone market is expected to grow sharply because of a variety of factors, including greater accessibility of low-cost devices and importance on less populous regions. In addition, expansion of 3G network coverage and the rollout of 4G networks are expected to boost Smartphone sales in the country.
According to the IDC report, India’s year-on-year Smartphone shipment growth is expected to be the highest among the top countries—China, US, UK, Japan and Brazil—in the list as a majority
of the country’s mobile phone users presently use regular feature phones.
Literature Review
The Engel, Kollat and Blackwell model shows consumers’ buying-decision process, which is based on the field of consumer psychology theories such as those developed by (Howard , 1963). Innovativeness, defined by Bayus (2008) as ―the individual inherent innovative personality, predisposition, and cognitive style toward innovations that can be applied to consumption
domain across product classes‖, is the essential factor upon which all segment characteristics come from. It refers to the predisposition to adopt an innovation earlier than most other people do. Modernisers play a major role in the diffusion and ultimate adoption of a new product. Therefore, it is not remarkable the effort that academic research put on to identify variables useful at spotting this category. Reviewing the literature that covers the profiling of early adopters, it is possible to identify three major academic streams. The first stream was successful at relating consumer personal characteristic to new product adoption behaviour, suggesting that Innovators are likely to be younger, have higher levels of incomes and education, have greater social mobility, favourable assertiveness toward risk, and have social contribution a nd higher opinion leadership (Dickerson and Gentry 1983; Gatignon and Robertson 1991; Rogers 2003; Kavak and Demirsoy, 2007).
constantly (Lane & Manner, 2011). The Smartphone does not only act as a medium for telecommunication, but it also helps in connecting to the world on various other ways. These gadgets facilitate consumers to make use of social media sites and email right away. They also let consumers surf the web, play games, and listen to music (Lane & Manner, 2011). The Smartphone has numerous other functions like online banking, watching live television and online movies, and reading e-books.
While marketers have been diligent in studying the demographic characteristics of Smartphone users, they have ignored the impact of preferences on Smartphone ownership and use. The purpose of this study is to examine which preferences by young who are using a Smartphone and most likely to have a Smartphone and which functions are most important to them.
Devaraj et al, (2008) found that agreeableness has a positive association with beliefs about the perceived usefulness of technology. While investigating, how young people’s exploits technology Ehrenberg (2008) found that more displeasing individuals spend more time on calls and that displeasing individuals with comparatively lower self-esteem spent more time using instant messaging and shows stronger instant messaging addictive tendencies. Phillips et al. (2008) revealed that people with low agreeableness were more likely to use their phones to play games. Devaraj et al. (2008) found that assiduousness governs the relationship between perceived usefulness of technology and intention to use technology, such that the relationship was stronger for individuals with higher assiduousness.
Methodology
Primary data were collected by means of survey through structured questionnaire. The data were collected from Delhi. The targeted audience was student and working executives. All the respondents were between the age group of 15-40 years at the time of survey. Secondary data were collected from articles, journals and internet as well as various articles, papers and thesis related to topic.
Data collection
Data was collected from students and young executives through structured questionnaire. In all, 100 questionnaires were distributed, out of which 70 questionnaire were returned back and only 60 respondent’s questionnaire were chosen for data analysis.
Explorative research design is being carried out using snowball sampling method
Sample Size
60 respondents were randomly selected and research was undertaken in Delhi
Results
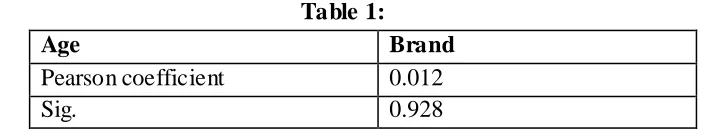
i) Correlation between age group and the brand.
Table 1:
Age Brand
Pearson coefficient 0.012
Sig. 0.928
Hypothesis- H01: There is no relation between age group and the brand of Smartphone, Ha: There is a relationship between age group and the brand of Smartphone
Interpretation: As shown in the above table 1, the significance level between age group and brand comes out to be 0.928 at 95% confidence interval level which is more than 0.05. It reveals a non-significant relationship between age and brand of Smartphone at p < .05. Hence the null hypothesis is accepted resulting into the rejection of alternate hypothesis. This shows that there is a relationship between age group and brand of Smartphone as shown in above table. The relationship is .012 which is a positive relationship.
ii) Correlation between Income and price factor
Hypothesis- H02: There is no relationship between income of consumer and price of the smart phone, Ha: There is relationship between income of consumer and price of the smart phone.
Table 2
Income Price
Pearson coefficient 0.034
Sig. 0.798
a non-significant relationship between income and price factor of Smartphone at p < .05. Hence the null hypothesis is accepted resulting into the rejection of alternate hypothesis.
iii) Correlation between Occupation and mode of payment
Hypothesis- H03: There is no relationship between occupation of consumer and the mode of payment by the consumer, Ha: There is relationship between occupation of consumer and the mode of payment by the consumer.
Table 3
Occupation Mode of Payment
Pearson coefficient 0.110
Sig. 0.401
Interpretation:As shown in the above table 3, the significance level between occupation of consumer and price factor comes out to be 0.401 at 95% confidence interval level which is more than 0.05. It reveals a non-significant relationship between occupation and mode o f payment of Smartphone at p < .05. Hence the null hypothesis is accepted resulting into the rejection of alternate hypothesis.
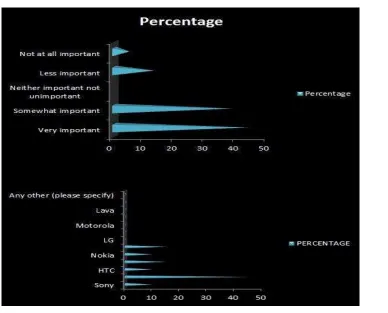
Figure 1: Bar diagram showing % of brand users and importance of price
Interpretation: As shown in the above figure, the maximum number of Smartphone is used by consumer is Samsung and their usage percentage is 48.3%, whereas around 15.0% of respondents are using Apple. On the other hand 13% of consumers are using Nokia and Sony is used by 10% of consumers.
Interpretation: As shown in the above figure 1, the majority of the respondents, 43.7%, say that price is an important issue. 38.3% of the respondents say that price is somewhat important. 13% respondents admit that price is less important as far as Smartphone are concerned.
ii) Place of purchase
Table
Interpretation: As shown in the table, the most favored place of purchasing is company outlet.48.3% of the respondents admit this. 36.7% respondents preferred to buy Smartphone from the multi-brand store. 15% of the respondents are willing to buy the product online as well. Online purchase is a growing trend for Smartphone.
iii) Preferences on the basis of feature
Table 4
Preference Design Multime dia Cell
feature important for Smartphone whereas 56.7% consumers admitted that multimedia is very important
factor for Smartphone. However, 41.7% consumers revealed that design is somewhat important and 25% consumers revealed that battery is somewhat important in case of Smartphones. 8.3% of the consumers also mentioned that additional features are not at all important in Smartphone.
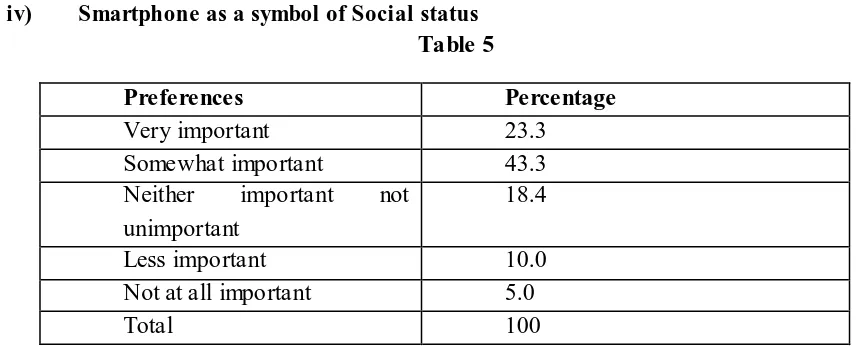
iv) Smartphone as a symbol of Social status
Table 5
Interpretation:As shown in the above table 5,43% consumers feel that Smartphone is somewhat a symbol of social status. Only 23.3% respondents felt that it is very important symbol of social
status. 18.4% respondents felt that it’s neither important nor unimportant hence neutral. Only
10% respondents say that it is less important as a social status to have a Smartphone.
v) Influence of external factors important for the purchase decision of Smartphone. Also, 38.3% respondents showed that family
somewhat important. 45% of the respondents would like to follow the professional advice while
Interpretation: Table 8, reveals 11.1% users are using Apple mobile within age group 15-20 years. Samsung is 2nd most preferred mobile i.e. 37.9%, under the age group 20-25 years whereas Blackberry mobile was used by 42.9% users in the same age group. Also within the age group of 26-30 years, 42.9% users preferred blackberry mobile. 37.5% users preferred Nokia.
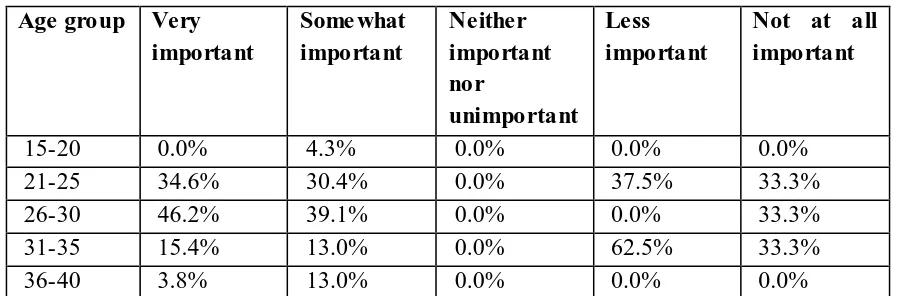
2) Age group and importance of price Table 9:
Interpretation: Table 9, revealed that in the age group of 26-30 years, 46.2% users said that price is an important issue, 62.5% user in age group 31-35 said that price is less important issue. 46.2% respondents said that price is very important issue in the age group of 26-30 years.
Discussion
Exploration of Smartphone consumer behaviour by finding the determents of Smartphone purchase. The result shows that product performance, branding, product design along with the
price have the influence on people’s buying decision process, which booms to the works that whether the product can satisfy people’s needs, branding, appearance, and price can affect consumer behaviour. According to consumer behaviour models, whether the product is able to
satisfy people needs is one of the arguments that influence people’s buying decision. In the case
of Smartphone, the product performance is considered as the influence that defines whether
one’s major needs could be satisfied; literature suggests that brand name has the effect on certain level to the understanding of product quality, therefore in this study; brand image of a Smartphone vendor affects people’s consumption decision. However, the influence is rather
small when comparing with other factors Appearance/Design influences consumers’ behaviour
The main contributions of the thesis is to deconstruct existing theories of consumer behaviour, proposing an alternative clarification of consumer behaviour in Smartphone purchase in which major factors that affect Smartphone buying were found through analysis. Findings are able to aid vendors in the marketing of Smartphone.
The factors in this study were defined strictly based on the literature. Hence, it is difficult to cover the whole scope from a certain dimension. For example, in this study branding is defined as the experience and the frequency of advertising that consumers perceived. Yet, the importance of whether one can shape his/her ideal self- image through brand image was ignored. This kind of questions could change the result enormously. On the other hand, the number of samples required to directly represent the distribution may be prohibitively large. As unintentional sampling was applied in this study and the sample size is small, the generalities about the total population cannot be made scientifically. In fact, most of the respondents of the sample are belong to the younggeneration. Since external influences, such as culture, social, and personal factors, affect consumer behaviour, the result is not unbiased. Also, this study is based on a one-time survey. A longitudinal study to show the measurement of motivation for better reliability is recommended.
Conclusion
In our survey, we come to know that there is no relationship between age group and the brand of Smartphone. Also there was no relationship between income of the consumer and price of Smartphone. It is evident by the data observed. Moreover companies are targeting younger consumer as purchasing power has increased and user are well aware of the benefit of Smartphone. Users are also exploring all mode of payments, hence having greater flexibility in terms of payment, however maximum number of consumer still prefer to purchase from the company outlet.
On the other hand, multi-brand purchase is on second position. In our finding we also came to know that maximum numbers of users are of Samsung Smartphone, Apple is on second position, and Nokia is on 3rd position in terms of Smartphone brand used by respondents. Blackberry and Sony comes on 4th and 5th position respectively.
Price is very important issue while doing a purchase of Smartphone. Status symbol is also attached with a Smartphone and hence more exclusive the mobile more status symbol it has. The Smartphone purchase decision is also influenced by the external factors. Professional advice is the most important followed by family and friends.
Among various feature of Smartphone, touch screen, user friendly, battery life are most favored features whereas multi-sim and keypad were least favored feature in Smartphone.
References
"Texting demographics." (2008) [Online] Available: http://pghama.blogspot.com/ 2008/11/texting-demographics.html.
Aner Sela, Jonah Berger (2012) How Attribute Quantity Influences Option Choice. Journal of Marketing Research: December 2012, Vol. 49, No. 6, pp. 942-953.
Balakrishnan, V. and P.H. P. Yeow. (2007) 'testing satisfaction: does age and gender make a difference? International Journal of Computer Science and Security 1 1, 85-96.
Bayus, B. (2007), Understanding customer needs, the Handbook of technology and innovation.
Devaraja, S.R. F. Easley, J. M. Crant. (2008)"How Does Personality Matter? Relating the Five Factor Model to Technology Acceptance and Use." Information Systems Research 19 1, 93-105.
Dickerson, Mary Dee and James W. Gentry (1983). Characteristics of Adopters and Non-Adopters of Home Computers. Journal of Consumer Research 10 (September): 225-235.
Ehrenberg, A. S. Juckes, K. M. White and S. P. Walsh (2008) Personality and self-esteem as predictors of young people’s technology use. Cyber Psychology and Behavior 11 6, 739- 741.
Entner, R. (2010) Smartphones to overtake feature phones in US by 2011 [Online] Available:
Gatignon, Hubert and Thomas S. Robertson (1991). Innovative Decision Process. In Handbook of Consumer Behavior. Eds. Thomas S. Robertson and Harold H. Kassarjian. Englewood Cliffs. NJ: Prentice Hall.
Howard, J. A. and Sheth, J. N. (1969) ―The Theory of Buyer Behavior‖. New York. Wiley, pp.30. IDC worldwide mobile phone tracker, (2012). ―Worldwide Mobile Phone Market Maintains Its
Growth Trajectory in the Fourth Quarter Despite Soft Demand for Feature Phones, According to
IDC‖. Available at: http://www.idc.com/getdoc.jsp?containerId=prUS23297412. Accessed
21/4/2012.
Kavak, B., Demirsoy, (2007). Identification of adopter categories for online banking inTurkey. The Service Industries Journal. Vol. 29, No. 8, August 2009, 1037–1051.
Lane, W., & Manner, C. (2011). The impact of personality traits on smartphone ownership and use. International Journa l of Business and Social Science, 2(17), 22-28.
Phillips, J. G. S. Butt and A. Blaszczynski (2008). Personality and self-reported use of mobile phones for games. Cyber Psychology & Behavior 9 6, 753-758.
Rogers, E. M. (1983) Diffusion of Innovations, 3rd ed. The Free Press, New York.