AKUISISI-Vol. 11 No. 2 November 2015 11
JANUARI EFFECT IN THE INDONESIAN
STOCK EXCHANGE:
COMPARISON OF BIG AND SMALL CAP STOCKS
ARDIANSYAH JAPLANI
[email protected]
Universitas Muhammadiyah Metro
ABSTRACT
Researchers have detected in the financial markets the presence of the January effect, which refers to the historical patterns of higher returns in January than that of the other months(Feb-Dec). This study investigates that the exixtence of January effect on small capitalization stocks is much stronger than the big capitalization stocks in Indonesian stock exchange. We found that there is no January effect in Indonesian Stock Exchange. We explain this phenomenon by examining all stocks, as measured by the t test and analysis regression of dummy. We still use the similiar procedure by using t test and dummy regression, but the sample is divided into big and small capitalization stocks. We found that the January effect is stronger for big capitalization stocks than the small capitalization stocks.
Keywords: Stock returns, Big capitalization stocks, small capitalization stocks, T test, and Regression of dummy.
Introduction Background
The effectiveness of stocks market information, the first mentioned by Fama et al. (1969), was on the agenda of the financial community since then. According to Fama (1970) influential review of the theoretical and empirical work on efficient capital markets, finance literature has dominated by working on large informational efficiency. However, the efficient market hypothesis has never been out of the question.
For example, any predictable pattern of stock returns as evidence againts the theory of efficient markets. A well-known objection to the market efficiency in this type arises from the seasonality of stocks returns. Seasonal anomalies or calender effects on the stock market have a lot discussion among scientists and practitioners. Significant seasonal effecs documented in the literature in this area is the first month of the year or the effects that we called January effect, weekday effect, turn effects month year effects and the effects of holidays.
This fluctuation in the share price also has direct impact on stock returns, which is traded on the capital market. Therefore, the investor a certain strategy in connection with the fluctuation of stock prices should be established. There is a condition that causes the fluctuation of stock prices, one of these conditions resulted in abnormal return. It’s called anomaly. One of these anomalies is a January effect. In this study we try to investigate the existence of the January effect.
12 AKUISISI-Vol. 11 No. 2 November 2015 Sindang (1997), who examined the January effect from 1994 to 1997 in JSX. He noted that the January effect is present only during the 1996-1997 and does not have any effect in share in January. This result supports the view that the January effect does not occur all the time in January and consistently for all stocks, but it is seasonal and only for some stocks. Ulansari (2002) indicates that there is January effect during 1996-1997 in JSX
since the average sample portfolio’s mean return and market return of five trading days
around January is positive and higher than the average sample portfolio’s mean return and market return of the other days during six years period. Darwedi(2002) by using return data from 100 firms listed on JSX during 1994-1996 does not find January effect exixtence. He shows that January effect in JSX during 1999-2000. However, he investigates January effect based on descriptives statistic only. But most researchers do not separate between companies which have big capitalization stocks and companies that have small capitalization stocks. So the results are not relevant in which only one or two seasons affected by January effect. But the research conducted by Darwedi (2002) using big and small capitalization stocks as comparison is the result that shows that there is a big rate of return on small capitalization stocks on January compared to February-December. Therefore it is split between the big market capitalization and the small market capitalization. This is the reason why we are interesred to do this research.
There is no consensus view on the causes of the January effect. The most compelling is tax-induced selling: during December, the final month in a tax year, investors sell stocks that have been already declined during the year to book capital losses, thereby tax-sheltering realized gains on the other stocks and further depressing the
prices of losing stocks. Beyond the year’s end, this downward price pressure is not just
relieved but reversed as the proceeds of sales that are reinvested. Although the tax-loss selling hypothesis has received widespread recognition as explanation of the January effect, it has been challenged and critically examined by many economists. Based on the tax system in Indonesia when the investors sell the losses, the bear income tax with tariff based on the Pasal 1 ayat (2) Peraturan Pemerintah Nomor 41 Tahun 1994. Pasal 2 Keputusan Menteri Keuangan Nomor: 81/KMK/04 dated February, 6 1995, collection of income tax rates on income from the sale of shares on the stock exchange is 0,1%(one percent) of total gross value of share purchase transaction, so it is not relevant in Indonesian tax sytem in which the USA capital gain borne tax by the government but in Indonesia income tax is taken from the sale of shares not from the capital gain they get.
January effect is the average return on investment during the January will received is higher than the returns in other mmonths. Investors who make a purchase in early January and sold by the end of January is much higher than the same action in February or July or December. This January effect must to be understood by all parties and investors to avoid rash on their decision in January. This study will investigate the existence of January effet on big capitalization and small capitalization stocks on stock returns as comparison in Indonesia Stock Exchange.
Objectives of the Study
The objectives of this study are to analyze whether there are January effect comparison to big capitalization stocks and small capitalization stocks return in Indonesia Stock Exchange.
Literature Review
AKUISISI-Vol. 11 No. 2 November 2015 13 in support of the January effect for the U.S and other industrialized countries. More recently, Agrawal and Tandon (1994) investigated monthly anomalies in eighteen countries other than the U.S.
Watchel (1942), who first described a January effect in financial markets, found that the Dow-Jones Industrial Average from 1942 to 1972 showed “frequent bullish
tendencies” form December to January. Rozeff and Kinney (1976) found that the average
return on an equal weighted index of New York Stock Exchange prices from 1904 through 1974 was 3.5 percent during January and only about 0.5 percent during the other months. Banz (1981) showed that small firms had higher expected returns and Keim (1983) found that nearly half of the excess returns for small firms occured during January. Moreover, half of the January returns came during the first five days of the month, particularly on the first trading day. Gultekin and Gultekin (1983) documented evidence of seasonilty, mainly a January effect, in stock returns in 13 of 17 countries studies. Their results are particulary strong given that they used value-weighted indices that give less weight to small firms, which drive the January effect in U.S. data. Schwert (2003) concluded that the January effect weakened in the period from 1980 to 2001, but that did not still exist.
Theoretical Background Efficient Market Hypothesis
The Efficient Market Hypothesis evolved in the 1960s from Eugene Fama’s Ph.D
dissertation. He persuasively made the argument that in an active market that includes many well-informed and intellegent investors, securities will be appropriately priced and reflects all available information. If a market is efficient, no information or analysis can be expected to result in out performance of an appropriate. There are three forms of the efficient market hypothesis (Fama,1965):
1. The “weak” form asserts that all past market prices and data are fully reflected in
securites prices. In other words, technical analysis is of no use.
2. The “Semistrong” form asserts that all publicly available information is fully reflected in securities prices. In other words, fundamental analysis is of no use. 3. The “Strong” form asserts that all information is fully reflected in securities
prices. In other words, even insider information is of no use. Market Anomalies
Despite the strong evidence that the stock market is highly efficient, there have been scores of studies that have documented long term historical anomalies in the stock market that seem to contradict with the market efficiency hypothesis. The existence of these anomalies is well accepted. Some anomalies that occured are as follows:
1. The January effect
Stocks in general and small stocks in particular have historically generated abnormally high returns during January. According to Robert Haugen and Phillipe Jorion (1996)
“The January effect is, perharps the best know example of anomalous behaviour in
security markets throughout the world.” January has historically been the best month
to be invested in stocks than other month. The impact of these trends show a declining stock returns at the end of December and then increased in January which is higher than is expected then it is called abnormal return in January, especially n stocks of small companies.
2. The Monday effect
14 AKUISISI-Vol. 11 No. 2 November 2015 a time when stocks were traded on Saturdays. Fields had also found in a 1934 study that the DJIA commonly advanced the day before holidays.
3. Another interesting anomaly is the so-called Mark Twain effect which concerns that average returns during the month of October are significantly lower than those in the rest of the year. According to quotation from Cadsby (1989), Twain (1981), in his
classic novel, writes “October. This is one of the peculiarly dangerous months to speculate in stocks in. The others are July, January, September, April, November,
May, March, June, December, August, and February.” Cadsby (1989) provides
evidence in the support of the Mark Twain effect in canadian stock market.
The January Effect
According to W. Sharpe, G. Alexander. & J. Bailey (1999), January effect is caused by three reasons: (1) tax loss selling, (2) window dressing, (3) small stock beta or small stock capitalization.
1. Tax Loss Selling
Reflecting on January effect, Constantinides (1984) shows that with zero transaction costs, investors should sell losers immediately to realize capital losses. Adding transaction costs to this scenario, Constantinides (1984) find that investors will postpone selling until the cost of not selling outweights the transaction costs.
2. According to the window dressing hypothesis, developed by Haugen and Lakonishok (1987), Lakonishok, Josef, Andrei Shleifer, Richard Thaler, and Robert Vishny (1991), Institutional managers are evaluated based on their performance, the instituitions buy both risky stocks and small stocks but sell them before the end of the year so that they not show up their year-end holdings. At the beginning of the following calender year (in January), investment managers reverse the process by selling winners, big stocks, and low risk stocks rather than replacing them with small and risky stocks that typically include many past losers. And also new information provided by the firms at the end of the fiscal is the second explanation of the January effect. Rozeff and Kinney (1976) suggest that abnormal return in January due to the information provided by the firms at the end of the fiscal year. Note that for many
firms announcements of previous year’s financial performance, like accounting
earnings, are made in January.
3. Bruce I. Jacobs and Kenneth N. Levy, CFA (1999) had previously found that a large percentage of a returns between big and small companies occured in January. Some analysts argue that the small company’s measured by eta. A beta of 1 indicates that the security will be less volatile than the market. A beta of greater than 1 indicates that the
security’s price will be more volatile than the marke. Many big capitalization stocks
have a beta less than 1, conversely small capitalization stocks have a beta of greater than 1, as we know that there is a trade off between risk and rarte of return. Thus, because the risk of small stocks is higher in January, then rate of return on these stocks is also greater. Additionally, half of the January return occur in the first few days of
AKUISISI-Vol. 11 No. 2 November 2015 15 Hypotheses
Whether there are January effects on big capitalization stocks and small capitalization stocks return in Indonesian Stock Exchange, we propose the hypotheses as follows:
1. According to Robert Haugen and Phillipe Jorion (1996) “The January effect is,
perharps the best known example of anomalous behaviour in security markets
throughout the world.” January has historically been the best month to be invested in
stocks than other month. The impact of these trends show a declining stock returns at the end of December and then increased in January which is higher than the expected, so the first hypothesis will be as follow:
There are January effects during the period under observation.
2. Because the risk of small stocks is higher in January, then rate of return on these stocks is also greater. Rogalski and Tinic (1986) analyzed that the small company’s shares have a greater risk in January compared to other months (Feb-Dec). The second hypothesis will e as follow:
The January effect is stronger for small capitalization stocks. Research Methodology
To conduct the study, we collect the daily closing prices data and outstanding shares data. The study is conducted in Indonesia Stock Exchange. Jakarta Stock Exchange publicly disseminates the daily closing price of each stock liste in Jakarta Exchange. We use samples on IHSG:
The samples are taken from IHSG, the criteria of the samples are:
1. The stock are active stock during the reseacrh period January 2010 – December 2014. 2. The stock will be formed based on big and small capitalization stocks. Big capitalization stocks are stock with the twenty five percent (25%) highest market capitalization and the small capitalization stocks have twenty five percent (25%) lowest market capitalization.
Operational Definition of Variable Market Capitalization
The market value is calculated by the formula as folows: MV = Pt x N ...(1) Where:
MV = Market Value
Pt = Price at Day t N = Outstanding Share Stock returns
Stock return I is calculated by the formula as follow: Ri =
� −� −1
� −1 ...(2) Where
Ri = Period Return Stock of Company i Pt = Stock Price on period t
Pt-1 = Price of shares in Period t-1 The mean return i scalculated as follow:
Rit = =1 ...(3) Where
16 AKUISISI-Vol. 11 No. 2 November 2015 Testing Procedure
Teting procedure basically is as follow :
A. To test the first hypothesis, two methods are conducted:
1. The first method is t test (see equation 4). The t-test assesses whether the means of two groups are statiscally different from each other. This analysis is appropriate whenever we would like to compare the means of two groups. The t
test compares the January’s return is higher than that of the other month’s return.
All stock will be calculated by using t test from year 2010 to 2014. The formula of t-test is calculated as follow:
t = �1−�2
�1−�2 ...(4) Where
X1 = Mean Experimental Groups X2 = Mean Control Group ; and
12 = Standard Deviation Experimental Groups 22 = Standard Deviation Control Group n1 = Sample Experimental Groups n2 = Sample Control Groups
It is expected that the January’s return is higher than other month’s return (Feb –
Dec)
2. The second method is Dummy regression (see equation 6). We use this method because return stocks on Indonesian stock exchange ar affected by market return and also months. The value of dummy variable is represented by number 1 for
January and for other month’s (Feb-Dec) variable s represented by zero number.
The formula regression of dummy variable is calculated as follow: a. Dummy regression.
� � = a dummy variable which equals one in January, zero otherwise. It is expected that the result from dummy regression is positive and statically significant.
B. For the second hypothesis
We still use the similar procedure by using t test and dummy regression, but the sample is divided into big and small capitalization stocks. Twenty five percent (25%) highest market and twenty five percent (25%) lowest market capitalization are chosen to represent as big and small capitalization stocks.
1. For t test in differentiating between two means for both big and small stocks will be applied.
The formula of t-test is calculated as follow: t = �1−�2
�1−�2 ...(7) Where
AKUISISI-Vol. 11 No. 2 November 2015 17
12 = Standard Deviation Experimental Groups for small.big caps 22 = Standard Deviation Control Group for small.big caps n1 = Sample Experimental Groups for small.big caps n2 = Sample Control Groups for small.big caps
It is expected that small caps show higher differences compared to other months 2. Similar procedure will be applied by using Coefficient of regression dummy (see
equation 6). This time, we differentiate the sample into big and small capitalization stocks. The value for each variable will be the same where the dummy variable is represented by number 1 for January and other months (Feb-Dec) variable is represented by zero number. From the coefficient of regression dummy test, it is expected that small capitalization stock wil show higher and significant coefficient of regression for dummy variables than the big capitalization stocks.
Research Finding and Analysis
In this study we use 140 active companies as samples from period 2010 until 2014. We classify the size of company and and divide it into 70 big capitalization stocks and 70 small capitalization stocks based on its market value. The daily return each stock is calculated based on the change of closing price compared to previous day closing price.
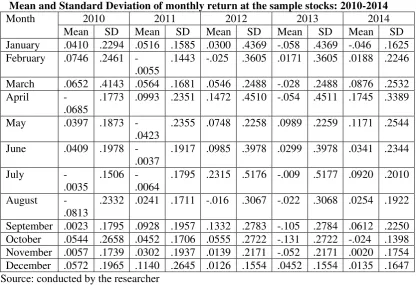
Table 1.
Mean and Standard Deviation of monthly return at the sample stocks: 2010-2014
18 AKUISISI-Vol. 11 No. 2 November 2015 Testing the First Hypothesis
T Test Analysis Summary from year 2010 to 2014
Table 2. Analysis Summary 2010-2014
Year T test Mean Remark
Lowest Highest
2010 Not Significant* August February No January Effect
2011 Not Significant* May December No January Effect
2012 Not Significant* August July No January Effect
2013 Not Significant* October May No January Effect
2014 Not Significant* January April No January Effect
*Significant level of 5%
Source: conducted by the researcher
The table show that the results of the t test is not significant in every year, which mean returns in January are not higher than that of the other months return (Feb-Dec) in each year. The result of t test were supported by the mean of each month in each year which showed the highest mean is not occured in January but in the month other than January. Even the lowest mean in January is in the year 2014. From the result of t test, we concluded that the January effect does not occur on all stock in each year.
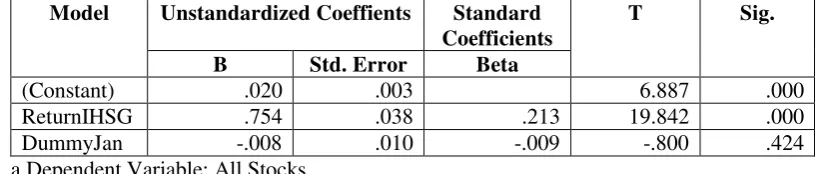
The Dummy Regression Analysis for all stocks
The result below displays all stocks by using dummy regression method. Table 3. Regression Model for all stocks
Ri,t = �+ ���,�+ ��,Jan Djan
Coefficientsa
Model Unstandardized Coeffients Standard Coefficients
T Sig.
B Std. Error Beta
(Constant) .020 .003 6.887 .000
ReturnIHSG .754 .038 .213 19.842 .000
DummyJan -.008 .010 -.009 -.800 .424
a.Dependent Variable: All Stocks
The regression model shows that the intercept is 0.020, while the regression coefficient of the market return is 0.754 and the coefficient of the dummy is -0.008. Thus, The regression for all stocks can be written as:
Y = 0.020 + 0.754Rm,t – 0.008Djan.
Coefficient i means that if market return is zero and the dummy value is zero, then the stocs return is 0.020. The i coefficient of 0.754 means that if markets return increas by one point, then all stock return increase by 0.754. Djan means return in January for all stocks is lower that of the other months return (Feb-Dec) by -0.008.
If the significant of the dummy in January, less than 5% this means that the dummy coeficient for January is significant. The table shows that the significance of dummy variable 0.424 indicates that there is not significant.
Analysis Summary for All Stocks
The first method shows t-tests on all shares that the return in January is not higher than other months of each year. This means that there is no effect on all stocks in January of each year. The results of the second method is consistent with the results of the first method, the regression coefficient of the dummy variable for all stocks in January shows that the yield is lower than in other months, but it is not significant.
AKUISISI-Vol. 11 No. 2 November 2015 19 Similiar procedure in first hypothesis is applied, but it will be divided into big and small capitalization stocks.
Big Capitalization Stocks Using T Test
Tabel 4
Mean and Standard Deviation of Monthly Return of the Big Capitalization Stocks : 2010 – 2014
Month 2010 2011 2012 2013 2014
Table 4 describeds the mean and standard deviation for big market capitalization in the year 2010-2014. In 2010, the highest average was recorded in March. Second year, on average return in April was recorded as the highest average return. September average return was recorded as the highest average return in 2012. For 2013, the highest average return was also in May and April average return in 2014 was recorded as the highest average return. It was also the highest average return 2010 to 2014. In fact , the average return in January is not the best performance for all years.
T Test Analysis Summary for Big Cap Stocks from year 2010 to 2014 Table 5. Analysis Summary 2010-2014
Year T test Mean Remark
Lowest Highest
2010 Not Significant* August March No January Effect
2011 Not Significant* May April No January Effect
2012 Not Significant* August September No January Effect
2013 Not Significant* October May No January Effect
2014 Not Significant* January April No January Effect
*Significant level of 5%
Source: conducted by the researcher
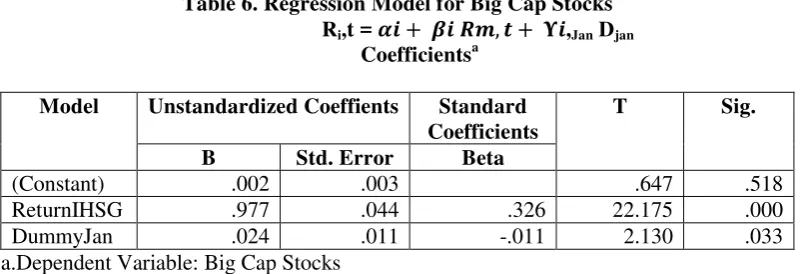
20 AKUISISI-Vol. 11 No. 2 November 2015 Big Capitalization Stocks Using Dummy Regression
Table 6. Regression Model for Big Cap Stocks Ri,t = �+ ���,�+ ��,Jan Djan
The regression model shows that the intercept is 0.002, while the coefficient regression of market return is 0.977 and the coefficient of dummy is 0.024. Therefore the regression model for big capitalization stocks can be written as:
Y = 0.002 + 0.977Rm,t – 0.024Djan.
Coefficient i means that if market return is zero and the dummy value is zero, then the stocs return is 0.002. The i coefficient of 0.977 means that if markets return increas by one point, then big cap stocks return increase by 0.977. Djan means return in January for big cap stocks is higher that of the other months return (Feb-Dec) by 0.024
If the significant of the dummy in January, less than 5% this means that the dummy coeficient for January is significant. The table shows that the significance of dummy variable 0.033 indicates that there is significant.
Analysis Summary for Big Capitalization Stocks.
The first method, i.e. the t test on big caps, shows that the January is lower than that of the other month in each year. This means that there is no January effct in the big caps in each year. But the reuslt of the t test is different from the results of the second method, in which the coefficient of dummy regression on thw big caps show that the January return is higher than that of the other months and it is significant.
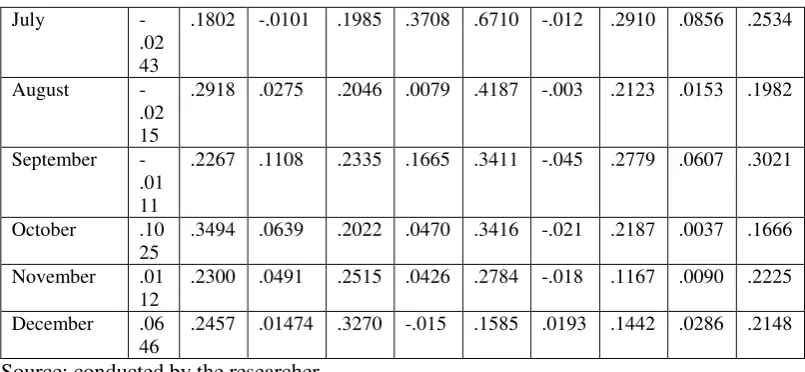
Small Capitalization Stocks Using T Test.
The table below shows a descriptive statistic of standard deviation and means in each year for small capitalization stocks.
Tabel 7
Mean and Standard Deviation of Monthly Return of the Small Capitalization Stocks : 2010 – 2014
AKUISISI-Vol. 11 No. 2 November 2015 21 October. For 2006 the highest mean for the years 2010 to 2014. In 2013, the highest mean in May was recorded. In 2014, the average for the month of January as a negative income or loss was recorded, while other mean months (Feb-Dec) was recorded as a positive return.
T Test Analysis Summary for Small Cap Stocks from year 2010 to 2014 Table 8. Analysis Summary 2010-2014
Year T test Mean Remark
Lowest Highest
2010 Not Significant* April October No January
Effect
2011 Not Significant* February December No January
Effect
2012 Not Significant* December July No January
Effect
2013 Not Significant* January May No January
Effect
2014 Not Significant* January April No January
Effect *Significant level of 5%
Source: conducted by the researcher
The table show that the results of the t test for small cap stocks is not significant in every year, which mean returns in January are not higher than that of the other months return (Feb-Dec) in each year. The result of t test were supported by the mean of each month in each year which showed the highest mean is not occured in January but in the month other than January. Even the lowest mean in January is in the year 2013 and 2014. From the result of t test for small cap stocks, we concluded that the January effect does not occur on small capitalization stocks in each year.
Conclusion
This last chapter depicts the conclusion about the research based on author’s opinion.
Conclusion
22 AKUISISI-Vol. 11 No. 2 November 2015 1. The t test shows that the return on January is not significantly higher than that of
the ither months return from year 2010-2014. As for the coefficient regression of dummy method, it shows that the dummy on January is not higher than the other months return although it is not significant. This result is consistent with the result using the t test.
2. The results from the first method t test on the big caps show that the January returns are not higher than that of the other months. It means that there is no January effect on the big caps. The second method is coefficient of dummy regression, the results from the coefficient of dummy regression for big caps show a different result where the January return is higher than that of the other months and it is significant.
3. The results of t test method for small caps show that the January return is not higher than that of the other months. That means there is no January effect in small cap andit is not significant. These results is different from the result of the second method, i.e the coefficint of dummy regression on small caps, shows that the January return is lower than that of the other months and it is significant.
4. From the results for big and small caps, it can be concluded that the January return is not stronger for small caps but it is stronger for the big caps.
5. Is there a January effect on the stock exchanges of Indonesia in January? Based on the results of a study on big and small caps stocks, there is no January effect in Indonesian Stock Exchange. Thus, the efficient market theory to explain the phenomenonnot becomes effective on the Indonesia stock exchange in January. Some studies said there is January effect on the Indonesian stock exchange, this is because the physchology of the market caused by the lack of information on abnormal stocks prices that occured repeatedly in every January. Investors use this information to buy shares in early January. Investors who make a purchase in early January and slod by the end of January is much higher than the same action in february or July or December. This January effect must be understood by all parties and investors to avoid rash on their decision in January. No matter what logic, which is designed to explain the phenomenon of the market is actually legitimate. It is important for market participants, this phenomenon isvery likely. Therefore, do not miss the opportunity.
Bibliography
Agrawal and K. Tendon. February 1994, “Anomalies or Illusions? Evidence from stock Markets in Nineteen Countries.” Journal of International Money and Finance, V. 13(1), 83-106.
Banz, Rolf W., 1981. “The relationship between return and market value of common
stocks, Journal of Financial Economics.” March, 3-18.
Brown, P., Keim, D., Kleidon, A. and Marsh, T. 1983. “Stock Return Seasonalities and
Tax-Loss Selling Hypothesis-Analysisi of the Arguments and Australian Evidence.”,
AKUISISI-Vol. 11 No. 2 November 2015 23 Bruce I. Jacobs and Kenneth N. Levy, CFA. 1999. Enhached active equity portfolios are
trim equitized long-short portofolios *revised.
Cadsby, C. B. 1989. Canadian Calender Anomalies and the Capital Asset Pricing Model, in R. M. C. Guimaraes, B. G. Kingsman and S. J. Taylor (eds.) A Reappraisal of the efficiency of financial Markets. Berlin: Springer-Verlag, 199-226
Constantinides, George M. 1984. “Optimal Stock Trading with Personal Taxes: Implications for Prices and The Abnormal January Returns.” Journal of Financial
Economics, v13(1), 65-89.
Darwedi., 2002. “Study of January effect, size effect dan low share price effect”,
University of Gajah Mada, Yogyakarta.
Eugene F. Fama, “Random Walks in Stock Market Prices, “Financial Analysts Journal,
September/October. 1965 (reprinted and revised January-February 1995).
Eugene F. Fama. “The behaviour of stock-Market Prices,” Journal of Business, XXXVIII
(January, 1965), 34-105.
Gultekin, M. And Gultekin, N.B. 1983. Stock Market Seasonality: International Evidence, Journal of Financial Economics, 12, 469-81.
Haugen R., and P. Jorion. 1996. “The January Effect: still there after all these years.”
Financial Analyst Journal 52:27-31.
Haugen, R. A and Lakonishok, J. 1988. The Incredible January Effect, Homewood, IL: Dow Jones-Irwin.
Haugen, R. A. and Wichern, D. 1973. The Diametrics of the Capital Gains Tax on the Stability of Stock Prices, Journal of Finance, 28, 987-96.
Jones, C.P., Pearce, D.K. and Wilson, J.W. 1987. Can Tax-Loss Selling Explain the January Effect? A Note, Journal of Finance, 42, 453-61.
Keim, D., 1983, “Size Related Anomalies and Stock Market Seasonality; Further
Empirical Evidence. “Journal of Financial Economics, 12: 12-32.
Lakonishok, Josef, Andrei Shleifer, Richard Thaler, and Robert Vishny, 1991, Window dressing by pension fund managers, American Economic Review, Papers and Proceedings 81, 227-231.
Manurung A.H., 2001. “Weekend effect and January effect on JSX”. Manajemen Usahawan Indonesia, March 30th 2001 : 28-34.
Reinganum, Marc R., 1983. “The Anomalous Stock Market Behaviour of Small Firms in
January: Empirical Tsts for Tax-Loss Selling Effect,” Journal of Financial Eonomics, vol.12,pp.89-104.
Rozeff, M., and W. Kinney. 1976. “Capital Market Seasonality: The case of stocks
24 AKUISISI-Vol. 11 No. 2 November 2015
Rogalski, Richard J., and Seha M. Trinic, “The January SizeEffect: Anomaly or Risk
Mismeasurement?” Financial Analysts Journal, Vol. 42, No. 6, November –
December 1986, pp. 63-70.
Schwert, G. William. “Anomalies and Market Efficiency, “in Constantinides, George M.,
Milton Harris, and Rene M. Stulz 2003 Handbook of the Economics of Finance, Elsvier.
Sindang. 1997, “Testing January effect of Manufactur Company in JSE, Indonesia.
Twain, M. 1981. Pudd’nhead Wilson, Toronto:Bantam Books.
Ulansari., 2002. “The explanotary power of moving average beta in the January effect”,
University of Gajah Mada, Yogyakarta.
Wachtel, S. 1942. “Certain Observation on Seasonal Movements in Stock Prices.”
Journal of Business 15: 184-193.