EFFECT OF LISTING AND DELISTING FROM LQ45 INDEX
TOWARDS PRICE OF A STOCK: A STUDY FROM INDONESIA
STOCK EXCHANGE
Adrian Etantyo1, Asep Darmansyah1 1Bandung Institute of Technology, Indonesia
Email: [email protected]
Abstract
In Indonesia stock market, LQ45 is regarded as one of the main indices that attracts investors attention to depict the overall stock market/ Uhe stock listed in MR56 is always changing on 6-month basis based on the criteria regulated by PT Bursa Efek Indonesia. Some investors that want to invest in liquid stocks, however, only look for the stock in the LQ45 at the moment they want to invest. In this matter, the fluctuation of transaction can happen and affect the price of the stocks over time. It is hypothesized that listing on LQ45 have a higher price because of lower risk implied on the stocks and attract more demand in the stock. The hypothesis for delisting on LQ45 is conversely with the listing. This research is bounded by the time of stocks listing and delisting, which consists of stocks listed in February 2015 to July 2015, and also stocks delisted in the same period. To analyze the data, time series method is used. The price analyzed is one year before effective date of listing or delisting, and one year after the effective date of listing or delisting. Based on selected stocks that meet the criteria, listing of the stocks in LQ45 shows a not significant price increase compared to the pre-listing period. On the delisted stocks, the result is significant price drop, which put higher risk into delisted stocks. Theconclusion is MR56 index doesnt make the price of a stock increase by some margin but once the stock came out of the index, the price will go down. In short, it is crucial to keep an eye on the LQ45 index changes because it can gives insight for investor to make the trading timing right.
Keywords: investment, stocks, stock price, capital market, listing, delisting
INTRODUCTION
Indonesia Stock Exchange has been growing vastly since Pakto 1988 that changed Jndonesias financial markets and establishment of QT Bursa Efek Jakarta (now PT Bursa Efek Indonesia. As a result, stock indices have been one of the indicators in terms of stock price movement. In February 1997, LQ45 index was created. LQ45 stands for 45 stocks with highest liquidity with some criteria of selection
stocks are known as listed in LQ45, which the effect of this phenomenon will be researched here.
LITERATURE REVIEW
Prior to conducting this research, previous research related to this topic mainly focuses on stock exchanges and indices outside Indonesia. From S&P 500 case, the delisting from the exchange shows delisted stocks have lower cumulative return (Goetzmann, Gary, 1986). Observed variables are daily price, average return, daily volume and abnormal returns of delisted stocks, added with overall S&P 500 return.
On listed stocks, previous findings shows that the listing phenomenon have an effect tied to the duration that the stock listed. In S&P 500 case, the longer listed companies have lower post-listing return (Brown, 2012). The Fama-French portfolio management method is used in his research.
Study in LQ45 index have been conducted before measuring profitability of stocks in LQ45 based on earnings per share (EPS), debt to equity ratio (D/E) and current ratio (CR). The result is all of them has positive impact toward stock return and return on asset (RoA).
Generally, capital market is the market where bonds and stocks are traded for medium to long-term financing, hence the term capital which raise the money needed by a company. The traded bonds and stock is called securities. Those securities are issued on primary market. Primary market is where new issues are offered to public investors. Later on, the investors can trade those securities among themselves in the secondary market (Bodie, 2014).
On this paper, the stock used is a common stock. A common stock is a stock that have no special preference in either receiving dividends or in bankruptcy (Ross, 2010). In other words, common shareholders have the least priority in terms of dividend payment or liquidation when the company are going to be liquidated.
Price of Stock
Stock price, or the value of the stock is valued by several methods. The most popular method used for stock valuation are using zero growth, constant growth, and differential growth (Ross, 2010). In the market, the stock price movement may as well influenced by the trading volume. Generally, there are positive relationship between trading volume and magnitude of price change (Lin, 2015). Therefore, the activity on the market can really affects the price of a stock
Stock Listing
primary listing is also similar with listing in LQ45 which the companies might want to increase their liquidity and ability to raise capital from the investors.
Stock Delisting
According to Investopedia, stock delisting is defined as removal of a listed security from the exchange where the stock traded. The reasons for delisting include violating regulation and/or fail to meet specifications set by stock exchange. As LQ45 is only an index, not a whole market of stock exchange which in Indonesia is the IDX, the stocks delisted from LQ45 is still tradeable in the IDX but just not listed in LQ45 that is one of the benchmark index of the overall IDX performance.
Effective Date (of Listing/Delisting)
In the stock market, effective date itself means the day that the stocks can be start traded in, usually used in the companies that the stocks become available to trade in the initial public offering (IPO), according to Investopedia. . The effective date can be used to denote the date when the index come into effect (Ken, 2004).
LQ45 Index
Taken from the IDX website (www.idx.co.id) the LQ45 index is composed from 45 stocks that have the highest liquidity traded on the Indonesia Stock Exchange (IDX). The 45 stocks should passes through several selection criteria that issued and regulated by PT BEI and also market capitalization of LQ45 is taken into consideration.
Maintaining the Integrity of the Specifications
The measurements are deliberate, using specifications that anticipate your paper as one part of the entire proceedings, and not as an independent document. Please do not revise any of the current designations.
METHODOLOGY
Data Collection
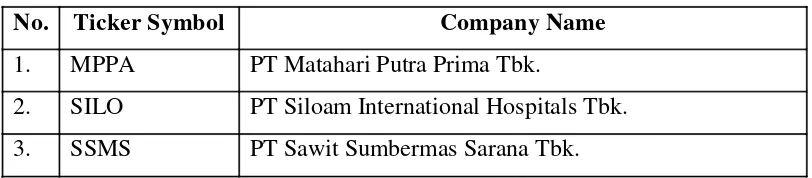
Table 1 Listed stocks in LQ45 Index at February 2015
No. Ticker Symbol Company Name
1. MPPA PT Matahari Putra Prima Tbk.
2. SILO PT Siloam International Hospitals Tbk.
3. SSMS PT Sawit Sumbermas Sarana Tbk.
Stocks that are listed in LQ45 at February 2015 and never be listed 243 working days prior and delisted 243 working days after are included in this research. The following table shows the stocks meeting those criteria
The variables that are going to be analyzed is the stock price. Therefore the prices of those stocks, both the listed ones and the delisted ones are compiled for 243 working days before the effective date of changes in LQ45 composition (beginning in February 1, 2015) and 243 working days after the effective date.
Table 2 Delisted stocks from LQ45 index in February 2015
To observe the differences before and after the composition change which the stocks are getting listed or delisted, the means of 3 stock prices each day is calculated. In this case, the price of MPPA, SILO and SSMS each day are averaged. Then price at the days before the effective date and the days at and after the effective date is separated to make a 2 set of temporal data with equal number of samples. Similarly with the delisted stocks, the price of BDMN, HRUM, and TAXI for each day are averaged, then separated into before-after set of data. This is needed to observe the significance caused by the listing and delisting phenomenon.
Descriptive Statistics
Descriptive statistics used to describe the basic features of the data. It is basically summarizing the samples used in the analysis. In this case, the descriptive statistics used is the univariate analysis. As the name suggests, the univariate analysis only describing the distribution of the data over a single variable, in contrast with multivariate analysis. The univariate analysis in this research consists of central tendency (mean, mode, median) and dispersion (range, variance, and standard deviation).
No. Ticker Symbol Company Name
1. BDMN PT Bank Danamon Indonesia Tbk.
2. HRUM PT Harum Energy Tbk.
Inferential Statistics
In this research, the aim is to determine whether the listing and delisting of the stocks is significantly affect the stock price, thus the method for analyzing the data is statistical method which best depicts the significance of the effect. The statistical method used are descriptive statistics and non-parametric inferential statistical method.
The inferential statistics to be used in the research is normality test and Wilcoxon signed-rank test. Normality test is the test conducted to decide whether the data is normally distributed or not. As most statistical tests is assuming that the data is normally distributed, the normality test is required for the first steps to determine the next required statistical tests. The normality test is grouped under non-parametric statistics because to test the normality the data is not required to meet the parametric statistics requirements.
In this case, the Shapiro-Wilk test is used to determine the normality of the data. The reason to choose Shapiro-Wilk other than the other normality test (e.g. Kolmogorov-Smirnov test) is because the sample size (n) is smaller than 2000 and among the other normality tests (i.e. Kolmogorov-Smirnov test, Lillefors test, Anderson-Darling test) the Shapiro-Wilk test is the most reliable normality test for all sample sizes (Razali, 2011). Based on that fact, the Shapiro-Wilk test should provide reliable results of data normality
Wilcoxon signed-rank test is used when there are two nominal variables and one measurement variable. This test is non-parametric test and is analogous to paired t-test and used if the distribution is not normally distributed (McDonald, 2014). The Wilcoxon signed-rank test will be used if the Shapiro-Wilk normality test conducted beforehand gives an output that denotes absence of normality in the sample.
DATA ANALYSIS
Listed Stocks
Table 3 Descriptive Statistics on LQ45 Listed Stocks
Sample Mean Median Range Variance Std Dev
Pre-listed 5765.594 6062.093 2711.627 572416.1 756.5819 Post-listed 5807.607 6132.293 3048.317 874898.5 935.3601
Table 3 shows descriptive analysis conducted on listed stocks shows that the mean is slightly higher on post-listed period, as well as median. Range of data also higher in post-listed period. A greater variance is shown at post-listed period which translates to a higher standard deviation, therefore the post-listed days have a higher volatility.
Table 4 Test of Normality in Prelisted Period of LQ45 Listed Stocks
Tests of Normality
Shapiro-Wilk
Statistic df Sig.
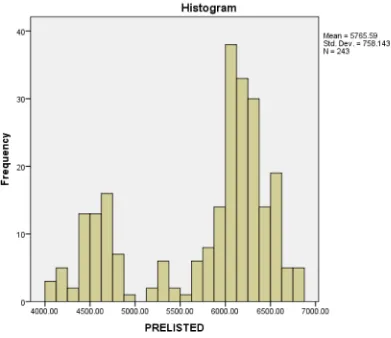
Figure 1 Histogram of Prelisted Period of LQ45 Listed Stock Prices
The test of normality table in Table 4 shows the p-value (shown as Sig. in the table) is 0.000 < 0.05, so it is not a normally distributed data. Moreover, the data have a highly skewed histogram shown in Figure 1, particularly to the right edge of the graph. The left side of the graph also skewed, although not as pronounced as in the right. So, it is confirmed that the data is not normally distributed.
Table 5 Test of Normality in Prelisted Period of LQ45 Listed Stocks
Tests of Normality
Shapiro-Wilk
Statistic df Sig.
Figure 2 Histogram of Postlisted Period of LQ45 Listed Stock Prices
The post delisted prices in Table 5 shows the 0.000 p-value in the Shapiro-Wilk normality test. Hence, the normality of distribution at 95% confidence level is considered not normally distributed, which requires 0.05 p-value to be classified as normally-distributed data. Similarly, the histogram of the data distribution depicted in Figure 2 shows that the data for this set is heavily skewed to the right and left, making the non-normal distribution is happening on the data set.
Table 6 Wilcoxon Signed-rank Test Ranking for Listed LQ45 Stocks
Ranks
N Mean Rank Sum of Ranks
POSTLISTED - PRELISTED
Negative Ranks 117a 125.64 14700.00
Positive Ranks 126b 118.62 14946.00
Ties 0c
Total 243
a. POSTLISTED < PRELISTED b. POSTLISTED > PRELISTED c. POSTLISTED = PRELISTED
negative ranks (W-) which means post-listed price is lower than the pre-listed price in 117 days. The other 126 days shows a positive ranks (W+) which is an improvement in price level as the post-listed price is higher than the pre-listed ones, in the same date of year.
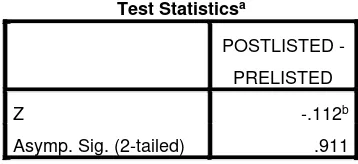
Table 7 Test Statistics for Listed LQ45 Stocks
Test Statisticsa
In the statistical test of Wilcoxon signed-rank test for the stock listing data, the z-value is -0.112, which in this method is based on the negative-ranked data. The p-z-value (shown in the table as Asymp. Sig (2-tailed)) is 0.911. With 95% confidence level, the test results that the null hypothesis is retained, which means that there is no difference in the median.
Delisted Stocks
Table 8 Descriptive Statistics on LQ45 Delisted Stocks
Sample Mean Median Range Variance Std Dev
Pre-delisted 2441.228 2445.67 612.3363 19132.31 138.3196 Post-delisted 1819.964 1991.986 1615.519 190849.2 436.8629
Descriptive statistics for delisted stocks are shown in Table 8. The mean is lower in post-delisted period, with the similar behavior observed in median. The range is much higher on post-delisted stocks with more than twice as much as the pre-delisted period. The variance is also much higher in the post-delisted period, which standard deviation follows the same behavior as well. The difference is more than three times berween pre- and post-delisted period.
Table 9 Test of Normality in Predelisted Period of LQ45 Delisted Stocks
Tests of Normality
Shapiro-Wilk
Statistic df Sig.
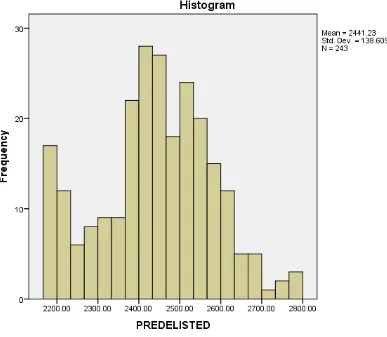
Figure 3 Histogram of Predelsted Period of LQ45 Delisted Stock Prices
The pre-delisted price shows a p-value of 0.001 as shown in Table 9, which is smaller than the requirement for normally distributed data at 0.05 on the 95% confidence level. The histogram in Figure 3 is skewed in the middle-left but goes high on the left edge of the histogram which makes the data is not normally-distributed.
Table 10 Histogram of Postdelisted Period of LQ45 Delisted Stock Prices
Tests of Normality
Shapiro-Wilk
Statistic df Sig.
Figure 4 Histogram of Postdelsted Period of LQ45 Delisted Stock Prices
The post delisted prices shows the 0.000 p-value in the Shapiro-Wilk normality test. Hence, the normality of distribution at 95% confidence level is considered not normally distributed, which requires 0.05 p-value to be classified as normally-distributed data. Similarly, the histogram of the data distribution shows that the data for this set is heavily skewed to the right and left, making the non-normal distribution is happening on the data set.
Table 11 Wilcoxon Signed-rank Test Ranking for Delisted LQ45 Stocks
Ranks
N Mean Rank Sum of Ranks
POSTDELISTED
-PREDELISTED
Negative Ranks 243a 122.00 29646.00
Positive Ranks 0b .00 .00
Ties 0c
Total 243
Table 11 shows that all post-delisted average price on the same date is smaller than the pre-delisted level, from 243 days in the sample. The mean rank for the negative rank (W-) is 122 while the sum of ranks is 29646. The positive rank (W+) days when the post-delisted price is higher than the pre-delisted days is zero, and that means zero mean rank and zero sum of ranks. No ties are observed in this data set.
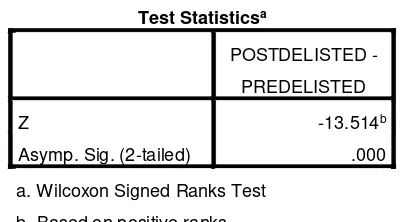
Table 12 Test Statistics for Delisted LQ45 Stocks
Test Statisticsa
The Wilcoxon signed-ranked test statistics result for the delisted stock prices data shows that the Z-value is -13.514. The p-value (Asymp. Sig. (2-tailed)) in this set of data is 0.000 which means that with 95% confidence level, the null hypothesis is rejected.
The findings from the average stock prices in the LQ45 stocks listed in February 2015 shows that over the one full year after the effective date of listing, the stock price is affected slightly by the phenomenon, but not quite significant. Supported by the statistical method, it is safe to assume that the listing in LQ45 does not have a significant effect over the stock price.
The findings shows that delisting of a stock from LQ45 index could exert pressure to the price. On the whole year after the stocks went out of the index, on the same date in the year which usually triggers similar price behavior due to the annual cycle, none of them are going to exceed the pre-delisted prices. Therefore, it can be assumed that the delisting phenomenon from LQ45 index is significantly affect the stock prices over the course of a year price.
CONCLUSION
Listing of a stock in LQ45 index does have some slight difference to the price. However, the magnitude of change in price does not prove that listing in LQ45 could significantly affect the prices of a stock over the course of one-year price movement. On the other hand, removal of listing in LQ45 index does have a massive impact to the stock price over the course of a year price. The price decline is significant with no price above the pre-delisting days on a specific date.
of time, so LQ45 listing in terms of stock price does not have power to significantly stable the prices more than before listing.
This research is also only based on price movement. Future research could include other variables in the stock trading based on investors perspective such as return- volume of trading, or volatility. Also, the field of research is not only limited in LQ45 index. Upcoming research can observe the similar variable over the different index e.g. SRI-KEHATI Index, sectoral indices, or Jakarta Islamic Index.
REFERENCES
Bechmann, K. L., 2004. Price and Volume Effects Associated with Changes in the Danish Blue-Chip Index: The KFX Index.Multinational Finance Journal; Mar-Jun 2004; 8, 1/2; ABI/INFORM Collection p. 3
Bodie, Z., Kane, A., Marcus, A. J., 2014.Investments.10thed. McGraw-Hill Education.
Elliott, W. B., Warr, R. S., 2003.Price pressure on the NYSE and Nasdaq: Evidence from S&P 500 index changes.Financial Management32.3 p. 85-99
McDonald, J.H. 2014.Handbook of Biological Statistics. 3rd ed. Sparky House Publishing, Baltimore, Maryland.
Rashiqa Kamal, Lawrence, E. R., McCabe, G., Prakash, A. J., 2012.Additions to S&P 500 Index: not so informative any more.Managerial Finance38.4 p. 380-402.
Ross, S., Westerfield,. R.W., Jaffe, J., 2012. Corporate finance. 10th ed. McGraw-Hill
Education