Original scientific paper UDC 551.555.4
Mesoscale airflow structure over the northern Croatian
coast during MAP IOP 15 – a major bora event
Zvjezdana Benceti} Klai}a, Danijel Belu{i}a, Vanda Grubi{i}b,
Lada Gabelaaand Ladislav ]osoa
aAndrija Mohorovi~i} Geophysical Institute, Faculty of Science, University of Zagreb, Zagreb, Croatia
bDivision of Atmospheric Sciences, Desert Research Institute, Reno, NV, USA Received 4 December 2002, in final form 2 December 2003
We have investigated a strong Bora event over the Northern Adriatic, which occurred on 7 November 1999 during MAP IOP 15. The wind field, po-tential temperature, vertical component of relative vorticity, and turbulent kinetic energy in the lower troposphere were simulated by a nonhydrostatic mesoscale model (MEMO), which was run at a very fine horizontal resolu-tion with the grid spacing of 1 km. Our model simularesolu-tion accurately repro-duced the timing of the Bora event, and the modeled fields exhibited a good agreement with routinely measured winds along the Croatian coast as well as a large degree of consistence with the MAP measurements offshore. The model results also provided a detailed view of the hydraulic airflow struc-ture and thermodynamic conditions during the Bora event. Our simulation results confirm the existence of topographically induced vorticity filaments originating in the turbulent regions near the coastal mountains, where these turbulent zones are collocated with the hydraulic jump-like flow features. All of the above processes have the highest intensity in the region of Senj. Keywords:Bora, hydraulic flow, northern Adriatic
1. Introduction
The Mesoscale Alpine Programme (MAP) is an international research program aimed at improving both the theoretical knowledge and numerical prediction of weather and climate over complex topography. An extensive field experiment, the Special Observation Period (SOP) of MAP, took place in the Alpine region, including the Northern Adriatic, from 7 September to 15 November 1999. The primary scientific objectives of this particular MAP phase were focused on orographically influenced precipitation events (includ-ing frontal precipitation and deep convection) and consequent flood(includ-ing epi-sodes, Foehn-related phenomena, three-dimensional gravity wave breaking and associated wave drag, high altitude potential vorticity (PV) anomalies
(PV streamers) and low-altitude orographically-generated PV anomalies (PV banners). During one of the MAP Intensive Observation Periods (IOP), na-mely MAP IOP 15, a strong Bora event occurred over the Northern Adriatic, and was documented as part of the MAP PV banner project on November 7, 1999. This is the case on which we focus in this study.
Among others, the Bora wind at the Adriatic coast was investigated by Makjani} (1970, 1976, 1978), who focused on the climatology and diurnal variation of the wind speed. The climatological analysis was also performed by Orli} et al. (1994) and Heimann (2001). Orli} et al. studied the Bora--driven currents and sea-level changes in the Adriatic. For this purpose they calculated the Bora wind stress along the Croatian coast based on 10-year data. They obtained four peaks, which were associated with topography, and whose positions roughly correspond to Pula, Senj, Split and Makarska, re-spectively, with the value of stress at Senj being the largest. Based on the cli-matological synoptic scale data over Europe, Heimann suggested four typical mean geopotential height patterns associated with the Bora events.
Jur~ec (1981) was the first to emphasize the importance of interaction of processes on various scales of motion for the Bora characteristics. She showed how large-scale anomalies may change mesoscale characteristics of the Bora environment, leading to a relatively warm Bora. Vu~eti} (1984) pointed out the existence of large wind shear in the upstream region during the Bora event, and the neutral stability of the Bora layer. When the Bora is very strong, the Bora layer is covered on top with a stable layer. Kora~in (1984) in-vestigated parameters, such as the Brunt-Väisälä frequency and Froude number, and, showed that with a well-developed Bora layer, differences be-tween flow parameters on the windward and leeward side become smaller compared to the same at the beginning and the end of the Bora event.
Smith (1987) related the dynamics of Bora to the hydraulic theory. The same approach was followed by Grubi{i} (1989) and Baji} (1991) for Bora cases on the Northern Adriatic characterized with the strong upstream flow. Smith also pointed out Bora’s similarity to the Boulder windstorm. He em-phasized several common features of the Bora events: i) an upstream descent and acceleration beginning where the mountains rise; ii) an approximate co-incidence between the depth of the uppermost descending streamline and a wind reversal level (when such a reversal exists); iii) a decoupling of the flow aloft associated with a splitting of the inversion and the formation of a thick mixed layer downstream; iv) a narrow region of intense turbulence, and v) an ascending jet just downstream of the plunging Bora. Similarly, Qian and Giraud (2000), based on the simulation of one case of a typical Bora with a stationary cyclone over the southern Adriatic Sea, point out prevalent Bora features, as the upstream acceleration, the strong descent within the Bora layer and the turbulent zone just downstream of the mountains.
Ivan~an-Picek and Tuti{ (1996) identified Bora cases in which hydraulic theory could not be applied, addressing a generally less investigated Bora on
the Southern Adriatic. Their results confirmed the multiscale nature of the Bora-related airflow. Furthermore, they unravel an essential role of the downstream effects on the Bora genesis due to the isallobaric component of the ageostrophic motion. Therefore, they conclude that the Southern Adriatic Bora mechanism could not be explained by the 2-D hydraulic theory with simple upstream conditions, as it is mainly the case for the Bora on the Northern Adriatic.
A number of investigators have performed numerical experiments in or-der to investigate impacts of different conditions on the Bora development. Petkov{ek (1990) suggested two main factors affecting the wind speed. One is the stability of the 'environmental' warm air found above the cold Bora air, and the other, more important, is the temperature difference between the two air masses. The same author performed additional numerical experi-ments with the frontal Bora model (Petkov{ek, 1991), in which the upper boundary of the Bora is treated as a dynamically balanced frontal surface. His results indicate the following: 1) a higher ridge and greater inclination of the slope cause a higher Bora speed; 2) absolute temperature (i.e.season) has only a small influence on the Bora speed; and 3) the shape of the lee side slope affects the Bora only moderately.
Enger and Grisogono (1998) studied the effects of difference between the sea-surface and land temperature (mesoscale forcing) as well as the geostro-phic wind direction (synoptic forcing) on the idealized Bora cases. They con-cluded that an offshore propagating hydraulic jump, associated with the Bora front, is induced by a lee-side low pressure, where the latter is due ei-ther to the mesoscale or synoptic forcing. Thus, both the synoptic situation and the state of marine atmospheric boundary layer are crucial for the Bora development. Lazi} and To{i} (1998) employed different heights and shapes of the mountains in their Bora simulations. The Bora developed only in the presence of the control mountains in the region, which have the average height of about 1000 m. For decreased mountains heights, a corresponding decrease of air accumulation in front of the mountain barrier occurred. When the heights were increased, the blocking effect of the mountains deformed the Bora flow.
The objectives of this study are:
1. To validate performance of the mesoscale nonhydrostatic model MEMO (Moussiopoulos, 1994, 1995; Kunz and Moussiopoulos, 1995) over the Northern Adriatic for the case of a strong Bora event,
2. To investigate the mesoscale thermodynamic and airflow conditions, namely wind field, potential temperature (q), vertical component of relative vor-ticity (x= ¶n
¶ ¶ 
x - y
u) and turbulent kinetic energy (TKE) fields, within the
lower troposphere during this particular Bora event using the model so-lutions and the MAP IOP data, and
3. To examine in more detail atmospheric conditions in the region of Senj since frequent and severe Bora events occur there often (Makjani}, 1976, 1978; Baji}, 1987).
An in depth analysis of the MAP IOP 15 Bora case is presented in Grubi{i} (2004), where the dynamics and structure of the lee-side and cross--mountain flow past the coastal mountains were investigated using the air-craft and otherin situand remotely sensed data from the MAP IOP mission over the Adriatic together with the high-resolution mesoscale simulations with the Naval Research Laboratory (NRL) Coupled Ocean-Atmosphere Mo-deling System (COAMPS), carried out at the horizontal resolution of 3 km. That study focused on the structure and origin of the orographically-gener-ated PV banners over the Adriatic, which were shown to be accurately simu-lated by the COAMPS model at that horizontal resolution, and to originate in dissipative regions in the proximity of the coastal terrain. The same MAP IOP 15 Bora episode was studied also by Tudor and Ivatek-[ahdan (2002), who focused solely on the ability of the ALADIN model to forecast severe Bora winds. In this study we employ a finer model horizontal resolution (1 km) than previously used in the studies of this Bora case. The model results at this high resolution enabled us to gain a very detailed insight into the structure of the Bora flow and the associated conditions in the lower tropo-sphere.
2. Synoptic Conditions
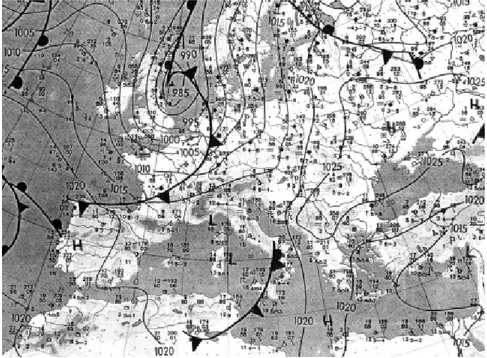
The analysis of synoptic conditions during this Bora event presented here is based on the surface and upper-level diagnostic charts over Europe. These synoptic products were available at every six (00, 06, 12 and 18 UTC), and twelve hours, respectively. Here, both the surface (Figure 1) and the up-per-level charts (Figure 2) are shown for 00 and 12 UTC times only. By 06 UTC on 6 November 1999, a deep surface cyclone had moved eastward over the North Sea. A cold front, extending from Denmark to southern France, was moving toward the Alps. Upper-level charts show a cutoff from a south-ward oriented trough, which at 12 UTC was found over the North Sea. Asso-ciated strong northwesterly cold-air advection toward the Mediterranean led to the lee cyclogenesis over the Gulf of Genoa south of the Alps.
Subsequent to 18 UTC on 6 November the center of the surface Genoa cy-clone was found over the central Italy and the Tyrrhenian Sea. Simulta-neously, two high-pressure centers were present over the European conti-nent. One was centered over the northwestern France and the eastern Atlantic, reaching to Germany and the Czech Republic and establishing a relatively high, north-south synoptic pressure gradient. This anticyclone to-gether with the Genoa cyclone favored the development of the Bora wind over
6 November 1999, 00 UTC
6 November 1999, 12 UTC
7 November 1999, 00 UTC
7 November 1999, 12 UTC Figure 1.cont.
the Northern Adriatic, which started in late hours of 6 November. The other anticyclone was positioned over the northwestern Russia.
6 November 1999, 12 UTC, 850 hPa 7 November 1999, 12 UTC, 850 hPa
6 November 1999, 12 UTC, 700 hPa 7 November 1999, 12 UTC, 700 hPa
6 November 1999, 12 UTC, 500 hPa 7 November 1999, 12 UTC, 500 hPa Figure 2.Upper level 850, 700 and 500 hPa diagnostic charts over Europe (top, center and bot-tom, respectively), for 6 and 7 November 1999 at 12 UTC.
During 7 November (see Figures 1 and 2), the center of the surface Genoa cyclone moved slowly towards the southeast, and was accompanied with the upper-level cyclonic vortex. At the same time, the anticyclone over western Europe became elongated extending towards the east. Consequently, the southward pressure gradient increased and the Bora over the Northern Adri-atic continued to strengthen. The above synoptic situation, which is charac-terized with a cut-off low over the Adriatic, is very similar to one of the four typical synoptic patterns associated with the Bora wind at the Croatian coast in winter months (Heimann, 2001).
3. Observational Data
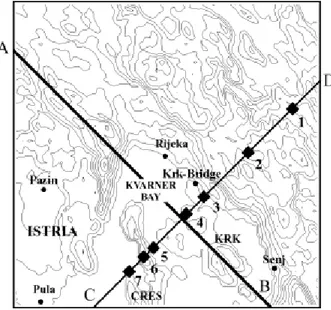
During this Bora event, standard surface wind measurements were avail-able at four coastal sites (Pazin, Pula, Rijeka, and Senj). Additionally, the wind speed data only were available at the Krk Bridge location. The posi-tions of these measuring sites are shown in Figure 3. In addition to the rou-tine surface data, in this study we have used the aircraft data from the MAP IOP 15 for 7 November 1999. The MAP IOP 15 data used here were obtained by the National Center for Atmospheric Research (NCAR) aircraft Electra (Grubi{i}, 2004) between 14:30 UTC and 15:42 UTC flying along tracks par-allel to the Croatian coast at approximately 300 m and 600 m ASL.
Figure 3.The 100´100 km2grid domain. Topography contours are shown every 150 m. The do-main center is over Rijeka (45.33°N, 14.45°E, 120 m ASL). The solid circles indicated positions of the available routine measuring sites. Line AB is parallel Electra track, and it is the base of the vertical cross-section shown in Fig. 8. Line CD, parallel to the direction of the Bora flow, is the base of the vertical cross-sections displayed in Figs. 14–16. Points 1–7 along the line CD are discussed in section 4.3.
4. Numerical Simulation
We employed an Eulerian nonhydrostatic prognostic mesoscale model for an unsaturated atmospheric boundary layer (MEMO, version 6.0). Model de-scription and its performance have been documented previously (Moussio-poulos, 1994, 1995; Kunz and Moussio(Moussio-poulos, 1995; Moussiopoulos et al., 1997a, 1997b; Klai} et al., 2002, Klai} and Nitis, 2001–2002, Klai} et al., 2003). The model vertical coordinate is terrain following. Boundary condi-tions for the wind velocity components, potential temperature and pressure are specified as in Moussiopoulos (1994). At open boundaries, wave reflection and deformation is minimized by the use of modified 'radiation conditions' (Carpenter, 1982). For the nonhydrostatic part of the mesoscale pressure perturbation, homogenous Neumann boundary conditions are used at the lateral boundaries, where the wind velocity component perpendicular to the boundary remains unaffected by the pressure change. At the upper bound-ary, Neumann boundary conditions are imposed for the horizontal velocity components and the potential temperature, whereas the radiative condition is applied for the hydrostatic part of the mesoscale pressure perturbation. For the nonhydrostatic part of the mesoscale pressure perturbation, a ho-mogenous staggered Dirichlet conditions and the 'no-flow-through' conditions are imposed for the upper and lower boundary, respectively. All other condi-tions at the lower boundary follow from the Monin-Obuhkov similarity the-ory.
The simulation was performed for the period from 5 to 7 November 1999, in which the first day was taken for the pre-run purposes. The model was driven with the Zagreb-Maksimir (45.82 °N, 16.03 °E, 128 m ASL) radio-sonde data, which were available at 00 and 12 UTC on November 5, at 12 and 15 UTC on November 6, and at 00, 12, 15 and 24 UTC on November 7. This simulation was performed at the horizontal resolution of 1 km and the time increment of 5 seconds. The center of the 100´100 km2domain (Fig. 3) was placed over the Rijeka measuring site (45.33 °N, 14.45 °E, 120 ASL), which is about 130 km southwest of Zagreb. The model top was set at 6000 m above the surface. In the vertical, 25 layers were selected with a finer resolu-tion at lower altitudes. Layer depths gradually increased from 20 m at the bottom to about 900 m at the top of the modeling domain.
Seven landuse types were assumed. Corresponding short-wave albedos, evaporation parameters, volumetric heat capacities, thermal soil conductivi-ties and roughness lengths for all landuse types except the forest and urban were taken as in the study of Klai} et al. (2002). Employed roughness lengths for the forested and urban surfaces were 0.4 m and 0.9 m, respectively.
5. Results and Discussion
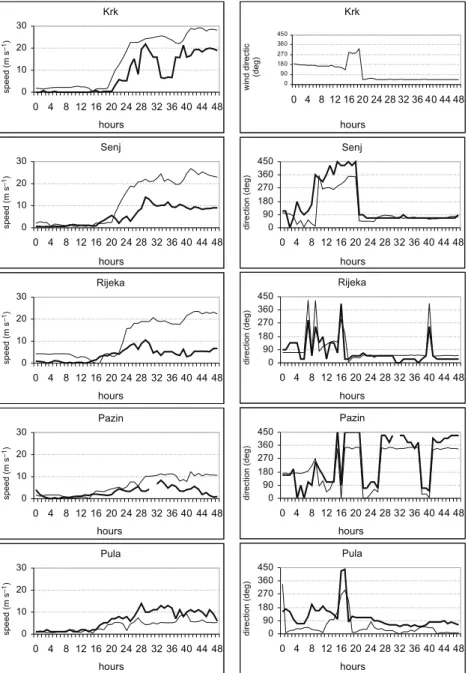
Figure 4 illustrates the modeled versus measured surface winds for the available measuring sites, which are indicated in Figure 3. Except for the Pula airport and the Krk Bridge site, the measured values correspond to the hourly means, whereas the modeled values are the instantaneous values at a particular round hour. For Pula, the measured values are given by the mean, determined from the 10-minute measurement intervals starting 10 minutes prior to the round hour.
It is apparent that the wind speeds are satisfactorily predicted for all five sites for times prior to the onset of Bora, which started in the evening hours of November 6. However, during the Bora, the modeled speeds for Senj and Rijeka are substantially higher than measured (sometimes by more than 15 m s–1), with somewhat lower model overestimation for the Krk Bridge and Pazin. On the other hand, predicted wind speeds for Pula are lower than those measured.
To some extent the model overestimation at four out of five selected sites could be attributed to the smoothed topography employed in our simulations. However, this particular Bora event is considered to be one of the strongest Boras on record in recent decades (Grubi{i}, 2000). For such a strong Bora the expectation is that the real wind speeds in Senj, which is located below the Vratnik Pass and thus exposed to frequent and severe Bora events due to the channeling effects of the pass, were higher than those shown in the hourly averages in Figure 4. Our expectations were confirmed in the discus-sion with the staff of the Meteorological and Hydrological Service of Croatia (Vu~eti}, 2002), who indicated that both Senj and Rijeka measured maximal values are questionable due to the lee side positions of the two measuring sites.
Unlike wind speeds, wind directions are well predicted at all available measuring sites. The agreement is particularly good during the Bora dura-tion for Senj, Rijeka and Pula. For Pazin discrepancies are slightly higher but they do not exceed 90°. Consequently, the timing of the Bora event is also well predicted.
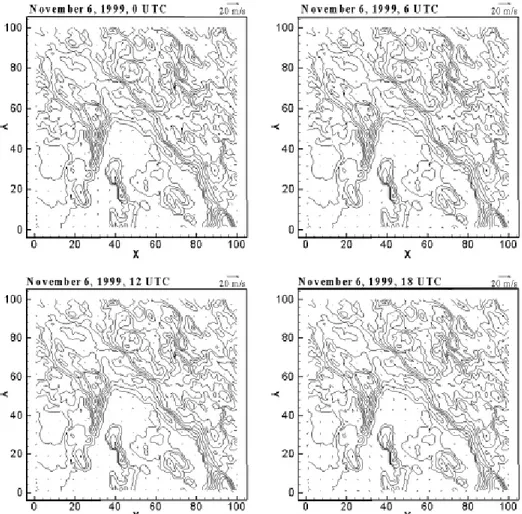
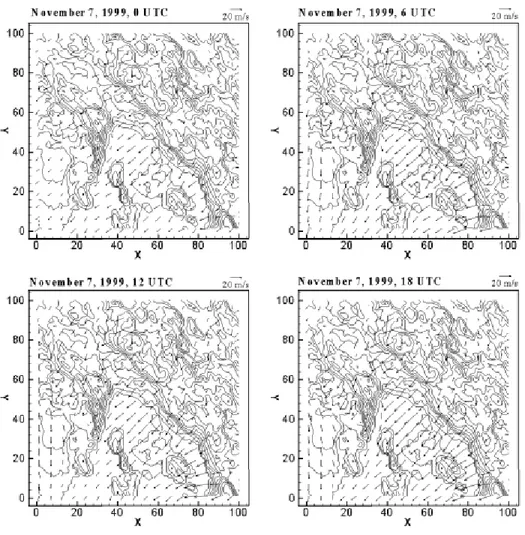
Figure 5 shows modeled surface winds for 6 and 7 November. Through-out November 6 winds were weak, and until 18 UTC they were predomi-nantly southerly, which is in agreement with the synoptic situation (Figs. 1 and 2). At 18 UTC a pronounced northerly flow developed, though the wind speeds were still weak. As seen from the surface synoptic chart (not shown here), the Genoa cyclone, which supports such airflow, has by then become well established and centered over the central Italy and the Tyrrhenian Sea. The ridge of the western anticyclone, which is the second factor contributing to the north-south synoptic pressure gradient has also by then stretched to-ward the east, being located to the north of the Genoa cyclone. Starting at 00 UTC on November 7 the northeasterly wind is strongest over the Kvarner
Krk 0 10 20 30 0 4 8 12 16 20 24 28 32 36 40 44 48 hours Senj 0 10 20 30 0 4 8 12 16 20 24 28 32 36 40 44 48 Rijeka 0 10 20 30 0 4 8 12 16 20 24 28 32 36 40 44 48 Pazin 0 10 20 30 0 4 8 12 16 20 24 28 32 36 40 44 48 Pula 0 10 20 30 0 4 8 12 16 20 24 28 32 36 40 44 48 spe ed (m s ) –1 spe ed (m s ) –1 spe ed (m s ) –1 spe ed (m s ) –1 spe ed (m s ) –1 hours hours hours hours Krk 0 90 180 270 360 450 0 4 8 12 16 20 24 28 32 36 40 44 48 Senj 0 90 180 270 360 450 0 4 8 12 16 20 24 28 32 36 40 44 48 Rijeka 0 90 180 270 360 450 0 4 8 12 16 20 24 28 32 36 40 44 48 Pazin 0 90 180 270 360 450 0 4 8 12 16 20 24 28 32 36 40 44 48 Pula 0 90 180 270 360 450 0 4 8 12 16 20 24 28 32 36 40 44 48 wi nd di re ct ic (deg) dire cti on (d eg) dire cti on (d eg) dire cti on (d eg) dire cti on (d eg) hours hours hours hours hours
Figure 4. Modeled (thin line) versus measured (heavy line) surface winds (10 m above the ground) for 6 and 7 November 1999. Positions of the measuring sites are indicated in Figure 3. Note that some of the wind directions in the range from 0 to 90 degrees were shifted by 360 de-grees in order to facilitate an easier visual comparison of the measured with the model-predicted values. This was done only in cases in which an otherwise small difference in the observed and modeled wind directions (e.g.10 degrees and 340 degrees) would produce an unrealistically large error due to the circular nature of the wind rose.
Bay. Throughout November 7, the wind speeds have increased and at 18 UTC the strongest winds over the Kvarner Bay exceeded 20 m s–1. This is in agreement with findings of Makjani} (1970, 1976), who showed that, during the Bora, winds speeds are higher farther from the coastal barrier than on the coast itself. Furthermore, it reflects the fact that the airflow accelerates when it transitions from a rougher to a smoother surface (i.e.from the land to the sea).
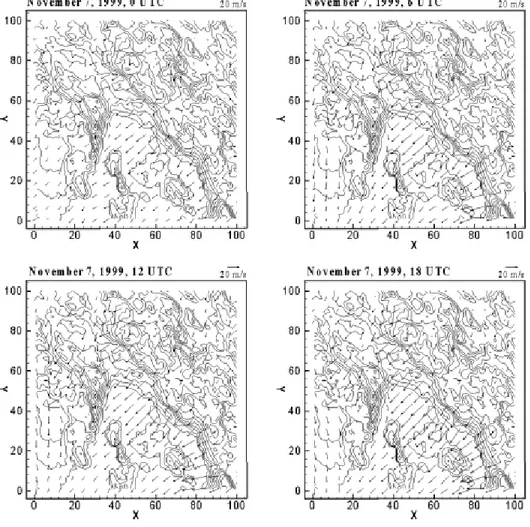
Figure 6 shows the modeled wind fields for 6 and 7 November at 12 UTC at 1606, 3129 and 5104 m ASL. These heights were selected from the avail-able model output levels as the closest to the typical heights of the 850, 700
Figure 5.Modeled surface winds. Reference vector of magnitude of 20 m s–1is indicated in the upper right corner. Wind vectors are shown at resolution of 6 km. Topography contours are given for every 200 m.
and 500 hPa isobaric surfaces. One may see that the modeled winds agree well with the corresponding upper-level diagnostic winds shown in Figure 2. The good agreement of both the wind direction and speed magnitudes at these upper-level surfaces further confirms our doubts about the accuracy of the measured surface winds at Rijeka and Senj shown in Figure 4.
5.1 Comparison with MAP measurements
On 7 November 1999 the NCAR Electra flight above the Adriatic, along the Croatian coast, was performed along tracks, which are parallel to and lo-cated 56.2 km southwestward (downwind) from the line AB. The Electra
tracks, which lie entirely over the sea surface, come in close proximity of the southwestern corner of our domain (Figure 3). Although the aircraft tracks lie outside the domain of this study, the expectation is that, aside from the modifications induced by the Kvarner Bay islands (Krk and Cres) and the Istria Peninsula topography, the main features of this strong Bora would be comparable along the aircraft track and the line AB, especially along that portion of the line AB that lies over the sea. The first analyzed flight seg-ment, which took place from 14:30 UTC to 15:01 UTC (where LST = UTC + 1), was flown at approximately 600 m ASL from the southeast to the north-west (i.e.parallel to the line BA). The second flight segment was flown in the opposite direction (i.e. parallel to the line AB) at about 300 m ASL, and, it lasted from 15:04 to 15:42 UTC. Consequently, we have investigated modeled
Figure 6.Modeled winds for 6 (left) and 7 (right) November 12 UTC at 1606, 3129 and 5104 m above the surface (top, center and bottom, respectively). Reference vector of magnitude of 20 m s–1is indicated in the upper right corner. Wind vectors are shown at resolution of 6 km. Topogra-phy contours are given for every 200 m.
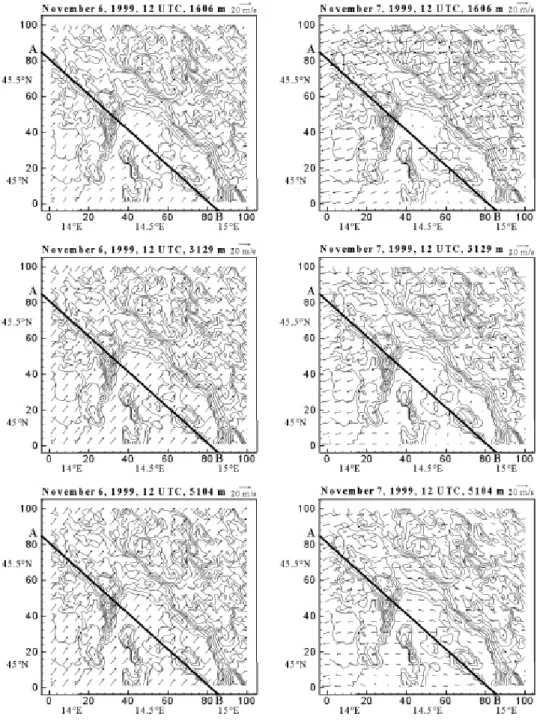
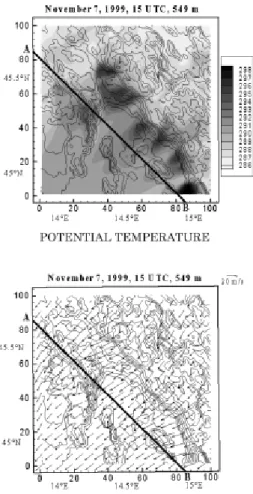
q, TKE, horizontal wind, and z fields at the model levels closest to the air-craft flight levels at 15 UTC (Figure 7). Note that the airair-craft flight altitudes correspond to heights above the sea surface, whereas the model altitudes cor-respond to the heights above the terrain. For this analysis, we have selected the 297-m and 549-m model surfaces as the most suitable. Above the sea these terrain-following surfaces are at approximately the same heights as the Electra tracks, whereas over land, as revealed by track-perpendicular cross-sections (not shown here), these terrain-following surfaces are closely paralleled by isentropic surfaces.
As this MAP research flight was part of the Potential Vorticity (PV) ban-ner project, whose aim was to investigate a complex horizontal structure of the wake generated by a major mountain range, we first take a look at the model predicted vertical vorticity (z) illustrated in Figure 7. Due to relatively small horizontal potential temperature gradients at the selected model sur-faces away from the topography, the vertical vorticity is a good approxima-tion for the PV there. As seen in Fig. 7, the model-predicted vorticity shows downstream-elongated filaments (banners) of vertical vorticity, which oc-curred in pairs of positive and negative vorticity downstream of the promi-nent topographic features, in good agreement with the MAP results (Gru-bi{i}, 2004). The absolute values of the model-predicted vertical vorticity (z) within the banners are on the order of 10–3s–1, and are slightly larger at the higher selected model surface. Furthermore, two regions in which vertical vorticity reaches 10–2s–1are found at both surfaces. One of these regions is within the filaments in the upper left corner of the domain, which are related to the flow around the southeastern edge of the Alps located in Slovenia. The other is located in the lower right corner, in the region of Senj, where a strong pair of vorticity banners forms. The horizontal dimensions of individ-ual (positive or negative) filaments are a few tens of kilometers in the down-stream direction, and a few kilometers in the direction perpendicular to the Bora flow. These model-generated vorticity banners are somewhat narrower than those documented in Grubi{i} (2004), where the characteristic width of the banners was 10–25 km. This difference in width of the vorticity banners is likely due to different horizontal resolutions at which the two models were run, and the known tendency for the numerically simulated PV banners to obtain finer spatial structure at higher model resolutions (Schär et al., 2003). As further seen in Fig. 7, the origin of the pairs of vorticity (z)filaments coincide with the downwind-elongated areas of increased potential tempera-ture and turbulent kinetic energy. Regions with the highest q values are found downstream of the steepest mountain slopes, which is the consequence of (quasi-)adiabatic parcel heating in the strong katabatic flow. However, the increased TKE, together with the z anomalies, suggest that a topographi-cally-induced irreversible transformation of approximately balanced synop-tic-scale airflow to an unbalanced smaller-scale flow occurs in these zones.
The increased values ofTKE are generally higher at the 549-m surface. On both the investigated surfaces there are three regions with particularly highTKEvalues. One of these regions is located to the west of Rijeka (x»44 km,y»52 km) at the northernmost tip of the Kvarner Bay, where at 15 UTC the maximumTKEof 47 and 22 m2s–2was predicted at 549 and 297 m above the terrain, respectively. The second region of increased TKEis found about 15 km southward of Senj (x »85,y» 2 km), where corresponding maximum TKEvalues are 43 and 33 m2s–2. The third region is located atx»58 andy»
(a)
Figure 7.Modeled potential temperature (K), turbulent kinetic energy (m2s–2), horizontal wind field (m s–1) and relative vorticity (s–1) at 15 UTC at 297 and 549 m above the surface ((a) and (b), respectively).
38 km with TKEvalues of 37 and 17 m2s–2. SimilarTKEfields at both sur-faces are also obtained for 14 UTC (not shown here).
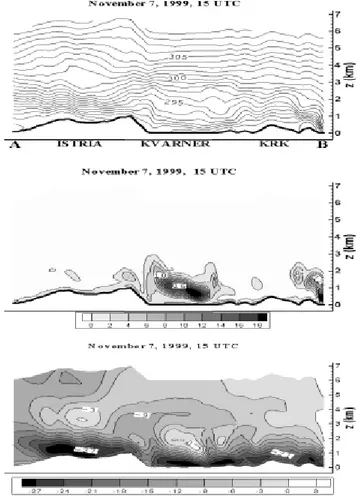
Figure 8 shows the NW-SE vertical cross-section of the modeledq,TKE, and the horizontal wind speed component perpendicular to the cross-section plane for 7 November 1999 at 15 UTC. The base of the cross-sections is line AB (i.e.it is about 56 km apart from the Electra track). Within the first»1.2 km above the ground over the Istria peninsula, isentropes are very densely spaced, with ¶q/¶z»9.2°C km–1, indicating strong static stability. Over the Island of Krk a less stable (¶q /¶z » 5.0 °C km–1) but equally deep layer is found. Over the Kvarner Bay, the stable layer (¶q /¶z» 8.0 °C km–1) is ele-vated, and extends from about 200 m up to about 700 m above the see. A
par-(b) Figure 7. cont.
ticularly strong stable layer (¶q/¶z» 12.0 °C km–1), extending from the sea surface up to about 500 m ASL, is found above the point B, which is located about 15 km south of Senj.
Two shallow turbulent regions with TKE > 18 m2s–2 are found in this vertical cross-section at 15 UTC (Fig. 8). The one above the Kvarner Bay starts at about 400 m ASL, and is approximately 6 km wide and 500–600 m deep. The other, south of Senj is of the same depth but located closer to the sea surface. Since this region is located at the very edge of the domain, its horizontal extent could not be determined. The relative contribution of shear--generated vs. buoyancyshear--generated turbulence, where the latter is due to the
Figure 8.NW-SE vertical cross-section whose base is indicated with the line AB in Figure 3. Modelled values of potential temperature (K, top), turbulent kinetic energy (m2s–2, center) and horizontal wind speed component perpendicular to the cross-section (m s–1, bottom) for 7 Novem-ber 1999 15 UTC. Positive and negative wind speeds correspond to southwestern and northeast-ern flows, respectively.zis height above the sea level.
cold Bora wind flow over the warmer sea, remains yet to be determined. However, the strong static stability in these turbulent regions implies the importance of the shear generation mechanism.
The isotach cross-section, in which the wind component perpendicular to the cross-section plane (i.e.the along-Bora component) is shown, reveals that within the first few hundred meters above the surface the modeled wind speeds over the Istria Peninsula, the Kvarner Bay, and over the point B ex-ceed 24 m s–1. Above these wind speed maxima, within the first 1200–1600 m above the surface, a very strong wind shear is predicted, with values of –1.8 m s–1/100 m, –1.5 m s–1/100 m and –1.0 m s–1/100 m corresponding to the Kvarner Bay, point B and Istria, respectively. The strong wind shear layer is deepest over the Istria, and the shallowest over the Kvarner bay. Further aloft, areas of weak northeasterly winds (£3 m s–1), or even very weak south-westerly winds are found at altitudes between 2–3.5 km above the ground (over Istria) and 1.6–2.8 km above the sea (Kvarner Bay). In these 'calm' re-gions the vertical gradients of potential temperature are very small, with values of¶q/¶zfrom 0.8 to 1.0°C km–1.
The predicted multiple-maxima near-surface wind structure bears some resemblance to the Electra measurements for 7 November 1999 (Grubi{i}, 2004), which show a strong, cold, northeasterly jet over the Northern Adri-atic, centered at 44.75°N, together with two more regions of increased wind speed at the northern and the southern end of the Electra track. At the height of 600 m ASL within a jet, a maximal measured wind speed perpen-dicular to the aircraft track (i.e.approximately perpendicular to the northern part of the Croatian coast) was close to 30 m s–1.
Figures 9 and 10 show MAP measured vs. modeled winds, potential tem-perature, and the vertical component of relative vorticity derived from the measured and simulated winds. The vertical vorticity was computed from the Electra measurements following Grubi{i} (2001, 2004). In order to facilitate a direct comparison with the Electra data, the line AB and the data along it were translated in the downwind direction, parallel to the Bora flow, and projected onto the Electra flight track. The resulting uniform shift in the lati-tudes along the line AB is 0.36 degrees.
Since the model values, shown in Figs. 9 and 10 for 14 and 15 UTC, are taken along the 297-m and 549-m terrain-following surfaces along the line AB, the best agreement with the Electra measurement should be expected along the portion of the line AB that lies over the sea. This is indeed true for the horizontal and vertical wind speed components. On the other hand, the modeled wind direction agrees very well for the both heights along the entire line AB. Potential temperature discrepancy between the MAP measurements and modeled values, which is rather noticeable even above the sea, could be attributed to two factors: the MEMO model simplifications, and the distance between the Electra track and the line AB. Considering the first factor, one should note that the temporal variation of the sea surface temperature is
ne-Figure 9.A comparison between the MAP measurement at»300 m above the sea level and the modeled values 297 m above the surface across the line AB (see Fig. 3) at 14 and 15 UTC. Abs-cissaFshows the latitude along the MAP flight track. This flight segment was flown from the higher to the lower latitude. In the lowermost panel, shown is the terrain height along the line AB.
Figure 10.A comparison between the MAP measurement at»600 m above the sea level and the modeled values 549 m above the surface across the line BA (see Fig. 3) at 14 and 15 UTC. Ab-scissaFshows the latitude along the MAP flight track. This flight segment was flown from the lower to the higher latitude. In the lowermost panel, shown is the terrain height along the line AB.
glected in the MEMO model, while the temporal variation is taken into ac-count for the ground surface temperature. Therefore, the modeled potential temperature, which is calculated from the surface heat balance equation, ap-pears to agree better with the MAP measurements over the ground at low el-evations than to measurements over the sea. The second factor, the distance between the Electra track and the line AB might be contributing even more to this discrepancy, with the line AB being much closer to the topography and the zones of strong katabatic heating.
5.2 Temporal development of flow in the Senj region
In this section we examine in more detail the model results for the Senj region. Figures 11, 12 and 13 show the west-east vertical cross-sections through Senj for wind, potential temperature and turbulent kinetic energy fields for 6–7 November 1999. These west-east oriented vertical cross-sec-tions are the along-Bora seccross-sec-tions since the wind direction in Senj and its sur-rounding during this Bora event is easterly. As illustrated in Figure 11, until 6 November at 23 UTC winds were weak and westerly. The wind speed ex-hibited the expected increase with height due to the attenuation of frictional effects. After 23 UTC on November 6, the zonal flow reversed to the easterly. Simultaneously, the wind speed at lower levels (i.e.within the Bora layer, de-fined here as the layer with strong winds³10 m s–1and the easterly Bora di-rection, characteristic of Senj) became stronger than the winds aloft, and, due to the severe downslope nature of the flow, continued to increase with time. At the beginning of the Bora period (23 UTC on November 6), the hori-zontal and vertical wind components within the Bora layer in the Senj region were close to 20 m s–1and –2 m s–1, respectively. At the end of simulated pe-riod (22 UTC on November 7), corresponding numbers were about 30 m s–1 and –4 m s–1. The Bora wind was strongest within approximately first 2 km above the surface. The depth of the Bora layer in these cross-sections is larger upwind of the mountain crest (~2 km) compared to the mountain slope and the zone over the sea in between the Senj and the Island of Krk (~1 km). The latter is in good agreement with the depth of the Bora layer determined from the MAP Electra lidar measurements (Grubi{i}, 2004).
The modeled Bora event produced a hydraulic-jump-like feature over the coastal mountain slopes, which is clearly evident in the potential tempera-ture cross-sections (Figure 12) at the height of 1.5 to 2 km. At the down-stream end of the jump, located over the sea in between Senj (on the coast) and the Krk island, the vertical wind component was strongly positive, fur-ther confirming the presence of a hydraulic jump. This feature is located well upstream of the islands and at an altitude at which it is clearly distinguish-able from the upward motions due to the flow over island topography.
The temporal development of the potential temperature field in the same cross-section is shown in Figure 12. At 05 UTC on November 6 the lower
tro-Figure 11. West-east vertical cross-section of the modeled winds for Senj (position of Senj is in-dicated with the circle). Wind vectors shown are vector sums of the modeled eastward and verti-cal wind components.
posphere was statically stable, with spatially uniform stability. The potential temperature field did not change significantly until 11 UTC on November 6, when a less stable layer started forming within the first 2 km above the sur-face. This layer of weak static stability was covered with a more stable layer, extending from about 2.8 km to 4.4 km.
At 17 UTC on November 6, the static stability of the lowest portion of the atmosphere across the entire cross-section was further decreased. The rising of the isentropes upstream (eastward) of the ridge is clearly seen, with this layer of upward flow extending up to 2 km above the ground. At this time, there is also an indication of the downslope flow initiation over the ridge. Six hours later, at 23 UTC on November 6, a dense packing of isentropes above Senj clearly suggests flow acceleration in this region of strong static stability (¶q/¶z~2 K/100 m) together with the attendant hydraulic jump at the down-stream end. It is also apparent that the acceleration of Bora flow starts up-wind of the mountain crest as indicated by the downward sloping isentropes there. With time, the descending isentropes above the mountain slope be-came more densely packed (compare, for example, 7 November 11 UTC with 17 and 22 UTC), and occupy a deeper layer. This suggests the deepening of the Bora layer and the intensification of acceleration, i.e.the strengthening of the Bora wind, the latter being confirmed by observations. Significant de-formations of isentropes are also found downstream of the Krk and Cres as well as the eastern Istria topographic barriers, especially during the early development stage of this Bora (5 UTC November 7). However, since these obstacles are lower than the coastal range, the hydraulic jumps they pro-duced were not as intense as the one in the Senj region. Later in this Bora de-velopment, only the hydraulic jump in the Senj region and the large isen-tropic deformations downwind of Krk remained.
Finally, Figure 13 shows the cross-sections of the modeled TKE. The weak turbulence (~ 1 m2s–2) started developing sporadically in the lowest layers only after 17 UTC on 6 November. At 5 UTC on November 7 turbulent regions were located downstream of topographical obstacles with the maxi-mal values about 1.4 km above the ground. The highest values (up to 14 m2 s–2) are found in the Senj region, whereas downstream of Krk, Cres and the Istrian coast values up to 7, 4, and 2 m2s–2are found, respectively. It should be noted that in our diagrams these regions are vertically stretched, and that their horizontal and vertical dimensions are ~ 10 km and ~ 1 km, respec-tively. With time, the regions of maximum TKE moved slowly downstream with the turbulence downstream of Krk intensifying more strongly compared to the Senj region. At 17 UTC on November 7 the maximal predicted values of TKE downstream of Krk and Senj were 30 and 13 m2s–2, whereas at 22 UTC on November 7 the corresponding numbers were 21 and 18 m2s–2, re-spectively. A comparison of Figures 12 and 13 shows that the regions of max-imalTKEvalues coincide with the large deformation of isentropes within the hydraulic jump regions.
Figure 12. West-east vertical cross-section of the modeled potential temperature (K) for Senj (position of Senj is indicated with the circle).
5.3 Hydraulic flow: Further details
Since the model results for the Senj region revealed the presence of inter-esting hydraulic-like airflow features with what appear to be multiple hy-draulic jumps, in this section we shall further investigate the evolution and properties of this flow. In the seminal papers by Long (1953, 1954), the foun-dations of the hydraulic flow analogy were laid out for a class of stratified airflows over an obstacle. In the first paper (1953), the author gave a theoret-ical analysis of the formation of a »hydraulic jump« in the stratified flow, whereas in the latter study (1954) he described several laboratory experi-ments with a two-fluid system. In discussing meteorological implications, Long pointed out that a hydraulic jump is expected to form in the lee of an obstacle if the internal Froude number (Fr) exceeds a certain value, depend-ing on the height of an inversion (defindepend-ing a top of the hydraulic layer) and the height of the obstacle. The internal Froude number isFr = U/N h,where N =(g q–1)¶q/¶z is the Brunt-Väisalä frequency,Uis the mean wind speed, andhis the mountain top height. Nonlinear effects in the stratified fluid flow over two-dimensional sinusoidal topography were investigated analytically by Smith (1977). According to his results, the nonlinear effects are important for moderate and large mountains (whenever non-dimensional mountain
Figure 13. West-east vertical cross-section of the modeled turbulent kinetic energy (m2s–2) for Senj (position of Senj is indicated with the circle).
height Nh/U, which is equal to Fr–1, approaches 1) even when mountain slopes are very gentle. Furthermore, Smith pointed out that the nonlinear lower-boundary condition has an important influence on the production of se-vere downslope winds. Based on idealized 2-D numerical simulations, Dur-ran (1986) showed for case when the static stability has a two-layer structure and the parameterNh/Uis as small as 0.3, that i) nonlinear waves are much larger than their linear counterparts, ii) the highest stability is found in the lower layer, and iii) that the flow resembles a hydraulic jump. Durran’s simu-lation results for the Boulder windstorm, which according to Smith (1987) is dynamically similar to the Bora, suggest that the transition to supercritical flow (i.e. flow withFr > 1), forced by the presence of a low-level inversion, plays an essential role in triggering the windstorm.
For a further investigation of the hydraulic nature of the Bora flow, we have selected an along-Bora vertical cross-section whose base is shown in Fig. 3 as line CD. Compared to the E-W vertical cross-sections for Senj (Figs. 11–13), the CD section extends substantially further eastward over the main-land. Along line CD we have marked points 1–7, which are indicated in Fig. 3, as well as in the vertical cross-sections in Figures 14–16. These points are selected as representative of conditions over the mainland (1 and 2), down-stream of the coastal mountains (3), at the top of the islands (Krk and Cres)
(4 and 6), in the channel between the two islands (5), and on the lee side of the last obstacle (7). Figures 14–16 show the modeled wind, potential tem-perature, and turbulent kinetic energy fields.
As seen from Figures 14–16, strengthening of the Bora is accompanied with the increase of static stability in the lower part of the atmosphere (Fig. 15 for November 7, for times from 09 to 18 UTC). This lowermost statically
Figure 14. NE-SW vertical cross-section of the modeled winds. The base of the cross-section (line CD) and the locations of points 1–7 are indicated in the Fig. 3. NE and SW are at the right and left side of the figure, respectively.
stable layer is deeper over the mainland than downstream of the mountains: above point 1 (over the mainland) the depth of the statically stable layer is about 3 km, while above points 3 and 4 (over the sea) this layer is about 1 km deep. The static stability is strongest above the major lee slope adjacent to the sea (a few km northeastward from point 3), where on November 7 at 18 UTC the model predicted¶q/¶z~1.2 K/100 m. (At that same time, in the most statically stable region above Senj ¶q/¶z~ 1.6 K/100 m.) Downstream of the
coastal mountains, a rather deep (»2 km) mixed layer is formed above this very stable lowest layer with strong winds. Within this mixed layer, charac-terized with a weak vertical potential temperature gradient and weak winds, isolated regions of high TKEare found (compare Figs. 14–16).
Additional examination of conditions along the line CD (not shown here) confirms the presence of a cold-air outbreak, in accordance with the study of Baji} (1987). This cold-air outbreak is more pronounced at the windward side of the mountains. For example, the modeled surface temperature for the end points 1 and 7 decreased, respectively, about 5 and 2 K from November 6 at 18 UTC to November 7 at 18 UTC. This indicates the damming of cold air up-stream of the coastal mountains, and build up of upup-stream fluid stratifica-tion.
Figure 15. NE-SW vertical cross-section of the modeled potential temperature (K). The base of the cross-section is indicated in the Fig. 3 by the line CD. NE and SW are at the right and left side of the figure, respectively.
Table 1 shows values of the Froude number (Fr), Brunt-Väisalä fre-quency (N), and along-Bora mean wind speed component (U) within the Bora layer for the seven points along line CD. Listed results clearly illustrate a temporal transition of the flow from a subcritical (Fr< 1) to a supercritical (Fr>1) flow for all points apart from point 1, which is located about 40 km in-land from the coastline. The transition was most rapid at point 3, i.e.at in the immediate lee of the coastal mountains. Furthermore, at the end of the investigated time period, at this point Fr reaches the highest value (1.75) compared to all other points along line CD. On the other hand, the transition from the subcritical to the supercritical flow was the slowest at point 2, where on November 7 at 18 UTC Fr was only slightly greater than the threshold value (1.02).
The model-derived Brunt-Väisalä frequencies (N) show a temporal in-crease of static stability at all seven points. The inin-crease inNover the exam-ined 24-hour interval is largest at points 1, 4, 6, whereDN/Dt= 0.004 s–1/ 24 h. This could be attributed to a denser packing of isentropes above the topo-graphical obstacles. On the other hand,DN/Dt is the smallest (0.002 s–1/ 24 h) for points 5 and 7, which are located on the lee sides of the islands Krk and Cres, respectively. The largest static stability at the end of investigated pe-riod is found over the mainland (N= 0.013 s–1, points 1 and 2), which further confirms stratification of the atmosphere upstream of the mountains due to the cold air damming.
Finally, throughout the whole Bora event modeled wind speeds were strongest downstream of the coastal mountains (point 3). On the other hand,
Figure 16. NE-SW vertical cross-section of the modeled turbulent kinetic energy (m2s–2). The base of the cross-section is indicated in the Fig. 3 by the line CD. NE and SW are at the right and left side of the figure, respectively.
Figure 16. cont.
Table 1. Froude number (Fr = U/N h), Brunt-Väisalä frequency N (s–1) and along-Bora mean wind speed component U (m s–1) within the Bora layer at points 1–7. Point positions are shown in Fig. 3 and Figs. 14–16.
Nov. 7, 00 UTC Nov. 7, 09 UTC Nov. 7, 18 UTC
Point Fr N U Fr N U Fr N U 1 0.69 0.012 9.3 0.80 0.011 9.9 0.78 0.013 11.4 2 0.75 0.013 10.4 0.97 0.012 12.9 1.02 0.013 15.0 3 1.32 0.011 15.7 1.15 0.011 18.7 1.75 0.012 23.5 4 1.17 0.011 14.0 1.45 0.011 17.3 1.53 0.012 20.3 5 1.21 0.010 12.8 1.25 0.010 13.3 1.64 0.010 18.4 6 1.26 0.010 13.8 1.20 0.011 14.6 1.55 0.012 20.6 7 1.19 0.009 11.4 1.33 0.009 13.0 1.67 0.010 17.6
weakest wind speeds were predicted for the inland point 1, where throughout the whole Bora event airflow remained subcritical.
6. Conclusions
We have carried out a study of the 7 November 1999 Bora case employing the mesoscale nonhydrostatic model MEMO. The model was run over a rela-tively small domain but at a very high horizontal resolution (grid spacing of 1 km), which has afforded us a detailed insight in the meteorological conditions in the lower troposphere during the Bora event over the Northern Adriatic. The selected Bora case, one of the strongest Bora cases in recent decades, was documented during the Mesoscale Alpine Programme SOP (IOP 15) with in situ aircraft measurements over the Adriatic Sea. Additionally, we have used standard surface meteorological measurements available at several coastal sites as well as upper-level data for the model verification.
A comparison between the measured and the modeled surface winds for this Bora event showed that the employed mesoscale model was able to pre-dict well both the wind directions and the timing of the Bora event. A good agreement was also found between the modeled and measured upper-level winds. Consequently, we found the large discrepancies between the mea-sured and modeled surface wind speeds at Senj and Rijeka surprising. After further investigation and the consultation with the Meteorological and Hy-drological Service of Croatia staff, we have reached the conclusion that the quality of Senj and Rijeka measurements is questionable due to the sheltered location of these two sites. In order to further investigate this data quality problem, in the future we plan to simulate Bora events from other time peri-ods. One such period is the experimental period from December 2001 to Jan-uary 2002, during which surface winds in Senj were measured at two mea-suring sites, the routine station used in this study as well as an additional experimental measuring site.
The comparison of our model results with the MAP IOP 15 measure-ments showed a good agreement. The model simulation reproduced the topo-graphically induced elongated relative vorticity filaments, whose downstream lengths and widths perpendicular to the airflow were a few tens of kilometers and a few kilometers, respectively. We note, however, that the full length of the vorticity banners is likely much larger, and could not be captured in our relatively small domain. Also, the width of the vorticity banners was smaller than measured in MAP and simulated by the COAMPS model at the resolu-tion of 3 km. This seems to point to a known tendency of simulated vorticity banners to display finer structure at higher model resolutions. The maxi-mum value of the vertical vorticity (z)within the anomalies was on the order of 10–2s–1. The origin of vertical vorticity anomalies coincided with the down-stream-elongated regions of increased potential temperature (q) and
turbu-lent kinetic energy (TKE). The latter, together with the vorticity anomalies indicate regions of irreversible transformation of the balanced synoptic scale flow to the smaller scale unbalanced airflow.
The examination of the along-Bora vertical cross-sections showed a for-mation of the ground-based layer of strong static stability. This stable layer was much deeper over the mainland (» 3 km) compared to the layer down-wind of the mountains, where its depth (» 1 km) was comparable with the height of the coastal mountains. The strongest static stability, on the order of magnitude of¶q/¶zof 1 K/100 m, was found above the major lee slope adja-cent to the sea.
Downstream of the coastal range, the maximal wind speeds (up to 30 m s–1) were simulated. These zones of both the maximum low-level winds and strong static stability were capped with a rather deep (» 2km) well-mixed layer of weak winds, which is in accordance with the results of Smith (1987). Therefore, a strong vertical wind shear (up to –1.8 m s–1/ 100 m) was estab-lished. Regions of the strongest wind shear coincided with the horizontally extended regions of increased TKE, which indicates the importance of the shear generation of turbulent kinetic energy. The above TKE zones, of the horizontal and vertical dimensions of the order of magnitude of 10 and 1 km, respectively, were found downwind of the coastal mountains and the Island of Krk throughout the whole duration of the Bora event.
The model also captured well the transition over the mountains from a subcritical to a supercritical flow, which was forced by the blocking of the cold air upstream of the coastal mountains in the presence of a low-level in-version. The subsequent formation of multiple hydraulic jumps was also cap-tured by the model. The strongest jump was associated with the highest por-tion of the coastal mountains (i.e.the highest topographical obstacle), where the most rapid transition from the subcritical to the supercritical flow, and the highest values of the Froude number (Fr) were predicted. Similar, but weaker jumps were found downstream of the islands. The zones of maximum TKE coincided with the regions of steeply rising isentropes within the hy-draulic jumps.
Finally, we note that all investigated physical quantities exhibited their most dramatic temporal behavior and spatial gradients in the region of Senj.
Acknowledgements– We thank Theodoros Nitis of the Laboratory of Heat Transfer and Environmental Engineering, Aristotle University Thessaloniki, Greece for preparing the land-use and topography data. The standard meteorological data was kindly provided by the Meteorological and Hydrological Service of Croatia with a particular engagement of Dr. Branka Ivan~an-Picek and @ivko Tro{i}, M.Sc. Dr. Vanda Grubi{i}'s involvement in this study was supported by the NSF grant ATM-0002735. We extend our thanks to the PV banner project scientists Christoph Schär, Louisa Nance, and Marty Ralph for their contri-butions in designing this PV banner mission and collecting the data, and numerous people within the MAP organization for making the MAP data used in this study available. This study was partially supported by the Ministry of Science and Technology of Republic of Croatia project no. 0119330.
References
Baji}, A., (1987): Cold air outbreak and the Adriatic bora. Geofizika,4, 27–37.
Baji}, A., (1991): Application of the two-layer hydraulic theory on the severe Northern Adriatic bora. Meteorol. Rund.,44, 129–133.
Carpenter, K. M. (1982): Note on the paper 'Radiational condition for the lateral boundaries of limited-area numerical models' by Miller M. J. and Thorpe, A. J. (Q. J. R. Met. Soc,107, 615–628). Quart. J. R. Met. Soc.,108, 717–719.
Durran, D. E. (1986): Another look at downslope windstorms. Part I: The development of analogs to supercritical flow in an infinitely deep, continuously stratified fluid. J. Atmos. Sci.,43, 2527–2543.
Enger, L., and Grisogono, B. (1998): The response of bora type flow to sea surface temperature. Q. J. R. Meteorol. Soc.,124, 1227–1244.
Grubi{i}, V., (1989): Application of the hydraulic theory in cases of bora with strong upstream flow. Rasprave,24, 21–27.
Grubi{i}, V., (2000): Bora driven PV banners over the Adriatic: Preliminary results. MAP News-letter13, 66–67.
Grubi{i}, V. (2001): Structure of wake north of the Alps: PV banners during an episode of deep south Foehn. Proceedings. AMS Ninth Conference on Mesoscale Processes, 30 July-2 August 2001, Ft. Lauderdale, FL, AMS, 180–183.
Grubi{i}, V. (2004): Bora driven potential vorticity banners over the Adriatic. Q. J. R. Meteorol. Soc., in press.
Heimann, D., (2001): Model-based wind climatology of the eastern Adriatic coast. Meteorol. Z.,
10, 5–16.
Ivan~an-Picek, B., and Tuti{, V. (1996): A case study of a severe Adriatic bora on 28 December 1992. Tellus,48A, 357–367.
Jur~ec, V. (1981): On mesoscale characteristics of bora conditions in Yugoslavia. Pure Appl. Geophys.,119, 640–657.
Klai}, Z. B., and Nitis, T. (2001–2002): Application of mesoscale model (MEMO) to the greater Zagreb area during summertime anticyclonic weather conditions. Geofizika,18–19, 31–43. Klai}, Z. B., Nitis, T., Kos, I., and Moussiopoulos, N. (2002): Modification of the local winds due
to hypothetical urbanization of the Zagreb surroundings. Meteorol. Atmos. Phys.,79, 1–12. Klai}, Z. B., Belu{i}, D., Herceg Buli}, I., and Hrust, L. (2003): Mesoscale modelling of
meteoro-logical conditions in the lower troposphere during a winter stratospheric ozone intrusion over Zagreb, Croatia. J. Geophys. Res.-Atmos.,108, 4720, 10.1029/2003JD003878J.
Kora~in, D. (1984): Parameters of bora flow. Zbornik Meteorol. Hidrol. Radova,10, 109–111. Kunz, R., and Moussiopoulos N. (1995): Simulation of the wind field in Athens using refined
boundary conditions. Atmos. Environ.,29, 3575–3591.
Lazi}, L., and To{i}, I. (1998): A real data simulation of the Adriatic bora and the impact of mountain height on bora trajectories. Meteorol. Atmos.Phys.,66, 143–155.
Long, R.R. (1953): Some aspects of the flow of stratified fluids. I. A theoretical investigation. Tellus,5, 42–58.
Long, R.R. (1954): Some aspects of the flow of stratified fluids. II. Experiments with a two-fluid system. Tellus,6, 97–115.
Makjani}, B. (1970): On the diurnal variation of the bora wind speed. Papers,349, Yugoslav Academy of Sciences and Arts, Zagreb, 33–92.
Makjani}, B. (1976): A short account of the climate of the town Senj. In: Local wind bora. (Yoshino M. M., ed.), University of Tokio Press, 145–152.
Makjani}, B. (1978): Bura, jugo, etezija. Prilozi poznavanju vremena i klime SFRJ. Svezak 5, Savezni hidrometeorolo{ki zavod. Beograd.
Moussiopoulos, N. (ed.) (1994):The EUMAC Zooming model: model structure and applications. Garmish-Partenkirchen: EUROTRAC special publication, ISS, 266 pp.
Moussiopoulos, N. (1995): The EUMAC Zooming model, a tool for local-to-regional air quality studies. Meteorol. Atmos.Phys.,57, 115–133.
Moussiopoulos, N., Sahm, P., Karatzas, K., Papalexiou, S., and Karagiannidis, A. (1997a): Assesing the impact of the new Athens airport to urban air quality with contemporary air pol-lution models. Atmos. Environ.,31, 1497–1511.
Moussiopoulos, N., Sahm, P., Kunz, R., Vögele, T., Schneider, C., and Kessler C. (1997b): High-resolution simulations of the wind flow and the ozone formation during the Heilbronn ozone experiment. Atmos. Environ.,31, 3177-3186.
Orli}, M., Kuzmi}, M., and Pasari}, Z. (1994): Response of the Adriatic Sea to the bora and si-rocco forcing. Continental Shelf Res.,14, 91–116.
Petkov{ek, Z. (1990): Upper boundary of the bora as a stationary frontal surface. Meteorol. Atmos. Phys.,43, 197–202.
Petkov{ek, Z. (1991): Additional bora characteristics according to the frontal model. Geofizika,8, 25–31.
Qian, M. W., and Giraud, C. (2000): A preliminary numerical simulation of bora wind with a lim-ited area model of atmospheric circulation. Nuovo Cimento Soc. Ital. Fis. C-Geophys. Space Phys.,23, 515–523.
Schär, C, M. Sprenger, D. Lüthi, Q. Jiang, R. B. Smith, and R. Benoit (2003): Structure and dy-namics of an Alpine potential vorticity banner. Q. J. R. Meteorol. Soc.,129, 825–856. Smith, R. B. (1977): The steepening of hydrostatic mountain waves. J. Atmos. Sci.,34, 1634–
1654.
Smith, R. B. (1987): Aerial observations of the Yugoslavian bora.J. Atmos. Sci.,44, 269–297. Tudor, M., and Ivatek-[ahdan, S. (2002): MAP IOP 15 case study. Cro. Met. Jour.37, 1 –14. Vu~eti}, V. (1984): On the time and space variations of the northern Adriatic bora. Zbornik
Meteorol. Hidrol. Radova,10, 134–137.
Vu~eti}, V. (2002): (Meteorological and Hydrological Service of Croatia, personal communica-tion).
SA@ETAK
Struktura mezoskalnog strujanja nad sjevernim Jadranom tijekom MAP IOP 15 eksperimenta – slu~aj jake bure Zvjezdana Benceti} Klai}, Danijel Belu{i}, Vanda Grubi{i}, Lada Gabela
i Ladislav ]oso
Ispitali smo slu~aj jake bure na sjevernom Jadranu, koji se dogodio 7. studenog 1999. tijekom MAP IOP 15 eksperimenta. Polja vjetra, potencijalne temperature, vertikalne komponente relativne vrtlo`nosti i turbulentne kineti~ke energije u donjoj troposferi simulirana su nehidrostatskim mezoskalnim modelom (MEMO) s vrlo fi-nom horizontalfi-nom rezolucijom od 1 km. Simulacija je to~no reproducirala nastup bure, a modelirana polja dobro su se podudarala s rutinski mjerenim vjetrom du` hrvatske obale te su pokazala visoku razinu konzistencije s MAP mjerenjima nad morem. Rezultati modela tako|er su omogu}ili detaljan uvid u strukturu hidra-uli~kog toka te u termodinami~ke uvjete tijekom bure. Rezultati simulacije potvrdili su postojanje topografski induciranih pruga vrtlo`nosti, koje nastaju u blizini obalnih planina, u turbulentnim podru~jima ~iji polo`aj se podudara s tokom hidrauli~kih svojstava. Svi ti procesi najintenzivniji su u podru~ju Senja.
Klju~ne rije~i:bura, hidrauli~ki tok, sjeverni Jadran
Corresponding author's address: Zvjezdana Benceti} Klai}, Andrija Mohorovi~i} Geophysical Institute, Faculty of Science, University of Zagreb, Horvatovac bb, 10000 Zagreb, Croatia, e-mail: zklaic@rudjer.irb.hr.