Foreign exchange rates and Japanese foreign direct
investment in Asia
In-Mee Baek
a,*, Tamami Okawa
baDepartment of Economics, Suffolk University, 8 Ashburton Place, Boston, MA 02108, USA b
KPMG Fides Peat, Oberwilerstrasse 74, 4102 Binningen, Switzerland
Abstract
We show that an appreciation of the yen against the dollar and against the Asian currencies significantly increases Japanese foreign direct investment (FDI) in Asia. Also, a depreciation of the Asian currencies against the dollar, while not significantly affecting the FDI in aggregate manufac-turing, have a significant positive impact in the export-oriented electrical machinery sector. The labor productivity differential has a significant impact on FDI in most sectors but the direction of the effect varies across sectors. Also, there is evidence that a higher import tariff rate or wage rate in the host country significantly decreases Japanese investment in Asia. © 2001 Elsevier Science Inc. All rights reserved.
JEL classification:F21; F23
Keywords:Foreign exchange rates; Japanese investment; FDI in Asia
1. Introduction
As the yen grew strong in the latter half of 1980s,1 Japanese foreign direct investment (FDI) increased rapidly. With the weakening of the yen in 1991 and 1992, the growth of FDI slowed down. However, in the ensuing years the rise in the value of the yen again led to an acceleration of offshore manufacturing even as unemployment rate in Japan rose to a postwar high.2 A noticeable feature in the regional composition of Japanese FDI has been its increasing concentration in Asian countries. The share of the total Japanese FDI in Asia for
* Corresponding author. Tel.:11-617-573-8376; fax:11-617-994-4216. E-mail address:[email protected] (I.-M. Baek).
manufacturing sectors was about 20% in the 1980s; it increased to 33% in 1993 and about 38% in 1997.3Considering the importance of the role of exchange rates in Japanese FDI and its concentration in Asian countries, this paper examines two related questions: (a) what is the effect of exchange rates on Japanese FDI in manufacturing? And, (b) what is the relative importance of different exchange rates—the yen against the dollar and against the Asian currencies, and the dollar against the Asian currencies?
Most of the existing studies on the relationship between FDI and exchange rates focus on investment flows in the US and on the bilateral exchange rates between the home (source) country and the host country (i.e., the US). These bilateral exchange rates are important when FDI is for production and sales in the host country. However, a significant proportion of Japanese FDI into Asia is directed for production for a third market. According to a survey by the Ministry of International Trade and Industry (MITI) of Japan, the domestic sales of Japanese subsidiaries in manufacturing industries in Asia were only 40% of their total sales in 1997 and 1998 while those in the US were over 70% for the same period.4 In general, Japanese FDI in Asian countries is characterized as export-oriented investment to create a production site for exporting. When this characteristic of Japanese FDI into Asia is consid-ered, the investment decision must be based on not only the exchange rates between the yen and the host countries’ currencies (henceforth, the Asian currencies), but also the exchange rates of the yen and the Asian currencies against the currency customarily used in interna-tional transactions, e.g., the US dollar. This is an issue of sharply growing interest and importance in relation to the recent Asian currency crisis for the following reasons. As noted earlier, Japanese investment in this region has been propelled largely by the strong yen against the US dollar. Since the value of many Asian currencies was more or less tied to a basket of currencies, primarily to the dollar, Japanese companies could use them as a low-cost substitute for an American manufacturing base. However, Asian currencies sharply devalued against the dollar in 1997, and against the yen to a lesser extent; but the yen also depreciated against the dollar. It would be interesting to examine if Japanese investment in Asia is significantly affected by not only the yen-dollar exchange rates but also the Asian currencies against both the dollar and the yen. Since the Japanese FDI in Asia has become a significant source of economic growth in the region, the result of the study would suggest important exchange rate policy implications to the countries, which want to attract Japanese investment or provide an incentive to investors to use them as an export base.5In examining the role of exchange rates in Japanese FDI in Asia, the analysis in this paper thus focuses on exchange rates of the yen against the Asian currencies, of the yen against the US dollar, and of the dollar against the Asian currencies.
and the relative rent in the two countries significantly affected the relative ratio of exports to FDI while wage rates were not a significant factor. Froot and Stein (1991) focus on the link between exchange rate and FDI given imperfect information about capital markets. They show that FDIs into the US during 1973 to 1988 were negatively related to the real value of the dollar. When the study used data on FDI that is disaggregated by types of transactions, the same result also holds for most types of transactions with the exception for real estate transactions.7Klein and Rosengren (1994) examine whether relative wealth across countries caused by information imperfection of capital markets and relative wages have been of significant importance on FDI to the US from seven industrial countries including Japan over the period of 1979 –1991. They found strong evidence to suggest that relative wealth significantly affected FDI while relative wages were not significant. An appreciation of real exchange rates of the dollar significantly decreased all types of FDI except for the acquisition of land.
Studies also focus on specific motives of a firm for foreign investment in explaining the link between foreign investment and exchange rates. For example, in Blonigen (1997), the relevance of exchange rate in FDI is explained in the case of foreign acquisition of firm-specific assets since it can generate returns in various currencies other than that used for purchase. This theory is tested using the data on Japanese acquisitions in the US from 1975–1992. Results show that a real appreciation of the yen is strongly associated with higher levels of Japanese acquisitions in the US for firms in industries which are more likely to acquire firm-specific assets whereas the effect is not significant in cases where acquisition of firm-specific assets is not involved. In Choi (1989), the motivation of corporate interna-tional investments is to diversify risks associated with operainterna-tional cash flows and with real exchange rate. The study theoretically demonstrates that, in a stochastic world, the covari-ance of exchange rates with output and input prices is a significant factor in foreign investment decision, suggesting that gains from real exchange risk diversification attract foreign investment. Hung (1997) focuses on the effect of exchange rate on multinational companies’ overseas profits. The study empirically shows that a 1% dollar depreciation increases overseas profits by 0.94%. Since a 1% dollar depreciation is translated into a 1% increase in dollar profit for a given foreign currency profit, the results suggest that the net volume effect of exchange rate on overseas profits is negligible.
The rest of the paper is as follows. Section 2 examines decisions on FDI and derives estimation equations, followed by data description and the estimation method in Section 3. Estimation results are presented in Section 4 and Section 5 concludes the paper.
2. Decisions on foreign direct investment
Consider a firm producing an internationally traded composite good and using two inputs—labor and imported raw material—in the production. Assuming a fixed coefficient production function, the production cost in Japan in yen, Cj, is:
Cj5WjAj1R*
Ej Bj (1)
where Ajand Bj are the labor and raw material required to produce one unit of the good, respectively, Wjis the nominal wage rate in the source country in domestic prices (yen), Ej is the exchange rate of yen per US dollar, and R* is the world price of raw material in dollars. Then, the dollar production cost in Japan, C*j, is:
C*j5 WjAj
Ej
1R*Bj (2)
Eq. (2) shows that an appreciation of the yen makes the dollar cost of production (equiva-lently, the dollar price of Japanese product under perfect competition) higher, deteriorating Japanese competitiveness in international trade. To stay competitive, firms have to improve their productivity by decreasing Ajor Bj, or decreasing the domestic wage rate, Wj. Or, firms would invest abroad to take advantage of a lower cost of production in dollars. Let C*hbe the dollar production cost in host countryh as:
C*h5 WhAh
Eh
1R*Bh (3)
where Ahand Bhare the labor and raw material used to produce one unit of the good in the host country, respectively, Wh is the nominal wage rate in the host country, and Eh is the exchange rate of the Asian currency per dollar. Eq. (3) indicates that a lower production cost abroad comes not only from a lower wage rate but also from a depreciation of the host country’s currency against the dollar.
It is assumed that due to technology transfer accompanied by FDI there is no differential in the raw material input in the production between the host country and Japan, implying that Bj5Bh. Then, the production cost differential depends on the share of labor cost in domestic production, C*Lj (5WjAj/Ej), relative to that in foreign production, C*Lh (5WhAh/Eh).
tariff-adjusted cost differential in dollar terms. Now suppose that FDI in countryh, Fh, is a function of the tariff-adjusted cost differential as:
Fh5f
S
(11t)C*LjC*Lh
D
5g
F
(11t)S
WjAj WhAhDS
Eh
Ej
DG
(4)where tis the tariff rate imposed on imports by the host country. One should note that Ak (k 5 j, h) represents inverse of labor productivity since it represents the amount of labor required in producing one unit of the product in country k. When, other things being equal, the labor productivity of country h increases, production in country h becomes more competitive, attracting FDI. However, FDI is often used to transfer technology when a firm has a competitive advantage in technologies or management skills, and uses its advantage to earn profits by investing directly in foreign countries. If FDI is intended for technology transfer, the larger the productivity differential between Japan and countryh,the greater FDI flows to country h. Therefore, the productivity differential also measures the need for technology transfer. In order to capture the role of technology transfer in the FDI decision, the labor productivity differential between Japan and host country is considered as a determinant of FDI, instead of the productivity of Japan and that of host country separately. Then, a log-linearization of Eq. (4) is obtained as: (Henceforth, lower-case letters denote the logarithm of a variable; x [lnX.)
fht5b1daht1b2wjt2b3wht1b3eht2b4ejt1b5tht (5) where dah 5aj2ah and all theb’s are expected to be positive except for b1.b1 would be negative if FDI is mainly to take advantage of relatively low unit production cost; and positive if FDI is attributed to technology transfer.
When the investment decision is based on the production cost differential in terms of the yen, the exchange rates between the yen and the Asian currency are accounted for as:
fht5c1daht1c2wjt2c2wht1c3eyt1c4tht (6) where ey (5eh2 ej) is the exchange rate of the Asian currency per yen.
It has often been argued in the literature that real exchange rate rather than nominal rate determines FDI. To further examine this, we specify each of the nominal exchange rates as the combination of the purchasing power parity (PPP) and the deviation from the PPP, equivalently, the real exchange rate, q. For example, the exchange rate of the Asian currency per dollar at t, eh,t, is:
eh,t5(ph,t2pus,t)1qh,t (7) where qh,t5eh,t2ph,t1pus,t,
and phand pusare the price levels of countryhand the US, respectively. The PPP relationship is often generalized in a form of proportional changes in exchange rate and in the price levels, which is called therelativeversion of PPP. Then, based on the relative PPP, the change in nominal exchange rate is rewritten from Eq. (7) as:
where Dxt5xt2xt21 (x5e,p,q). Eq. (8) indicates that the change in nominal exchange rate is the sum of the inflation rate differential and the change in real exchange rate. Since
Deh,t 5eh,t 2eh,t21, eh,tis specified as:
eh,t5ph,t1dh,t (9)
wherepkt 5eh,t21 1(Dph,t2 Dpus,t), therelative PPP rate anddkt5 Dqh,t, the change in real exchange rate. For ejand ey, we obtain the similar specification.
This specification of the actual exchange rates enables us to conduct the following line of inquiry. Suppose that Japanese firms believe that the PPP rate is an equilibrium exchange rate and the deviation from the PPP is temporary and thus use the PPP rate as a base exchange rate to evaluate the dollar cost of Japanese production. Then, only the PPP rate matters in their investment decision.9 On the other hand, if investors perceive that overvalued or undervalued exchange rates from the PPP level reflect the exchange rate movements caused by fundamental factors other than price changes, then the deviation from the PPP rate should be also accounted for. To examine the importance of each component of the exchange rate, using Eq. (9) Eqs. (5) and (6) are rewritten as:
fht5g1daht1g2wjt2g3wht2g4pjt2g5djt1g6pht1g7dht1g8tht (10)
fht5z1daht1z2wjt2z3wht1z4pyt1z5dyt 1 z6tht (11) Based on Eqs. (5), (6), (10) and (11), estimation equations for the aggregate manufacturing and for individual sector are derived.
3. Estimation
3.1. Estimation method
The data used in estimation are cross-sectional and time-series annual data. The data are disaggregated by country as well as by sector; the data are from 6 countries and 8 sectors for each country. The data covers the period from 1983 to 1992, resulting in a total of 480 observations.10
Estimation method is based on standard time series-cross sectional regression models. The regressions are for the aggregate manufacturing as well as for each sector. In the regression for the aggregate sector, country- and sector-specific constant terms are included to capture differences across the countries and sectors. Then, based on Eq. (5), the estimation equation for the aggregate manufacturing sector is written as:11
fhit5
O
data set used in the estimation contains 48 subgroups (8 sectors for each of 6 countries) with each subgroup having 10 observations. The estimation equations for the aggregate sectors based on Eqs. (6), (10) and (11) are also specified in a similar manner.
The regression equation for each sector is also estimated using the same method. To capture differences across the countries, the estimation equation includes country-specific constant terms. Then, based on Eq. (5), the estimation equation for each sector is written as:
fht5
O
h b0h1b1daht1b2wht1b3wjt1b4ejt1b5eht1b6tht1mht (13) whereb0his a dummy variable indicating host countryh.Using pooled OLS, the LM test of the hypothesis of homoscedasticity is rejected in all cases. Also, groupwise heteroscedas-ticity, i.e., E(mjt
2
) 5 sjj is tested as a restriction on groupwise heteroscedasticity and cross-group correlation, i.e., Cov(mkt,mjt)5skj. The LM test indicates a significant presence of cross-sectional correlation in most cases.12To correct for these problems, the estimation process allows for groupwise heteroscedasticity, and correlation of the disturbances across groups if necessary. For each sector, there are 6 groups (for 6 countries), with each group having 10 observations. The estimation equations for each sector based on Eqs. (6), (10) and (11) are also specified in the same manner.
3.2. Data
Data used in the estimation include 6 countries—Newly Industrialized Countries except Taiwan (South Korea, Hong Kong, and Singapore) and ASEAN-3 (Malaysia, Indonesia and Thailand). For each country, the data are from 8 sectors; chemicals and allied products, electrical machinery, food, primary metals and fabricated metal products, general machinery, textile products, transportation machinery, and ‘others’. Electrical machinery sector is the most primary sector in Japanese manufacturing FDI in Asia in terms of the value of investment, followed by chemical sector in 1996 and 1997.13 The dependent variable is Japanese FDI in each country for each sector in dollars. The data on FDI used in this study are compiled by the Ministry of Finance (MOF) based on data submitted by Japanese investors, as required by the Foreign Exchange Control Law.14 The independent variables are:
(a) labor input coefficient of production in Japan and host countries, ajand ah. Index of ajis calculated by the number of employment divided by the real output for each sector, using 1987 as the base year. For index of ah, we either use the inverse of a country’s real output per employee in manufacturing as published by the World Bank, or calculated by using employment index and real gross national products. The lower the dah(5aj2ah), the lower labor productivity of countryhrelative to Japan, and thus the higher the unit production cost in countryh.Therefore, other things being constant, it would have a negative impact on FDI. However, if FDI is mainly motivated for technology transfer, a lower dah indicates more need for technology transfer and thus increase FDI.
low wage rate in a country attracts foreign direct investors. A higher (lower) wage rate at home (abroad), a more FDI. Therefore, an increase in wj(wh) would increase (decrease) FDI. (c)exchange rates, ej, eh, and ey. ejand ehare the log of the nominal exchange rate of the yen and the Asian currency per dollar, respectively. They are obtained fromthe International Financial Statisticspublished by the IMF. eyis the log of the nominal exchange rate of the Asian currency per yen that is calculated by subtracting ej from eh. A depreciation of the Asian currency against the dollar would make the production of the host country more competitive in international trade market. Thus, we expect that ehhave a positive impact on FDI. Also, an appreciation of the yen against the dollar or the Asian currencies would increase Japanese production cost at home, resulting in an increase in investment abroad by Japanese firms. Therefore, it is predicted that ej(ey) has a negative (positive) impact on FDI. (d) PPP rates, pj, ph, and py. The PPP rates are calculated based on the relative PPP, using 1980 as the base year.
(e)change in real exchange rates(or,deviation from the PPP rates),dj,dh, anddy. They are calculated subtracting the PPP rates from the nominal exchange rates.
(f) import tariff, t. t is measured by import duties as a percentage of imports for each country, as published by the World Bank.15
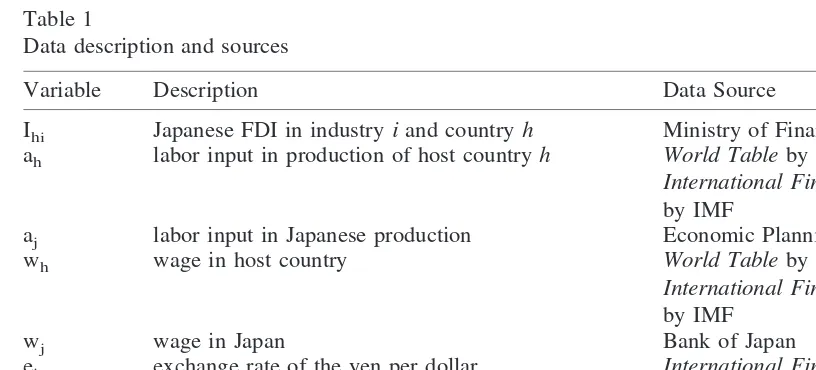
Detailed data description and the sources are shown in Table 1.
4. Estimation results
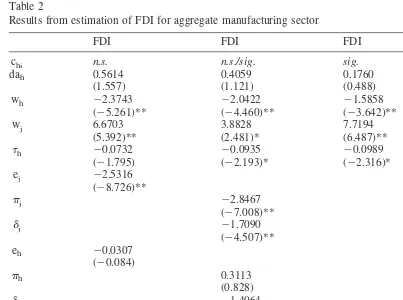
Results from the estimation for the aggregate manufacturing sector appear in Table 2.16 FDI at the aggregate level is significantly affected not only by the exchange rate between the source country’s currency (yen) and the Asian currency, ey, but also by the exchange rate between the yen and the dollar, ej. The nominal exchange rates and the PPP rates for these
Table 1
Data description and sources
Variable Description Data Source
Ihi Japanese FDI in industryiand countryh Ministry of Finance of Japan
ah labor input in production of host countryh World Tableby the World Bank and International Financial Statistics by IMF
aj labor input in Japanese production Economic Planning Agency of Japan
wh wage in host country World Tableby the World Bank and International Financial Statistics by IMF
wj wage in Japan Bank of Japan
ej exchange rate of the yen per dollar International Financial Statistics
by IMF eh exchange rate of host country’s currency per
dollar
International Financial Statistics by IMF
currencies are all significant in explaining FDI at the 1% level.17 Also, the signs of the coefficients on exchange rates are all consistent with the prediction, indicating that an appreciation of the yen against the dollar or against the Asian currencies significantly increases FDI. This implies that an appreciation of the yen worsens Japanese competitiveness of manufacturing sector making their production abroad more attractive or the appreciation of yen makes it cheaper for Japanese firm to invest abroad. On the contrary, neither of the nominal exchange rate of the Asian currencies per dollar, eh, nor the PPP rates or the real
Table 2
Results from estimation of FDI for aggregate manufacturing sector
FDI FDI FDI FDI
(The value in the parentheses is the t-value. * and ** indicate significance at the 5 percent and 1 percent, respectively.)
FDI5Japanese foreign direct investment;
chi 5country- and industry-specific dummy variable wheren.s.indicates not significant and sig.indicates
significant;
dah5labor input coefficient differential between Japan and host country h;
wh, wj5wage rate in host country h and in Japan, respectively;
th5import tariff rate in country h; ej5exchange rate of the yen per the dollar;
eh5exchange rate of host country’s currency per the dollar;
ey5exchange rate of host country’s currency per the yen;
tk5the PPP rate of ek(k5j,h,y);
exchange rate change significantly affects FDI.18This suggests that a depreciation of those countries’ currencies against the dollar, which improve international competitiveness of the production in the host countries, does not induce the Japanese FDI in manufacturing at the aggregate level, unless it results in a depreciation of the currencies against the yen.
Results also show that in all specifications wage rates both in Japan and host countries significantly affect FDI in the aggregate manufacturing sector. As expected, an increase (decrease) in the wage rate in Japan (host countries) significantly increases FDI. These results indicate that production cost differentials between the Asia countries and Japan, whether it is a result of a wage rate differential or a weak currency against the yen, significantly induce the Japanese FDI in the manufacturing sector.
In addition, the results indicate that labor productivity differential does not have a significant effect on the overall FDI in the manufacturing sector. This insignificant effect could be because the productivity differential affects FDI in two opposite directions. The higher the Japanese productivity relative to the host country, the higher the unit production cost abroad and thus the lower the FDI. On the contrary, a higher productivity differential indicates more need for technology transfer, resulting in a greater FDI. Therefore, with these factors simultaneously at work across the sectors, the productivity differential could have an insignificant impact at the aggregate level.
A noticeable result is that the import tariff rate has a negative impact on FDI. When import tariff in host country increases, exports of goods produced in Japan become more expensive. The traditional argument is that to by-pass the tariff Japanese firms would increase the investment and production in the tariff-imposing country. Thus, a higher tariff would induce more FDI. However, the results in Table 2 are contrary to this traditional view. One possible explanation of this result is that Japanese FDI in Asia is not mainly intended to avoid protectionism. A higher tariff in those countries may be an indicator that the economy is less open and/or the business environment is less accommodating to foreign investors. Moreover, since Japanese FDI often induces exports of raw materials and parts from the parent company in Japan to Japanese subsidiaries or their incorporated companies in host countries, a higher tariff rate would make Japanese exports of intermediate goods more expensive and thus discourage FDI.19 However, this interpretation should be treated with caution because various important forms of nontariff barriers are not included in the import tariff rates.
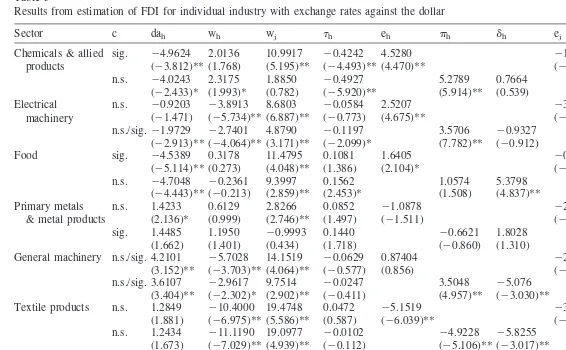
Results from estimation of FDI for individual industry with exchange rates against the dollar
Sector c dah wh wj th eh ph dh ej pj dj
Chemicals & allied products
sig. 24.9624 2.0136 10.9917 20.4242 4.5280 21.1002 (23.812)** (1.768) (5.195)** (24.493)** (4.470)** (22.510)*
n.s. 24.0243 2.3175 1.8850 20.4927 5.2789 0.7664 21.6646 1.4688 (22.433)* (1.993)* (0.782) (25.920)** (5.914)** (0.539) (22.839)** (2.524) Electrical
machinery
n.s. 20.9203 23.8913 8.6803 20.0584 2.5207 23.4954 (21.471) (25.734)** (6.887)** (20.773) (4.675)** (213.845)**
n.s./sig.21.9729 22.7401 4.8790 20.1197 3.5706 20.9327 23.3691 22.4784 (22.913)** (24.064)** (3.171)** (22.099)* (7.782)** (20.912) (29.776)** (27.454}**
Food sig. 24.5389 0.3178 11.4795 0.1081 1.6405 20.9302
(25.114)** (0.273) (4.048)** (1.386) (2.104)* (21.433)
n.s. 24.7048 20.2361 9.3997 0.1562 1.0574 5.3798 22.7927 21.9800 (24.443)** (20.213) (2.859)** (2.453)* (1.508) (4.837)** (22.582)** (22.652)** Primary metals
& metal products
n.s. 1.4233 0.6129 2.8266 0.0852 21.0878 22.2091 (2.136)* (0.999) (2.746)** (1.497) (21.511) (26.107)**
sig. 1.4485 1.1950 20.9993 0.1440 20.6621 1.8028 23.3850 21.7989 (1.662) (1.401) (0.434) (1.718) (20.860) (1.310) (25.414)** (23.799)** General machinery n.s./sig. 4.2101 25.7028 14.1519 20.0629 0.87404 22.0866
(3.152)** (23.703)** (4.064)** (20.577) (0.856) (24.661)**
n.s./sig. 3.6107 22.9617 9.7514 20.0247 3.5048 25.076 20.5774 0.6052 (3.404)** (22.302)* (2.902)** (20.411) (4.957)** (23.030)** (20.799) (1.216) Textile products n.s. 1.2849 210.4000 19.4748 0.0472 25.1519 23.9435
(1.881) (26.975)** (5.586)** (0.587) (26.039)** (26.193)**
n.s. 1.2434 211.1190 19.0977 20.0102 24.9228 25.8255 24.2713 23.91238 (1.673) (27.029)** (4.939)** (20.112) (25.106)** (23.017)** (23.888)** (24.217)** Transportation
machinery
n.s. 23.9834 2.8190 23.0054 20.0177 22.0808 21.7378 (21.811) (1.455) (20.562) (20.164) (21.609) (20.164)
n.s. 23.2926 3.5307 25.1640 20.2345 20.0982 28.437 0.2731 0.1047 (21.945) (2.647)** (20.866) (23.103)** (20.094) (26.017)** (0.179) (0.073) Other n.s. 1.2755 24.1880 8.7333 20.0512 20.2640 22.8607
(2.188)* (28.510)** (7.901)** (20.979) (20.491) (28.611)**
n.s. 1.1189 24.1422 9.5241 20.0546 20.2352 20.8928 22.5812 22.8516 (1.620) (27.956)** (5.469)** (20.940) (20.399) (20.945) (25.606)** (25.713)**
Note: See Table 2 for the notation of the independent variables. 79
result suggests that a depreciation of Asian currencies against the dollar makes the products in the export-oriented electrical machinery sector more competitive in international trade and thus increases FDI in those countries as production site for exports.
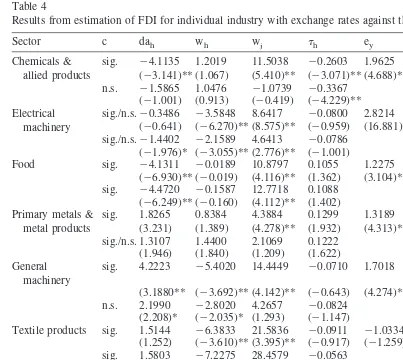
The effect of the exchange rates of the Asian currencies against the yen is presented in Table 4. A strong yen against these currencies especially the PPP rates, has a significant effect on an increase in outward FDI from Japan to the Asian countries in all sectors except textile and transportation machinery sectors. It is noteworthy that the significant effect of the nominal yen-Asian currency rate on FDI comes from the PPP component, rather than the real exchange rate changes.
The sectroal results on the wage rate variables are in general consistent with the ones for the aggregate. We find that wage rates both in host countries and in Japan have a significant impact on FDI in most sectors. A higher wage rate in Japan or a lower wage rate in host
Table 4
Results from estimation of FDI for individual industry with exchange rates against the yen
Sector c dah wh wj th ey py dy
Chemicals & allied products
sig. 24.1135 1.2019 11.5038 20.2603 1.9625 (23.141)** (1.067) (5.410)** (23.071)** (4.688)**
n.s. 21.5865 1.0476 21.0739 20.3367 2.8898 21.1176 (21.001) (0.913) (20.419) (24.229)** (5.732)** (21.634) Electrical
machinery
sig./n.s.20.3486 23.5848 8.6417 20.0800 2.8214 (20.641) (26.270)** (8.575)** (20.959) (16.881)**
sig./n.s.21.4402 22.1589 4.6413 20.0786 3.3625 2.2830 (21.976)* (23.055)** (2.776)** (21.001) (13.994)** (21.001) Food sig. 24.1311 20.0189 10.8797 0.1055 1.2275
(26.930)** (20.019) (4.116)** (1.362) (3.104)**
sig. 24.4720 20.1587 12.7718 0.1088 0.9550 1.7029 (26.249)** (20.160) (4.112)** (1.402) (2.060)* (2.657)** Primary metals &
metal products
sig. 1.8265 0.8384 4.3884 0.1299 1.3189 (3.231) (1.389) (4.278)** (1.932) (4.313)**
sig./n.s. 1.3107 1.4400 2.1069 0.1222 1.7379 1.0591 (1.946) (1.840) (1.209) (1.622) (3.873)** (3.386)** General
machinery
sig. 4.2223 25.4020 14.4449 20.0710 1.7018
(3.1880** (23.692)** (4.142)** (20.643) (4.274)**
n.s. 2.1990 22.8020 4.2657 20.0824 2.8181 0.2264 (2.208)* (22.035)* (1.293) (21.147) (9.713)** (0.769) Textile products sig. 1.5144 26.3833 21.5836 20.0911 21.0334
(1.252) (23.610)** (3.395)** (20.917) (21.259)
sig. 1.5803 27.2275 28.4579 20.0563 21.5745 0.7456 (1.250) (23.771)** (3.827)** (20.522) (21.700) (0.579) Transportation
machinery
n.s. 26.0393 4.7542 22.2446 20.0502 20.1576 (23.104)** (3.155)** (20.402) (20.450) (20.185)
n.s. 25.8236 5.4783 212.6261 20.1647 1.2187 23.2059 (23.153)** (3.808)** (21.970)* (21.571) (1.309) (22.493)* Other sig. 0.3774 22.9348 11.0007 20.0804 1.4584
(0.700) (26.303)** (9.534)** (21.506) (5.986)**
sig. 0.2875 22.8849 10.9555 20.0876 1.4434 1.4025 (0.470) (25.303)** (6.570)** (21.580) (4.893)** (3.369)**
countries significantly attracts Japanese firms to make FDI in Asia. The result supports the traditional argument that labor cost differential is a main determinant of FDI.
The effect of import tariff on FDI is insignificant in most sectors. However, in sectors where the tariff rate variable is significant, the tariff has a negative impact on FDI with exception being the food sector. These results suggest evidence that the Japanese FDI in Asia is not motivated to by-pass trade barriers.
The results in Tables 3 and 4 also show that the productivity differential is significant in FDI in most sectors but the direction of the effect varies across the sectors. A higher productivity of Japan relative to that of host country, i.e., a lower dah, would significantly increase FDI in chemicals, electrical machinery, food and transportation machinery sectors. This may provide evidence that Japanese FDI in those sectors is attributed to transfer of the Japanese high productivity and technology to the host countries. However, the productivity differential has a contrasting effect on FDI in metals and general machinery sectors. That is, a higher productivity of host country relative to Japan significantly induces FDI, indicating that FDI in those sectors is mainly to take advantage of a lower unit production cost.
Results from this study have some policy implications. Since a significant portion of exports of Asian countries is by Japanese subsidiaries, a policy of attracting Japanese FDI may be closely linked to export promotion as well as job creation. Our study suggests that stable wage rates and appropriate management of exchange rates are essential in order to attract Japanese investment. For example, when the yen becomes substantially weak against the dollar, keeping their currencies pegged to the dollar and the resulting appreciation against the yen would hinder Japanese FDI inflows into those countries. Also, an overvalued Asian currency against the dollar has a significant negative impact on Japanese investment espe-cially in the export-oriented electrical machinery sector. In addition, this study provides evidence that a reduction of protectionism by decreasing import tariff rates may help induce Japanese FDI.
Results also suggest that, along with high labor cost in Japan, a strong yen against the dollar and against the Asian currencies would shift production activities to Asian countries away from Japan, which may have a negative impact on trade balance, production and employment in Japan.21
5. Conclusion
This paper examines the determinants of Japanese FDI in manufacturing in Asia, focusing on the role of various exchange rates along with wage rates, labor productivity differential and import tariff. The exchange rates that are considered are the yen per dollar, the Asian currencies per dollar, and the Asian currencies per yen; also for each exchange rate, the nominal rate, the PPP rate, and the change in real exchange rate (equivalently, the deviation from the PPP rate) are considered.
significant coefficients are all consistent with the prediction, i.e., an appreciation of the yen against the dollar and against the Asian currencies significantly increases FDI. These results for the aggregate manufacturing sector are in general consistent with those for each indi-vidual sector. The exchange rate between the Asian currency and the dollar, while not significantly affecting the aggregate sector, has a significant impact in some sectors such as the chemical and the electrical machinery sectors. Notably FDI in the electrical machinery sector, that is the most export-oriented, is significantly induced by a depreciation of the Asian currency against the dollar, especially the PPP rate.
The wage rate variables have a consistent impact at the aggregate level and in most sectors. As expected, an increase in the wage rate in Japan or a decrease in the wage rate in the host countries significantly increases FDI, suggesting that the investment is attracted by relatively cheap labor.
Results show that, even though the labor productivity differential is insignificant at the aggregate level, it has a significant effect on FDI in most individual sectors. However, the direction of the effect is contrasted across sectors. This may provide evidence that Japanese FDI in Asia is attributed to capitalize on the competitive advantage in technologies in some sectors (chemicals, electrical machinery and transportation machinery), but also to take advantage of an efficient production and thus a low unit production cost in some other sectors (metals and general machinery). The study also suggests that an increase in import tariff rates significantly decreases Japanese FDI in most sectors as well as at the aggregate level, implying that Japanese investment and production in Asia are not motivated primarily to by-pass protectionism of the host countries.
Notes
1. The yen appreciated against the currencies of Japan’s major trading partners, as shown in the increase in the nominal effective exchange rate of the yen by 57% between 1984 and 1988. During the same period, the yen appreciated against the dollar by 46%. Source: International Financial Statistics,IMF.
2. A survey by The Ministry of International Trade and Industry of Japan (MITI) shows that due to the strengthening of the yen from the beginning of 1993, the value of foreign direct investment sharply increased, particularly in manufacturing industries. See “The 6th Basic Survey of Overseas Business Activities” March 1997.
3. Source: Ministry of Finance of Japan. The figure for 1997 is for the first fiscal year (April through September).
4. See MITI (1999).
seven manufacturing workers in Thailand is employed by a Japanese firm and a fifth of Malaysia’s manufacturing jobs in the 1990s are at Japanese companies.
6. In her paper, the expected rate was proxied with lagged and leading percentage change in the yen/dollar exchange rate.
7. The study includes different types of transactions such as mergers and acquisitions, equity increases, real estate, new plant, joint ventures and plant expansion.
8. The ratio of export sales to the total sales of Japanese subsidiaries in Asia for electrical machinery industry is over 70% in 1997 and 1998, which is the highest among all manufacturing industries.
9. The notion of the PPP rate being an equilibrium exchange rate is particularly important in long term investment decisions.
10. The Ministry of Finance of Japan began publishing FDI data in 1951. However, the data on FDI by country as well as by sector are available only from 1983.
11. The variables, wh, ej, eh, th, are not sector specific, i.e., ehi 5eh for all i. 12. See Greene (1993, Section 16.3).
13. Source: Ministry of Finance of Japan.
14. This data are based on notification rather than actual transfer. Since it is notification-based, there might be time lags between the submitted dates and the actual execution of FDI. However, the notification-based data are appropriate for this study because the timing of notification reflects the timing for firm’s decision to invest abroad. More-over, only the MOF data are disaggregated both by host country and by subsector. 15. Import duties include levies for import protection or revenue purposes, whether on a
specific or ad valorem basis, as long as they are restricted to imported products. See
World Development Indicators1999, World Bank.
16. A negative relationship between FDI and the exchange rates in empirical results could be driven by the fact that FDI is measured in dollars and exchange rates of the yen and the host country currencies per dollar are used as regressors. However, when FDI as a fraction of the Japanese output for each sector is used, the effects of exchange rates and other regressors are generally consistent with those when FDI is measured in dollars—the sign and the significance of the coefficients on ej, eh, ey,pj, ph,py, anddh are analogous.
17. To test the additional explanatory power of exchange rate variables in the presence of the other regressors, ax2 test based on the log-likelihood ratio is conducted. Results indicate that the inclusion of the exchange rate variables significantly increases the explanatory power at the 1% significance level.
18. The insignificance is not due to the muticollinearity between ejand eh. The correlation between the two is 20.014.
19. An estimate shows that the total export inducement effect was about $117 billion and $125 billion in 1995 and 1996, respectively. See MITI (1998).
20. Source: MITI (1999).
Acknowledgments
We thank Arindam Bandopadhyaya for valuable suggestions and comments.
References
Bank of Japan. (1993). Economic Growth in East Asia and the Role of Foreign Direct Investment. Nichigin Geppou(Monthly Report), December, 11– 46.
Bank of Japan,Keizai toukei geppo(Monthly Economic Statistics), various issues.
Blonigen, Bruce (1997). Firm-Specific Assets and the Link between Exchange Rates and Foreign Direct Investment.American Economic Review, 87,No. 3, June, 447– 465.
Caves, Richard, E. (1988). Exchange Rate Movements and Foreign Direct Investment in the United States, Harvard Institute of Economic Research Discussion Paper No. 1383.
Choi, Jongmoo, J. (1989). Diversification, Exchange Risk, and Corporate International Investment, Journal of International Business Studies, Spring 145–155.
Cushman, David (1985). Real Exchange Rate Risk, Expectations, and the Level of Direct Investment.Review of Economics and Statistics, 67,May, 297–308.
Economic Planning Agency of Japan. (1994). Change of Companies and Industries under the Appreciating Yen and Recent Recession, EPS, August, 192–201.
Economic Planning Agency of Japan,Kokumin keizai keisan(Annual Report on National Accounts), various issues.
Froot, Kenneth, A., & Jeremy C. Stein (1991). Exchange Rates and Foreign Direct Investment: An Imperfect Capital Market Approach.Quarterly Journal of Economics, 106,November 1986, 191–217.
Greene, William, H. (1993).Econometric Analysis,2nd ed., Macmillan, New York.
Hung, Juann, H. (1997). The Exchange Rate’s Impact on Overseas Profits of U. S. Multinationals,Journal of Economics and Business,439 – 458.
IMF,International Financial Statistics,various issues.
Klein, M. W., & Rosengren, E. (1994). The real exchange rate and foreign direct investment in the United States: relative wealth vs. relative wage effect.Journal of International Economics, 36,373–389.
Mann, C. L. (1993). Determinants of Japanese direct investment in US manufacturing industries.Journal of International Money and Finance, 12,523–541.
MITI of Japan. (1999).Quarterly Survey of Japanese Business Activities(Oct. - Dec. 1998), Tokyo.
MITI of Japan. (1998).Highlights of the 27th Survey of Overseas Business Activities of Japanese Companies, May 1998, Tokyo.
Ministry of Finance of Japan,Taigai Chokusetsu-toshi no Todokede Zisseki(Statistics of Notification of Overseas Direct Investment), 1971–1993, Tokyo.
Ray, Edward John (1989). The Determinants of Foreign Direct Investment in the United States: 1979 –1985, in Trade policies for International Competitiveness,Robert Feenstra, ed., 53–77.
Shapiro, A. (1992).Multinational Financial Management,4th ed., Allyn and Bacon, Massachusetts.
Yoshikawa, Hiroshi (1990). On the Equilibrium Yen-Dollar Rate,American Economic Review, vol. 80 No. 3, June, 576 –583.
United Nations (1997).International Trade Statistics Yearbook, New York.
Wakasugi, Ryuhei (1994).On the Determinants of Overseas production: An Empirical Study of Japanese FDI, Discussion Paper Series, Yokohama National University, April 1994.