Vol. 43 (2000) 295–318
The effect of organizational form on quality:
the case of franchising
Steven C. Michael
∗Department of Business Administration, University of Illinois-Urbana-Champaign, 350 Commerce West, 1206 S. Sixth Street, Champaign, IL 61820, USA
Received 16 September 1998; received in revised form 8 February 2000; accepted 23 February 2000
Abstract
The organizational form of franchising has been shown to yield higher profits and faster growth through reducing agency costs. Why then does anyonenotfranchise? In this paper I argue that the diffuse residual claims of the franchise system reduce overall system quality, and that this problem is inherent in the nature of franchising. The theory is tested by examining evidence from both the restaurant and the hotel industries, including chains that franchise and ones that own all of their units. In both industries, quality is negatively related to the percent franchising in the chain, controlling for size, growth in units, monitoring costs, market segment, ownership structure, multi-chain operation, and price. The results suggest that the franchise contract increases free-riding and decreases quality in decentralized service chains, and that quality is not contractible in this setting. © 2000 Elsevier Science B.V. All rights reserved.
JEL classification:L1; L2; L8; M3
Keywords:Quality; Organizational form; Franchising
1. Introduction
Franchising is an organizational form chosen by management in order to compete in industries in the retail trade and services sectors that require highly decentralized opera-tions at a chain of multiple sites. Unlike employees, franchisees invest their own capital and receive residual claims from a specific site rather than a salary. Existing research has explained franchising as a solution to the agency problem; franchising overcomes the moral hazard problem of site managers operating within a chain of dispersed units. Making site managers residual claimants reduces agency costs relative to using corporate employees.
∗Tel.:+1-217-265-0702.
E-mail address:[email protected] (S.C. Michael).
These conclusions present a puzzle for scholars of organizational form. Despite its ben-eficial effects, franchising does not have a monopoly on retail trade and services: as an organizational form, franchise chains have between a third and a half of industry sales where they compete, as Michael (1996) reports. Given that competition in organizational form is a well documented phenomenon (e.g. Armour and Teece, 1978; Michael, 1994), and that franchising in its present form has existed for almost 50 years, why has competition in organizational form not eliminated nonfranchising chains?
It is the contention in this paper that the franchise system, whatever its other advantages, cannot deliver the same high quality as a totally owned organization, and that this is inherent in the nature of franchising. Both theory and empirical evidence from two industries will be offered to support this conclusion. Section 2 reviews the literature on explanations of franchising, and its expected effect on quality. Section 3 presents the research design for the empirical estimation. Section 4 presents evidence from the restaurant industry. Section 5 presents evidence from the hotel industry. Section 6 concludes.
2. Explanation for franchising
Chains in industries that require highly decentralized operations at a chain of multiple sites require the services of site managers who are responsible for supervising the operation of the site. The chain can choose to use as site manager anemployee, who is paid a salary and perhaps a bonus. Alternatively, the chain can use afranchisee, who is granted through a contract for a particular site the stream of profits after all expenses have been paid, including a royalty to the franchisor. The franchisee site manager also invests his own funds in items necessary to open the site, including buildings and equipment. In return, the franchisor typically gives the franchisee services needed to open the unit, including training in a production process. After opening, the franchisor provides periodic inspection of the franchisee, access to trademarks, and marketing services.1
2.1. Franchising as a static solution to the agency problem
Rubin (1978) argued that the franchise relationship is superior to the employment rela-tionship as a solution to the agency problem of motivating site managers because franchising makes the franchisee-manager the residual claimant of operations at the site. Standard the-ory suggests that residual claimant status of an agent will induce greater effort and, in some cases, full effort in supervising. Rubin (1978) notes that the franchise contract divides tasks and associated residual claims to create incentives that promote efficiency for both franchisor and franchisee. Subsequently, different authors have stressed different aspects of these incentives, such as the division of revenue through royalties, the right to sell the unit, or the payment of quasi-rents. Lafontaine (1992) analyzes a large sample of franchise contracts and observes that the division of revenue between franchisee and franchisor (specifically royalty and franchise fee) adjusts to reflect the effort required of each. Lutz (1995) argues
that the right to sell the unit creates incentives. In her two-period model, the franchisee put forth more effort (although not a first-best level) than employees if first period effort today has a strong impact on future profitability. As the franchisee keeps the proceeds of selling the unit at the end of the second period, the franchisee can capture the return on effort in the first period, unlike an employee.2 Klein (1995) analyzes incentives created through quasi-rents. He argues that the brand name reputation of the chain can create a downward sloping demand curve and some pricing power. The franchisor can then afford to pay quasi-rents, amounts greater than that necessary to keep the franchisees in the con-tract. By paying quasi-rents, coupled with ongoing monitoring and potential termination, the franchisor motivates the franchisee to put forth effort.
Two streams of empirical work support the claim of franchising as a superior solution to agency. First, franchising yields superior operational outcomes, presumably because of higher effort from franchisees relative to employees. Shelton (1967) found that franchised units generally had higher profitability than owned units in the same chain. Norton (1988) showed, in an inter-state study, that franchised units have higher sales than nonfranchised units in certain industries. Krueger (1991) has shown that units managed by franchisees have lower payroll costs than units managed by employees, and he argues that this occurs because of the greater intensity of supervision that the franchisee performs. The effect on quality has not been previously examined, however.3
Second, monitoring costs, including the cost of physical travel, the legal and regulatory costs of termination, and the cost of quasi-rents, affect the desirability of using franchisees relative to employees. Geographic distance increases the cost of monitoring, so franchisors sell to franchisees distant, overseas, or rural units while using employees in urban and suburban units, as shown in Brickley and Dark (1987) and Fladmoe-Lindquist and Jacque (1995). Making termination more costly through increased regulation makes employees more attractive (Brickley et al., 1991). And at least some franchisors do pay quasi-rents (as shown in Kaufmann and Lafontaine (1994) and Michael and Moore (1995)), to raise the cost of termination to the franchisee. The payment of quasi-rents has not been empirically linked to the choice of franchisee or employee, however.
2.2. Synergistic effects through dual distribution
Both theory and empirical work suggest that franchising is a superior solution to the agency problem, but observed practice of franchisors has shown that some use both em-ployees and franchisees, termed dual distribution. One explanation for dual distribution,
2Lutz’s model contains only one franchisee, so the result is not the outcome of a tournament. Also, externalities such as quality are not examined in her model.
consistent with the superior incentives of franchising, is that variation in monitoring cost due to site heterogeneity leads to the use of employees for some sites. But two authors have suggested that using a mix of employees and franchisees may be optimal, even with identi-cal sites. Both assume that either franchisees or employees are in general superior, but then identify synergistic effects of dual distribution. In the model of Gallini and Lutz (1992), franchising is assumed to be the better choice for any site, but franchisors may own some units to signal the profitability of the franchise concept. An empirical test by Lafontaine (1993) did not support the signaling model. Brown (1998) assumes that a tournament4 system of compensation might be superior to residual claimant status in inducing effort in the chain in the presence of monitoring costs and risk. In the chain’s tournament, employees compete to provide the highest level of effort relative to other employees, with promotion and an increased salary as the prize. Franchising is assumed inferior ex ante. However, demand for the ultimate product may require such a large number of site managers relative to higher posts in the chain that the tournament fails for lack of sufficient probability of promotion. Units are franchised in order to remove some site managers from the tournament and assure employees of an acceptable probability of promotion.
Finally, some authors have asserted that chains prefer to own units, but use franchisees to circumvent short run constraints on liquidity (Martin and Justis, 1993), knowledge of geo-graphic sites (Minkler, 1990), or demands on managerial time (Thompson, 1994). Dual dis-tribution is therefore a disequilibrium phenomenon. Empirical evidence has offered mixed support that chains are, in the short run, constrained, but no evidence supports that chains are moving toward total ownership of units (Martin, 1988; Dnes, 1996).
2.3. Effects on quality
With regard to quality, the franchisee, as the residual claimant of the business, would be expected to provide higher quality than a salaried employee if the higher costs of quality (both personal effort and other inputs) were exceeded by gains in unit profits deriving from a higher sales price or greater quantity sold due to high quality. The presence of an externality such as a trademark’s reputation for quality complicates the analysis. In the franchise chain, all units operate under a shared trademark, so individual effort to raise quality creates an externality problem, as customers transfer the goodwill that they associate with the quality of one outlet to others operating under the same trademark. Therefore, franchisees do not fully appropriate the gains from their investment in quality. This externality creates incentives for free-riding that are exacerbated by the residual claimant status of the franchisee.5 As
Caves and Murphy (1976, p. 577) note, “A franchisee who reduced the quality of the good or service he offers for a given price might increase his own profits, yet by disappointing buyers’ expectations he could reduce by a greater amount the net returns to the common intangible goodwill asset — maintained by the franchisor and used jointly by his other franchisees”.
4Lazear and Rosen (1981) and Rogerson (1989) present the tournament model.
In the absence of any controls other than residual claimant status, franchising would be expected to yield lower quality than owned units because of this free riding.6 Aware of
the risk of free-riding, franchisors supplement residual claimant status with monitoring of franchisees to assure quality. Franchisors use an extensive network of field representatives and other means to monitor franchisees on-site.7 Franchisees can be terminated by the franchisor if quality standards are compromised.
In summary, the proposition that franchisees may underinvest in an externality such as quality in the absence of monitoring is not controversial. But franchisors do invest consid-erable resources to monitoring, detection, and termination. Whether franchising, with its combination of residual claimant status and monitoring with the threat of termination, is more effective in inducing effort for quality than employment is the question the paper seeks to answer. The relationship of quality, free riding, and residual claimant status is examined in two industries after the methodology is described.
3. Empirical methodology
3.1. Research design
The empirical strategy is to estimate a cross-sectional regression equation of quality on the ratio of franchised units to total units in the chain and necessary controls. The equation is estimated on data from two service industries in which franchising is prominent, restaurants and hotels. This section discusses issues of specification and measurement that affect estima-tion in both industries. First, previous franchising research has typically pooled franchising chains across multiple industries, and used variation in percent franchising among chains that franchise to test theory. By contrast, this study compares franchising in two industries with nonfranchising competitors. The analysis of specific industries controls to some extent for variation in competitive conditions and production and monitoring technology, at the cost of smaller samples, while allowing for different coefficients of the independent vari-ables. The use of two industries gives further validity. By including nonfranchising chains, this dataset compares firms that do not franchise, franchise a little, and franchise a lot; by contrast, previous research has examined only the latter two categories.8
Second, should price be included? The models of Klein and Leffler (1981) and Milgrom and Roberts (1986) argue that price is a signal of quality, so price would not be an exogenous variable in an equation of quality and organizational form. Therefore, not including price makes the equation a reduced form estimation of quality on organization. Reduced forms
6Some might argue that a common practice in franchising, tying, eliminates the possibility of free riding on inputs. But free-riding on labor quality is a possible source of quality variation. In their analysis of the privatization of prisons, Hart et al. (1997) note that substituting low-quality labor generates the lower costs and lower service quality of private prisons. In an alternative threat of free-riding, similar to the argument in Holmstrom and Ricart I Costa (1986), the franchisee could redirect supervisory effort to activities such as operational efficiency (with low or no externality) and away from activities such as quality assurance (with high externality).
7Boe et al. (1987, p. 93ff) discuss franchisor quality inspection and training.
were estimated by Lafontaine (1995) with price as a function of organizational form, and Emmons and Prager (1997), with price and quality. But, if quality is determined subsequent to price, its omission could introduce bias. To allow for this possibility, both a reduced form (without price) and a simultaneous form (including price) are reported. A Hausman test is employed to see whether price and quality are simultaneously determined.
Third, the equation does not contain variables controlling for production technology.9 Some might argue that high-quality chains use more capital and less labor, and are therefore at less risk of free-riding.10 No data on production technology was available for firms in either industry in this study, but a number of controls were applied to reduce the threat to validity. First, as noted above, the study examines quality in industry context among competitors. Production technology is thus controlled to some extent by the characteristics of the product and the industry. Second, since higher capital investment in production technology would presumably require a higher price, the equation including price should control roughly for variation in investment. Third, even if technology enhances quality, one characteristic of franchising biases the empirical test against the research hypothesis. As noted above, previous research has argued that entrepreneurs turn to franchising in part to overcome capital constraints. Firms that choose not to franchise are likely to be capital constrained, and so have less to invest in equipment than franchised chains. So owned chains are less likely to be able to invest in quality through technology.
Fourth, the geographic configurations of chains may vary systematically in such a way as to introduce bias to the results. For example, if franchising chains choose to operate in locations with low repeat customers, while nonfranchising chains do not, then franchising chains exacerbate the externality problem through locational choice. But existing research cited above has found the opposite result: locations in rural areas, presumably with high repeat customers, are more likely to be franchised than owned. Therefore, franchising chains are more likely to take advantage of repeat customers to control free-riding, and, if bias is introduced, it is against the hypothesis of franchising’s negative effect on quality.11
Finally, in some cases two or more chains are owned by the same corporate parent. For example, during the period observed, the firm Manor Care, under its Choice Hotels umbrella, franchised the chains Rodeway, Comfort, Econo Lodge, Quality, and Clarion in the dataset. Within each dataset, controls are applied for the multi-chain parent.12
3.2. Empirical specification
A model of quality must employ controls drawn from previous research and agency theory. First, the bounded rationality of chain management and the intervening layers of
9Strictly speaking, the research should control for plasticity, the extent to which the production technology is vulnerable to agency problems (Alchian and Woodward, 1988). This is not just a question of labor/capital ratio; it depends on the extent to which the technology can be monitored. Satisfactory measures do not exist at present. 10Quality researchers Garvin (1988) and Berry (1995) argue that capital and labor are complements, not substi-tutes, for the provision of quality. If it is a complement, then more capital will require better labor, increasing the risk of free-riding, which I have hypothesized is more acute under franchising.
11The model does include a rough control for geographic dispersion. In addition, most of the chains have enough national presence to merit inclusion inConsumer Reports.
hierarchy might be expected to lead to control loss as the chain increases in size. There-fore, larger chains may have lower quality. Second, incentives for high quality are likely re-enforced in franchised units through a tournament as an additional compensation device. Both the business press and previous research have suggested that franchisees can supervise more than one unit effectively. Kaufmann and Dant (1996) argue that franchisors deliber-ately manage the process by which additional franchises are granted, rewarding ‘good’ franchisees with additional units. In the presence of quasi-rents, the opportunity to manage additional units is an incentive to franchisees to maintain quality. In a growing chain, this opportunity is quite valuable, and quality is likely to be high. In a chain with no growth, the incentive loses its value. Potential growth is also likely to motivate employees as well. Growing chains create a larger management structure and more prizes for the tournament. Therefore, for both employees and franchisees, continuing in a growing chain yields re-wards, increasing the effectiveness of monitoring. So expectations of chain growth should positively influence quality.
Finally, in addition to size and growth, the results of Brickley and Dark (1987) and industry practice suggest that geographic dispersion of units affects quality. Because inspection typically requires travel, a more dispersed chain is more costly to monitor. An examination of quality should include a proxy for the cost of monitoring; the usual measure has been geographic dispersion.
To summarize, the estimated equation is the following:
qualityi=β0+β1number of unitsi +β2percent franchisedi+β3
growthi +β4dispersioni+εi (1)
Theory suggests thatβ1<0,β2<0,β3>0, andβ4<0.
4. Evidence from restaurants
4.1. Data sources
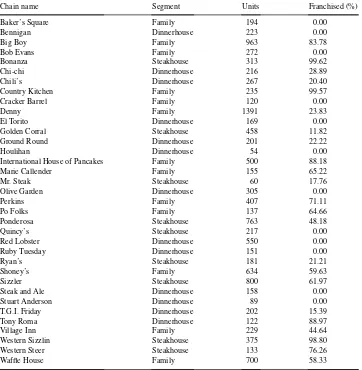
This part of the study examines quality among 35 chains in the ‘steakhouse’, ‘family’, and ‘dinnerhouse’ market segments of the restaurant industry. According to Nation’s Restaurant News (1995a,b), 66 chains compete in the identified segments with over 40 units, so we have over half of the population.
Table 1
The chains in the dataset-the restaurant industry
Chain name Segment Units Franchised (%)
Baker’s Square Family 194 0.00
Bennigan Dinnerhouse 223 0.00
Big Boy Family 963 83.78
Bob Evans Family 272 0.00
Bonanza Steakhouse 313 99.62
Chi-chi Dinnerhouse 216 28.89
Chili’s Dinnerhouse 267 20.40
Country Kitchen Family 235 99.57
Cracker Barrel Family 120 0.00
Denny Family 1391 23.83
El Torito Dinnerhouse 169 0.00
Golden Corral Steakhouse 458 11.82
Ground Round Dinnerhouse 201 22.22
Houlihan Dinnerhouse 54 0.00
International House of Pancakes Family 500 88.18
Marie Callender Family 155 65.22
Mr. Steak Steakhouse 60 17.76
Olive Garden Dinnerhouse 305 0.00
Perkins Family 407 71.11
Po Folks Family 137 64.66
Ponderosa Steakhouse 763 48.18
Quincy’s Steakhouse 217 0.00
Red Lobster Dinnerhouse 550 0.00
Ruby Tuesday Dinnerhouse 151 0.00
Ryan’s Steakhouse 181 21.21
Shoney’s Family 634 59.63
Sizzler Steakhouse 800 61.97
Steak and Ale Dinnerhouse 158 0.00
Stuart Anderson Dinnerhouse 89 0.00
T.G.I. Friday Dinnerhouse 202 15.39
Tony Roma Dinnerhouse 122 88.97
Village Inn Family 229 44.64
Western Sizzlin Steakhouse 375 98.80
Western Steer Steakhouse 133 76.26
Waffle House Family 700 58.33
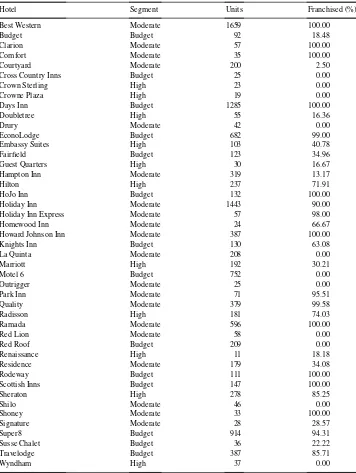
Table 2
The chains in the dataset-the hotel industry
Hotel Segment Units Franchised (%)
Best Western Moderate 1659 100.00
Budget Budget 92 18.48
Clarion Moderate 57 100.00
Comfort Moderate 35 100.00
Courtyard Moderate 200 2.50
Cross Country Inns Budget 25 0.00
Crown Sterling High 23 0.00
Crowne Plaza High 19 0.00
Days Inn Budget 1285 100.00
Doubletree High 55 16.36
Drury Moderate 42 0.00
EconoLodge Budget 682 99.00
Embassy Suites High 103 40.78
Fairfield Budget 123 34.96
Guest Quarters High 30 16.67
Hampton Inn Moderate 319 13.17
Hilton High 237 71.91
HoJo Inn Budget 132 100.00
Holiday Inn Moderate 1443 90.00
Holiday Inn Express Moderate 57 98.00
Homewood Inn Moderate 24 66.67
Howard Johnson Inn Moderate 387 100.00
Knights Inn Budget 130 63.08
La Quinta Moderate 208 0.00
Marriott High 192 30.21
Motel 6 Budget 752 0.00
Outrigger Moderate 25 0.00
Park Inn Moderate 71 95.51
Quality Moderate 379 99.58
Radisson High 181 74.03
Ramada Moderate 596 100.00
Red Lion Moderate 58 0.00
Red Roof Budget 209 0.00
Renaissance High 11 18.18
Residence Moderate 179 34.08
Rodeway Budget 111 100.00
Scottish Inns Budget 147 100.00
Sheraton High 278 85.25
Shilo Moderate 46 0.00
Shoney Moderate 33 100.00
Signature Moderate 28 28.57
Super8 Budget 914 94.31
Susse Chalet Budget 36 22.22
Travelodge Budget 387 85.71
on 198,000 meals consumed during 1991. Each chain was evaluated by at least 700 peo-ple. There is no reason to expect bias in the relative rankings of restaurants. Willingness to respond to a survey by an independent and prestigious organization such as consumer report (CR) does not obviously correlate with a preference for one restaurant over an-other. Also, CR checks their quality ratings to assure that ratings do not differ due to demographic or other characteristics of the raters. Tellis and Wernerfelt (1987) and Caves and Greene (1996), among others, have used CR ratings for analysis and found no ev-idence of bias. Using ratings by customers also satisfies a key principle of quality re-search: quality is defined by the customer, not the firm (Garvin, 1988, p. 24; Berry, 1995, p. 32ff).14
The primary independent variables are the size and ownership structure of the chain. The number of units was stated in the CR article. The ownership structure was measured as the ratio of the number of units owned and managed by franchisees (franchised units) divided by the total number of units in the chain, both franchised and corporate owned. This ratio is termed the percent franchised. This ratio was not listed in the original CR article. Instead, it is taken from franchising publications such asEntrepreneur magazine (the source for most franchising data used in research, including Lafontaine (1992)), theSource Book of Franchising Opportunities, andFranchise Annual(Franchise Annual, 1992). The percent franchised was observed during 1991.15
Presumably franchisees and employee-managers must forecast the potential for future growth as they choose how much effort to devote to site monitoring. Potential is not di-rectly measurable with secondary data, so I substitute the past growth rate, the annualized growth rate of units over the past 3 years, taken from Restaurant Business (1992). The past is a simple and intuitive, although not perfect, measure of future prospects. It is a forecasting model of growth potential that franchisees and employees can easily use. Also, the data required are available at low cost through the franchise marketing information, public sources, or internal documents. A second measure will be used as a robustness check.
To control for monitoring costs, geographic dispersion of units is used. The number of regions in which the chain operates is counted, with seven regions across the US, measured by CR. High dispersion makes monitoring more costly.
14One reviewer inquired how CR can measure quality without providing a standard for comparison. Quality researchers such as Boulding et al. (1993) have found that, when assessing quality, the standard customers use is the ‘expected’ experience with the product, primarily shaped by previous experience with the product. For example, the customer assesses quality by comparing the actual dining experience at Shoney’s with an expected experience formed from prior Shoney’s experiences. Such expectations will of course vary among customers, but that variation introduces only noise but not bias into the measure of the dependent variable of quality, for which the regression techniques to be employed control.
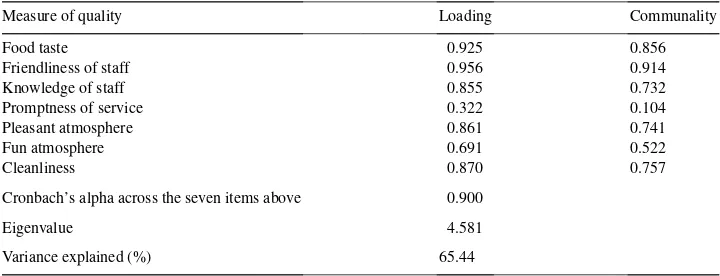
Table 3
Factor analysis of measures of restaurant qualitya
Measure of quality Loading Communality
Food taste 0.925 0.856
Friendliness of staff 0.956 0.914
Knowledge of staff 0.855 0.732
Promptness of service 0.322 0.104
Pleasant atmosphere 0.861 0.741
Fun atmosphere 0.691 0.522
Cleanliness 0.870 0.757
Cronbach’s alpha across the seven items above 0.900
Eigenvalue 4.581
Variance explained (%) 65.44
aThe second eigenvalue was 0.691.
4.2. The measurement of quality
To reduce the measures of quality to a single variable, factor analysis is employed.16
Factor analysis is a tool for discerning patterns when several variables combine to measure an underlying construct. As noted above, nine measures of quality measured on a five-point Likert scale were observed, but all of these are not necessarily under the control of the site manager. To determine which are under the site manager’s control, the general managers of two local units of different chains in the study were interviewed. One unit was franchised and one was franchisor-owned. Both agreed that only seven of the measures of quality in the article were under their control: food taste, friendliness of service, staff knowledge, prompt-ness of service, pleasant atmosphere, fun atmosphere, and cleanliprompt-ness. These measures are controlled by managers through direct supervision, hiring, training, and compensation. Of the two other measures, menu selection is not under the control of the site manager since menus are chosen by the chain headquarters as part of the restaurant concept. Level of noise is a characteristic of interior design, also usually chosen by headquarters.
Factor analysis is performed using iterated principal factors.17 The results of this pro-cedure are reported in Table 3. The single factor model explained 65% of the variance in the measures. Using the criterion of eigenvalues greater than one, only one factor emerged from the analysis. All of the measures load with the same positive sign on the single factor, confirming the interpretation of the factor as quality. Cronbach’s alpha of 0.90 is highly satisfactory, indicating the reliability of the factor to capture the measures. Loadings and communalities were high for all variables except promptness; the loading for promptness was 0.32. I estimate factor scores from the analysis. Hereafter, quality refers to the factor score for each restaurant.
16See Caves and Williamson (1985) and Mayers and Smith (1988) for examples of factor analysis. A detailed treatment is in Nunnally (1978). Cronin and Taylor (1992) used the same method for analyzing quality data, and found a single factor as well.
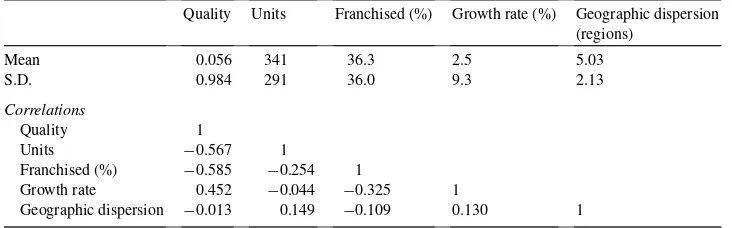
Table 4
Descriptive statistics of the restaurant variables
Quality Units Franchised (%) Growth rate (%) Geographic dispersion (regions)
Mean 0.056 341 36.3 2.5 5.03
S.D. 0.984 291 36.0 9.3 2.13
Correlations
Quality 1
Units −0.567 1
Franchised (%) −0.585 −0.254 1
Growth rate 0.452 −0.044 −0.325 1
Geographic dispersion −0.013 0.149 −0.109 0.130 1
Some might argue that consumers might confuse publicity or presence with quality. To crudely test for this, bivariate correlations between quality and advertising (taken from Leading National Advertisers, 1991) and quality and size are run. There is no correlation between advertising and quality in this dataset, suggesting that publicity is not driving quality. Second, the correlation between size and quality (as reported in Table 4) is negative, suggesting that presence is not driving quality.
4.3. Results
I regress quality on the number of units in the chain, the ratio of franchised units to total units, chainwide growth in units, and geographic dispersion, as described in Eq. (1). Conflicting considerations affected the choice of the functional form of the number of units in the chain. Theory would suggest a linear specification: as size grows, bounded rationality would presumably cause loss of control at a linear, or even faster, rate. But the range of the data for size is quite large — the number of units in the chain range from 60 to 1300. The natural log specification can reduce the effect of outliers. Both are reported.
Means, standard deviations, and correlations of variables are in Table 4.
In addition to the above variables, indicators are included to allow for different means of quality across the three segments (family restaurants, dinnerhouses, and steak restaurants) included in the study. Regression estimates of the quality model are reported in Table 5.
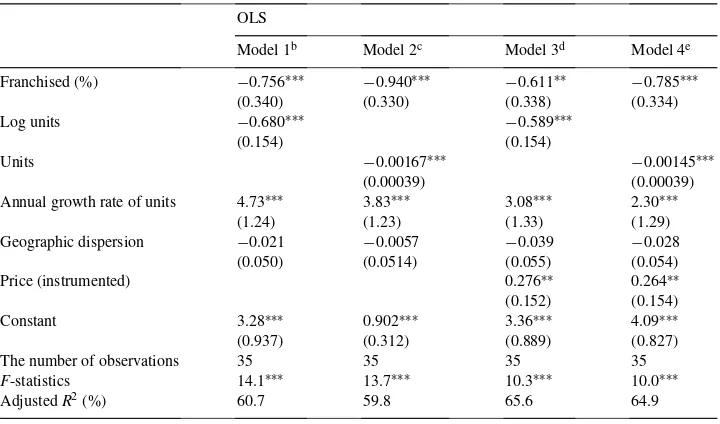
The first two columns of Table 5 report the reduced form estimate of quality, using both level and log of chain size. The equations are significant with adjustedR2near 60%. Diagnostics suggested no heteroskedasticity or multi-collinearity. Theory predicted that franchising, by diffusing residual claims, would lower quality, hence a negative coefficient is expected. As theory predicts, percent franchising has a negative and significant coefficient. Free-riding appears to rise with franchising.
Table 5
Influences on quality — the restaurant industrya OLS
Model 1b Model 2c Model 3d Model 4e Franchised (%) −0.756∗∗∗ −0.940∗∗∗ −0.611∗∗ −0.785∗∗∗
(0.340) (0.330) (0.338) (0.334)
Log units −0.680∗∗∗ −0.589∗∗∗
(0.154) (0.154)
Units −0.00167∗∗∗ −0.00145∗∗∗
(0.00039) (0.00039)
Annual growth rate of units 4.73∗∗∗ 3.83∗∗∗ 3.08∗∗∗ 2.30∗∗∗
(1.24) (1.23) (1.33) (1.29)
Geographic dispersion −0.021 −0.0057 −0.039 −0.028
(0.050) (0.0514) (0.055) (0.054)
Price (instrumented) 0.276∗∗ 0.264∗∗
(0.152) (0.154)
Constant 3.28∗∗∗ 0.902∗∗∗ 3.36∗∗∗ 4.09∗∗∗
(0.937) (0.312) (0.889) (0.827)
The number of observations 35 35 35 35
F-statistics 14.1∗∗∗ 13.7∗∗∗ 10.3∗∗∗ 10.0∗∗∗
AdjustedR2(%) 60.7 59.8 65.6 64.9
aS.E. is in parentheses under coefficient estimate. bReduced form of quality and franchising, units in logs. cReduced form of quality and franchising, units in levels.
dSimultaneous estimation of quality and franchising including price, units in logs. eSimultaneous estimation of quality and franchising including price, units in levels. ∗∗Significance level is 10% in two-tailed tests.
∗∗∗Significance level is 5% in two-tailed tests.
techniques cannot establish causality, so the speculation cannot be formally rejected. But two checks are performed. A Hausman test (Hausman, 1978) fails to reject the hypothesis of exogeneity of growth, so quality and growth are not determined simultaneously. Second, I used an alternative measure of growth. From Nation’s Restaurant News, I have taken the size of the chain in 1995, three years after the CR article, and computed ‘future’ growth (relative to 1992). I then regressed future growth on past growth and dummies for industry sector, and used the fitted values in Eq. (1). This exogenous alternative measure of the site manager’s forecast of future growth also has a positive and significant coefficient. However, further research on the relationship of quality and growth is suggested.
Among the other controls, the coefficient of geographic dispersion of the chain is negative, as theory suggests, but not significant. In an equation not reported here, an alternative measure for geographic dispersion was employed; an indicator variable was coded 1 if the restaurant chain operates nationally, 0 otherwise. Its coefficient was also insignificant. The market segment indicators are not significant, thus suggesting that quality does not vary based on segment within the restaurant industry.
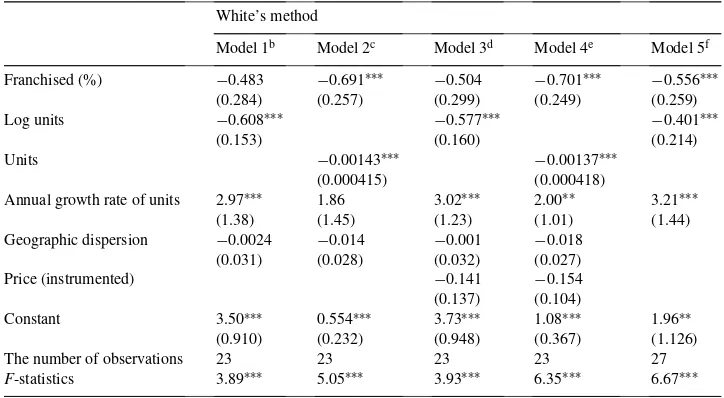
Table 6
Influences on quality — the restaurant industry, organizational variantsa White’s method
Model 1b Model 2c Model 3d Model 4e Model 5f Franchised (%) −0.483 −0.691∗∗∗ −0.504 −0.701∗∗∗ −0.556∗∗∗
(0.284) (0.257) (0.299) (0.249) (0.259)
Log units −0.608∗∗∗ −0.577∗∗∗ −0.401∗∗∗
(0.153) (0.160) (0.214)
Units −0.00143∗∗∗ −0.00137∗∗∗
(0.000415) (0.000418)
Annual growth rate of units 2.97∗∗∗ 1.86 3.02∗∗∗ 2.00∗∗ 3.21∗∗∗
(1.38) (1.45) (1.23) (1.01) (1.44)
Geographic dispersion −0.0024 −0.014 −0.001 −0.018 (0.031) (0.028) (0.032) (0.027)
Price (instrumented) −0.141 −0.154
(0.137) (0.104)
Constant 3.50∗∗∗ 0.554∗∗∗ 3.73∗∗∗ 1.08∗∗∗ 1.96∗∗
(0.910) (0.232) (0.948) (0.367) (1.126)
The number of observations 23 23 23 23 27
F-statistics 3.89∗∗∗ 5.05∗∗∗ 3.93∗∗∗ 6.35∗∗∗ 6.67∗∗∗ aS.E. is in parentheses under coefficient estimate.
bReduced form of quality and franchising, units measured in logs. cReduced form of quality and franchising, units measured in levels.
dSimultaneous estimation of quality and franchising including price, units measured in logs. eSimultaneous estimation of quality and franchising including price, units measured in levels. fReduced form estimate of quality and franchising consolidating chains into parents. ∗∗Significance level is 10% in two-tailed tests.
∗∗∗Significance level is 5% in two-tailed tests.
for six of seven at levels ranging from 5 to 15% in a two tailed test. The control variables, units (or their logarithm) and growth, were also included; as predicted, the units coefficient was negative and the growth coefficient positive. Promptness was not fitted well by Eq. (1), and no variable was significant.
The third and fourth columns report a simultaneous specification including price in Eq. (1). Price is reported byConsumer Reportson a five-point Likert scale. A Hausman’s (1978) test confirmed that, in this data, price and quality were simultaneously determined, so price was instrumented and a fitted value added to the equations. The measures of price were, as expected, positive and significant, but percent franchising retained a negative and significant coefficient. Other results did not change.
The conclusions are also supported when organizational variants are considered. Table 6 reports results analyzing the 23 chains identified as franchisors (excluding the 12 nonfran-chising chains). Tests suggest that heteroskedasticity was present among the franchise-only subset, so these equations were estimated using the heteroskedastic-consistent method of White.
coefficients have P-values of 11% in a two tailed test in column 1. The control vari-ables have similar effects in the subset. Again the results are supportive that organiza-tional form matters for quality even among franchising chains. Interestingly, price fails to be significant in these equations. It suggests that the positive price–quality correlation theory would predict breaks down in the decentralized decision process that franchising creates.
To control for possible multi-chain issues, two steps were taken. TheDirectory of Cor-porate Affiliations(1992) was consulted to identify multi-chain parents within the dataset. Among the firms in the dataset, the ownership of two is unidentified, while 21 firms operated one chain each and six parents operated two chains each. According to the Directory, in five of the multi-chain parents, the parent operated each chain as peer organizations, divisions reporting to a common head. In only one case did a chain report to another chain (Quincy’s reported to Denny’s). To add this information to the model, an observation for each parent was computed for multi-chain parents. The total number of units was summed, the percent franchising and growth recomputed. A parent quality was computed as a weighted average by units of each chain. Eq. (1) was then re-estimated, and reported in column 5 of the table. The pattern of signs and significance of coefficients on all variables is unchanged. Second, an indicator was added to the chains owned by a parent (12 chains total), and added to the equation. In results not reported here, the variable was insignificant, while other results remained the same. So the negative effect of franchising exists independently of multi-chain ownership.
5. Evidence from hotels
5.1. Data and measures
For further supporting evidence, the hotel industry is examined. Franchising plays an important role in this industry too; about US$ 20 billion dollars and 39% of all sales in the hotel and motel industry occurs through franchise chains (Michael, 1996). The hotel industry has also been identified in previous research as an industry with mobile customers, in which the externality problem is likely to be most acute. The July issue of Consumer Reports (1994) reported on a survey of their members’ satisfaction with chain hotels. For a hotel to be included in the ratings, at least 200 responses were required; the overall ratings are based on 133,000 hotel stays. The survey covers 45 hotel chains such as Marriott, Days Inn, and Fairfield Inn. A complete list is in Tables 1 and 2. To capture differentiation in the industry, the survey divides the chains into three market segments of high-priced, moderately priced, and budget.18 Lodging Hospitality (1994) reports that, in 1994, there were approximately 60 high-priced, moderately priced, and budget hotel chains in the US, so the data analyzed in this paper covers 75% of the hotel chains.
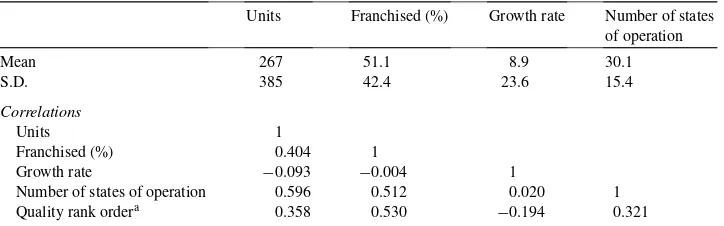
Table 7
Descriptive statistics of the hotel variables
Units Franchised (%) Growth rate Number of states of operation
Mean 267 51.1 8.9 30.1
S.D. 385 42.4 23.6 15.4
Correlations
Units 1
Franchised (%) 0.404 1
Growth rate −0.093 −0.004 1
Number of states of operation 0.596 0.512 0.020 1
Quality rank ordera 0.358 0.530 −0.194 0.321
aCorrelation with quality rank is Spearman rank order correlation; others are product moment correlations.
The empirical strategy is to estimate Eq. (1) with this data from the hotel industry. Quality is reported in this survey as a rank within segment for each chain;19 for example, Hotel A is ranked fifth in the budget segment. With a single rank for each chain, factor analysis is not required. In a sense, quality with regard to effort of unit managers is measured less precisely in this part of the study. Measurement error in the dependent variable increases the error term in the equation and makes rejecting the null hypothesis more difficult, but it does not threaten validity.
The independent variables are size of chain, percent franchising within the chain, and unit growth of the chain in the past 3 years. The number of states of operation is included to measure geographic dispersion. Data for the independent variables come from the American Hotel and Motel Association. Summary statistics are reported in Table 7.
Ordinary least squares should not be used with a dependent variable that takes rank order values because OLS assumes that variables are measured in cardinal units. Ordered probit regression is used instead. The technique is similar to ordinary probit in that an underlying score on a normal distribution is estimated as a linear function of the independent variables. The estimation produces both variable coefficients and a set of parameters that define ranges of the distribution within which the underlying score would fall in order to generate the observed rank. The probability of observing a certain rank corresponds to the probability that the function (plus error) falls within the range of threshold parameters for that rank. Greene (1993) describes the technique.
5.2. Results
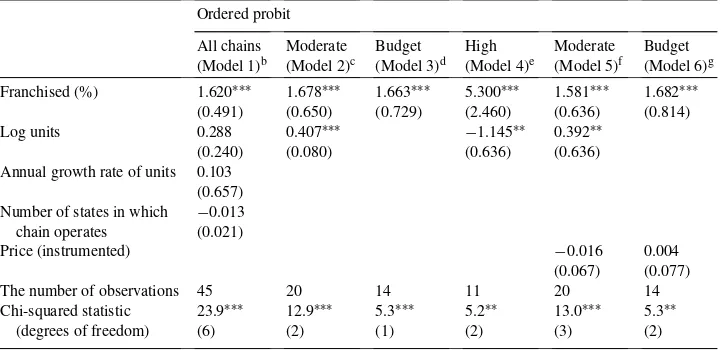
Table 8 reports the results of estimating Eq. (1) with the hotel data.
In interpreting the results, because the best hotel is ranked first, a variable that reduces quality can be expected to have a positive coefficient, in contrast to the restau-rant equations. Column 1 reports a pooled reduced-form analysis, containing the 45 hotel chains plus indicator variables for market segments. In this equation, the dependent
Table 8
Influences on quality — the hotel industrya Ordered probit
The number of observations 45 20 14 11 20 14
Chi-squared statistic 23.9∗∗∗ 12.9∗∗∗ 5.3∗∗∗ 5.2∗∗ 13.0∗∗∗ 5.3∗∗
(degrees of freedom) (6) (2) (1) (2) (3) (2)
aS.E. is in parentheses under coefficient estimate. In contrast to Tables 5 and 6, apositivecoefficient indicates a negative effect on quality through lowering the quality ranking.
bReduced form of quality and franchising, all chains. cReduced form of quality and franchising, ‘moderate’ segment. dReduced form of quality and franchising, ‘budget’ segment.
eReduced form of quality and franchising including price, ‘moderate’ segment. fSimultaneous estimation of quality and franchising including price, ‘moderate’ segment. gSimultaneous estimation of quality and franchising including price, ‘budget’ segment. ∗∗Significance level is 10% in two-tailed tests.
∗∗∗Significance level is 5% in two-tailed tests.
able contains three values of one, or three ‘firsts’, one for each market segment, three ‘seconds’, and so forth. The logarithm of size is employed; results with levels are sim-ilar. In a significant equation, the coefficient on percent franchising is positive as pre-dicted, indicating that franchising has a detrimental effect on quality. Other variables are insignificant.20
Being first in the budget segment may be different than being first in the moderately priced segment. To control for heterogeneity, the reduced form equation is estimated separately on each of the three market segments. Degrees of freedom grew scarce, so results are reported using only significant variables and significant equations. Columns 2–4 report the reduced form results for each segment. For the moderately priced segment shown in column 2, both size and percent franchising have a detrimental effect on quality as theory predicts. In column 3, results for the budget segment are reported: percent franchising has a positive coefficient, but others are not significant. In column 4, reduced form results for the higher-priced segment are reported. Again the coefficient on percent franchising is negative, but here a larger size chain has higher quality, counter to overall predictions. This could be an artifact of the small sample size. Alternatively, size may proxy for resources in this
market segment, and chains with more resources are able to devote more to training and monitoring.21
Columns 5 and 6 report a simultaneous specification including price in Eq. (1), using price as reported directly byConsumer Reports. A Hausman’s (1978) test confirmed that, in this data, price and quality were simultaneously determined, so price was instrumented and a fitted value added to the equations. The equations for moderate and budget segments show price to be insignificant in both equations, but percent franchising retains a positive and significant coefficient. Adding the fitted value of price to the equation reported in the column 4 for the high priced segment yielded an insignificant equation. This segment has the smallest number of observations, so more variables impose a higher cost in estimation. But overall the theoretical prediction that franchising lowers quality in hotels seems robust.
5.3. Organizational variants
Organizational variants such as multi-chain parents, the subset of franchising chains, and private versus public corporations are explored; none affected the basic conclusion of franchising’s negative effect on quality. The Directory of Corporate Affiliations (DCA) (1995) was consulted to determine ownership of chains by corporate parents. 42 of the chains could be identified; 19 were single chain organizations, while six organizations owned from two to six chains. For example, the private firm Drury owns only one chain (Drury Inn), while the public company Promus owns three chains (Embassy Suites, Hampton Inn, and Homewood Inn). Of the six multi-chain parents, the DCA listed three that organized each chain as a separate subsidiary or division, two that appeared to unify reporting of chains, and one that had some but not all of its chains as separate divisions. Also, of the 42 chains, 11 could be identified as owned privately while the others were owned by public companies. The baseline analysis of Eq. (1) is repeated, adding an indicator for whether the chain is owned by a public or private company, and results reported in the first column of Table 9. Indicators for market segments were included in all regressions. Percent franchised has the same positive and significant coefficient, indicating a negative effect of franchising on quality. Private has a positive and significant coefficient as well. Size, as measured by log units, has an insignificant coefficient, as does growth and dispersion. To preserve a consistent analysis, analyses using only the variables percent franchised, log units, and privately owned will be employed in further analysis.22 The second column reports the analysis repeated on the moderate market segment, the one for which the most observations are available. Here, size, percent franchising, and private each has a significant and negative effect on quality. The negative effect of franchising on quality persists even when only chains using franchising are examined. Reported in column 3, the coefficient on percent franchising is
21In this industry segment, an alternative organizational configuration exists: the franchisee owns, but the chisor operates, the hotel under a management contract. Free-riding is expected to be reduced, because the fran-chisor then shares in the gains created system-wide by use of good inputs. Management contracts are used primarily in the higher priced segment, and would be a valuable subject for future research.
positive and larger than the one for the dataset including owned chains (Table 8, column 1). Private is insignificant in this model; only two of the private chains franchised.
I examine effects of multi-chain ownership. In column 4, a variable is added measuring the number of chains owned by the parent. For example, the chain Hampton Inn has a value of 3, since its parent, Promus, owns Hampton, Homewood, and Embassy Suites. This variable is not significant, while percent franchising and private continue to have a negative effect on quality. Alternatively, the data are reanalyzed combining the chains into a single parent for analysis, and then run on the smaller dataset. Reported in column 5, percent franchising, size, and private have positive and significant coefficients. Results are the same when log (chains) or an indicator for a multi-chain parent are used. Therefore, it appears that franchising weakens quality controlling for multi-chain ownership.
Throughout the hotel data, franchising’s negative effect on quality persists. The lack of an effect regarding number of chains owned may suggest that most of these multi-chain parents manage each chain independently. The multi-divisional form may prevent control loss, at least as measured in the paper. These results suggest that incentives to provide quality are adequate for chain management, while incentives for unit management are not.
The significantly negative effect on quality by private ownership is surprising. In results not reported here, I added the private variable to the restaurant equations; its coefficient is insignificant. One possible explanation for the significance in only the hotel industry is that private hotel chains diffuse residual claims further. To finance real estate, private firms employ investment vehicles to allow for individuals to invest in a single property of the chain without managing it. Access to public capital markets may lessen the need for these investment vehicles.23
6. Discussion
This study explores in the setting of franchising the effect of contracting and residual claimant status on quality. In the restaurant industry, quality is shown to be negatively related to the percent franchising, controlling for size, growth in units, monitoring costs, market segment, ownership structure, multi-chain operation, and price. In a separate examination of the hotel industry, percent franchising is again shown to negatively affect quality, with similar controls.
The limitations of the data bear repeating. The relatively small sample and the industry-specific nature of the study suggest that further research on a larger scale should be under-taken to determine if the results hold more generally.24 Also, the study did not control for compensation packages in company-owned units. Franchisees clearly are residual claimants, but employee-managers of company-owned units may vary in their compensation from a fixed wage to a complex combination of wage, bonus, and pension. A future study might include such effects.
23The autobiography of Hilton (1957), who built his company privately, has many illustrations of the complexity of such deals.
I have answered the original question — why not franchise — by demonstrating that franchise chains have lower quality than owned chains. Before examining the implications, it is worth considering alternative explanations for the results. Better quality by owned chains may be driven by some aspect of human resources training or selection that is stricter on employees than on franchisees and as a result yields ‘better’ site managers. But the cost of terminating a franchisee is much higher than the cost of terminating an employee. The cost differential would suggest more careful training and selection of franchisees than corporate managers. Second, the research has not observed effort or free-riding directly; few studies have. If one believes that free-riding is not an issue in franchising chains, then these results suggest that franchisees use less effort that results in lower quality than hired managers, which contradicts existing empirical literature as well as agency theory generally. Lacking support from other causes, we return to the original theoretical explanation — low relative quality is an inevitable result of the allocation of residual claims linked to the decision to franchise — although further research, perhaps with time series data, would be valuable.
The empirical model assumes that ownership of each chain and of each of its sites has been chosen prior to operating decisions regarding quality (and consumers’ experiences of it). Logically, site and chain organizational form decisions must be made before operations can begin, so the timing of these decisions rules out a causality from quality to organizational form. But an unobserved factor affecting the choice to franchise may also affect the level of quality chosen. I am unaware of any theoretical argument for why high quality chains might choose not to franchise for reasons other than the incentive properties of franchising, but this cross-sectional study cannot rule out the possibility. So either a greater reliance on franchising leads to lower quality, or organizations with lower quality choose to franchise.25 The effect on competition is the same, however; the organizational form of franchising cannot deliver high quality.
But why would any chain choose an organizational form that must lead to lower quality? Two reasons are possible. First, relatively low quality in the long run does not matter if there is no long run. The competitive pressures in these retail trade and services industries may be so great on young firms that short term survival requires a compromise of long term position, especially if chains are heterogeneous in their initial resource endowments. Second, customers (or a significant portion of them) might find quality less important than other product or service attributes, such as cost or convenience. For example, franchising may allow the chain to grow larger and faster, as argued in Thompson (1994), yielding economies of scale that lead to lower prices. Or franchising may allow the chain to offer more locations in more dispersed regions, with more convenience to customers. In the long run, a heterogeneous population of customers might allow for at least two competitive positions or strategic groups (Caves and Porter, 1977). One employs franchising, with higher managerial effort and possibly faster growth, to achieve high penetration at a low but satisfactory quality level. The other employs ownership, offering higher quality but lower size, and presumably less convenience. Therefore, chain owners may choose franchising, with lower relative quality, in order to resolve agency. But, once franchised, a chain cannot costlessly change to fully owned; the typical franchise contract runs 20 years. Therefore, the allocation of residual claims may be an important mobility barrier in these industries.
If the organizational form of franchising does determine a competitive position, this im-plies an alternative direction for research. Rather than examining variation in the percent franchised among firms that franchise, insight into organizational form and product market competition might come from examining franchising by comparison to other organizational forms, a research design that has been far less common. Interaction between product mar-ket competition and internal organization is high on the research agenda, yet franchising research has avoided this direction. Franchising has been used as a testing ground to prove agency theory, rather than as a choice of organizational form with implications for market structure, performance, and welfare.
The results should be of interest to scholars interested in contracting as well. It has been asserted that it is difficult and costly, if not impossible, to specify quality completely and verifiably. When incomplete contracts are the crime, quality is the theorists’ first suspect. Results here do support their suspicions: contracting for quality is very difficult, if not impossible. The franchisors in the dataset are all large and successful companies, competing in a business where quality is an important dimension of competition, and engaging in what appears to be a well organized and well managed effort to monitor quality. Yet quality is lower. It is incorrect to say that monitoring is ineffective — it is unknown what quality would be in the absence of monitoring — but monitoring is not as effective as corporate ownership of units. If these efforts cannot assure quality, then it is unlikely that any firm can contract for quality.
The impact of organizational form on product market competition has implications be-yond franchising. For example, like franchising the multi-divisional corporation also exists to exploit an externality: shared resources across multiple lines of business. Case evidence of General Motors and IBM reported in Argyres (1995) suggests that high-powered in-centives such as near-residual claimant status for the managers of lines of business hurt development of shared resources. Further research can illuminate the relationship among quality, organizational form, and externalities.
Acknowledgements
Many thanks to Nick Argyres, Mike Ferri, Karin Fladmoe-Lindquist, Frank Hoy, John Miller, Ed Nelling, Carol Reeves, Scott Shane, Madhu Viswanathan, Brian Wansink, and two referees for helpful comments and advice. Many thanks for the kind cooperation of the American Hotel and Motel Association to permit access to their membership data. Thanks to Charles Daviet, Director of Survey Research and Information Services atConsumer Reports, for explaining the methodology of their quality surveys. Thanks to Tammy Dunbar, Michael Sands, and Gina Shreve for insight into restaurant management. Opinions and errors are the author’s alone.
References
Alchian, A., Woodward, S., 1988. The firm is dead long live the firm. Journal of Economic Literature 26, 65–79. Argyres, N.S., 1995. Technology strategy, governance structure and interdivisional coordination. Journal of
Armour, H.O., Teece, D.J., 1978. Organizational structure and economic performance: a test of the multidivisional hypothesis. Bell Journal of Economics 9, 106–122.
Berry, L.L., 1995. On Great Service: A Framework for Action. Free Press, New York.
Boe, K.L., Ginalski, W., Henward III, D.M., 1987. The Franchise Option. International Franchise Association, Washington, DC.
Boulding, W., Kalra, A., Staelin, R., Zeithaml, V.A., 1993. A dynamic process model of service quality: from expectations to behavioral intentions. Journal of Marketing Research 30, 7–27.
Brickley, J.A., Dark, F.H., 1987. The choice of organizational form: the case of franchising. Journal of Financial Economics 18, 401–420.
Brickley, J.A., Dark, F.H., Weisbach, M.S., 1991. The economic effects of franchise termination laws. Journal of Law and Economics 34, 101–131.
Brown, W.O., 1998. Transaction costs, corporate hierarchies, and the theory of franchising. Journal of Economic Behavior and Organization 36, 317–327.
Caves, R.E., Greene, D.P., 1996. Brands’ quality levels, prices, and advertising outlays: empirical evidence. International Journal of Industrial Organization 14, 29–52.
Caves, R.E., Murphy, W.F., 1976. Franchising: firms, markets, and intangible assets. Southern Economic Journal 42, 572–586.
Caves, R.E., Porter, M.E., 1977. From entry barriers to mobility barriers. Quarterly Journal of Economics 91, 241–261.
Caves, R.E., Williamson, P.J., 1985. What is product differentiation, really? Journal of Industrial Economics 34, 113–132.
Cohen, J., Cohen, P., 1983. Applied Multiple Regression/Correlation Analysis for the Behavioral Sciences, 2nd Edition. Erlbaum (Lawrence), Hillsdale, NJ.
Consumer Reports, 1992. Best Meals, Best Deals. pp. 356–362. Consumer Reports, 1994. The Best Hotels. pp. 432–436.
Cronin, J.J., Taylor, S.A., 1992. Measuring service quality: a reexamination and extension. Journal of Marketing 56, 55–68.
Dnes, A.W., 1996. The economic analysis of franchise contracts. Journal of Institutional and Theoretical Economics 152, 297–324.
Domberger, S., Hall, C., Li, E., 1995. The determinants of price and quality in competitively tendered contracts. Economic Journal 105, 1454–1470.
Emmons III, W.M., Prager, R.A., 1997. The effects of market structure and ownership on prices and service offerings in the US cable television industry. Rand Journal of Economics 28, 732–750.
Fladmoe-Lindquist, K., Jacque, L.L., 1995. Control modes in international service operations: the propensity to franchise. Management Science 41, 1238–1249.
Franchise Annual, 1992. St. Catherine’s, Ont., various issues.
Gallini, N.T., Lutz, N.A., 1992. Dual distribution and royalty fees in franchising. Journal of Law, Economics, and Organization 8, 471–501.
Garvin, D., 1988. Managing Quality. Free Press, New York.
Greene, W.H., 1993. Econometric Analysis. Prentice Hall, Englewood Cliffs, NJ.
Hart, O., Moore, J., 1990. Property rights and the nature of the firm. Journal of Political Economy 98, 1119–1158. Hart, O., Shleifer, A., Vishny, R.W., 1997. The proper scope of government: theory and an application to prisons.
Quarterly Journal of Economics 112, 1127–1161.
Hausman, J.A., 1978. Specification tests in econometrics. Econometrica 46, 1251–1272. Hilton, C.N., 1957. Be My Guest. Prentice Hall, Englewood Cliffs, NJ.
Holmstrom, B., Ricart I Costa, J., 1986. Managerial incentives and capital management. Quarterly Journal of Economics 104, 835–860.
Kaufmann, P.J., Dant, R.P., 1996. Multi-unit franchising: growth and management issues. Journal of Business Venturing 11, 343–358.
Kaufmann, P.J., Lafontaine, F., 1994. Costs of control: the source of economicrents for McDonald’s franchisees. Journal of Law and Economics 37, 417–453.
Kim, J., Mueller, C.W., 1978. Factor Analysis: Statistical Methods and Practical Issues. Sage Publication, Beverly Hills, CA, pp. 7–14.
Klein, B., Leffler, K.B., 1981. The role of market forces in assuring contractual performance. Journal of Political Economy 89, 615–641.
Krueger, A.B., 1991. Ownership, agency, and wages: an examination of franchising in the fast food industry. Quarterly Journal of Economics 106, 75–101.
Lafontaine, F., 1992. Agency theory and franchising: some empirical results. Rand Journal of Economics 23, 263–283.
Lafontaine, F., 1993. Contractual arrangements as signalling devices: evidence from franchising. Journal of Law Economics and Organization 9, 256–289.
Lafontaine, F., 1995. Pricing Decisions in Franchised Chains: A Look at the Restaurant and Fast-Food Industry. NBER Working Paper 5247.
Lazear, E.P., Rosen, S., 1981. Rank order tournaments as optimum labor contracts. Journal of Political Economy 89, 841–864.
Lodging Hospitality, 1994. The Chain Report, p. 43ff.
Lutz, N.A., 1995. Ownership rights and incentives in franchising. Journal of Corporate Finance 2, 103–130. Martin, R., 1988. Franchising and risk management. American Economic Review 78, 954–968.
Martin, R., Justis, R., 1993. Franchising, liquidity constraints, and entry. Applied Economics 25, 1269–1277. Mayers, D., Smith, C.W., 1988. Ownership structures across lines of property-casualty insurance. Journal of Law
and Economics 31, 351–378.
Michael, S.C., 1994. Competition between organizational forms: mail order versus retail stores, 1910–1940. Journal of Economic Behavior and Organization 23, 269–286.
Michael, S.C., 1996. To franchise or not to franchise: an analysis of decision rights and organizational form shares. Journal of Business Venturing 11, 57–71.
Michael, S.C., Moore, H.J., 1995. Returns to franchising. Journal of Corporate Finance 2, 139–176.
Milgrom, P., Roberts, J., 1986. Price and advertising signals of product quality. Journal of Political Economy 94, 796–821.
Minkler, A.P., 1990. An empirical analysis of a firm’s decision to franchise. Economics Letters 34, 77–82. Nation’s Restaurant News, 1995a. NRN Top 100. p. 84ff
Nation’s Restaurant News, 1995b. NRN 2nd 100. p. 58ff.
Norton, S.W., 1988. Franchising, brand name capital, and the entrepreneurial capacity problem. Strategic Management Journal 9, 105–114.
Nunnally, J.C., 1978. Psychometric Theory, 2nd Edition. McGraw Hill, New York. Restaurant Business, 1992. New York, various issues.
Rogerson, W.P., 1989. Profit regulation of defense contractors and prizes for innovation. Journal of Political Economy 97, 1284–1305.
Rubin, P.H., 1978. The theory of the firm and the structure of the franchise contract. Journal of Law and Economics 21, 223–233.
Shelton, J., 1967. Allocative efficiency versus X-efficiency: comment. American Economic Review 57, 1252–1258. Tellis, G.J., Wernerfelt, B., 1987. Competitive price and quality under asymmetric information. Marketing Science
6, 240–253.