Economics Letters 66 (2000) 199–202
www.elsevier.com / locate / econbase
Corruption and inflation
*
Fahim A. Al-Marhubi
Sultan Qaboos University, College of Commerce and Economics, P.O. Box 20, Post Code 123, Al-Khoudh, Oman
Received 18 September 1998; accepted 20 April 1999
Abstract
This paper analyzes the relationship between corruption and inflation. Using alternative indicators of corruption, I find a significant positive association between corruption and inflation, even after controlling for a variety of other determinants of the latter. 2000 Elsevier Science S.A. All rights reserved.
Keywords: Inflation; Corruption
JEL classification: E31; E62
1. Introduction
During the last decade there has been considerable research on the macroeconomic consequences of corruption. Most of the academic literature on this subject has studied the effects of corruption on static efficiency, investment, and economic growth. Missing from recent discussions of corruption is any systematic analysis of the effects of corruption on inflation. This is surprising given the recent explosion of interest in the political-economy determinants of inflation.
There are a number of reasons why inflation and corruption may be linked. First, according to the theory of optimal taxation, governments may have a motive for creating inflation, so as to generate seigniorage. Tax evasion and tax collection costs may make it optimal for the government to rely on the inflation tax as a source of government revenue. Clearly, tax evasion and tax collection costs are likely to be greater in countries that are more corrupt. Second, businesses are likely to respond to corruption by going underground, thereby increasing reliance on the inflation tax. Third, corruption may also lead to capital flight, which shrinks taxable assets and income of those most able to meet government revenue requirements. Finally, by reducing revenues and increasing public spending, corruption may also contribute to larger fiscal deficits, which may have inflationary consequences for countries with less developed financial markets.
*Tel.: 1968-51-58-18; fax: 1968-51-40-43.
E-mail address: [email protected] (F.A. Al-Marhubi)
200 F.A. Al-Marhubi / Economics Letters 66 (2000) 199 –202
The impact of corruption on inflation is ultimately an empirical question. Drawing on the political economy approach to inflation, this paper provides evidence on the extent to which corruption
1 explains cross-country inflation differentials.
2. Methodology and data description
The significance of the inflation-corruption link is evaluated using the positive political-economy approach to inflation. This conceptual framework analyzes the underlying incentives and constraints faced by policy-makers in their strategic decisions regarding monetary policy. This literature has provided some important insights into the effectiveness of different pre-commitment devices in containing inflationary forces and the institutional and political factors that contribute to the development of inflationary pressures. Variables that have received the most attention in this literature are used as control variables. These include indicators of central bank independence and political
2
instability, the level of economic development, and openness of the economy. Dummy variables for Asia and Latin America are included to capture other elements determining inflation that are not captured in the analysis.
The analysis is based on cross-country data consisting of 41 countries for which data is available on four alternative indices of corruption. Ideally, measures of corruption would consist of objective evaluations that are comparable across countries and over time. Ideal measures such as these do not as yet exist. In their absence, indicators have been developed that are based on foreign businessmen and
3
international correspondents’ perceptions of corruption. The first two indicators are from Trans-parency International and are based on perceptions drawn mostly from people in multinational firms and institutions for the years 1988–92 and 1980–85, respectively. The third index is the Business International (BI) measure of corruption based on perceptions drawn from BI overseas correspondents in the years 1980–83. This indicator is taken from Mauro (1995). The last indicator is Mauro’s (1995) bureaucratic efficiency index. All indices range from 10 (no corruption) to 0 (maximum corruption). All remaining variables are averaged over the period 1980–95, except where otherwise noted. Inflation is measured as the logarithm of the average annual percentage change in the GDP deflator. The level of economic development is measured by per capita real GDP. Openness is measured by the ratio of imports and exports to GDP. All data were obtained from the World Development Indicators 1997 on CD-ROM. The index of central bank dependence is the turnover of central bank governors compiled by Cukierman et al. (1992).
3. Empirical results
Table 1 contains the results obtained from OLS estimation. Most of the coefficients have the expected signs, even though not all are statistically significant. All indicators of corruption enter the
1
To my knowledge, this is the first systematic cross-country analysis that relates indicators of corruption to inflation.
2
For models that argue for the inclusion of these variables and empirical evidence, see Lane (1997), Romer (1993), Cukierman (1992), and Cukierman et al. (1992).
3
F.A. Al-Marhubi / Economics Letters 66 (2000) 199 –202 201
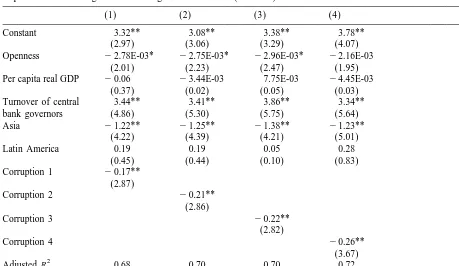
Table 1
a
Dependent variable: logarithm of average annual inflation (1980–95)
(1) (2) (3) (4)
Constant 3.32** 3.08** 3.38** 3.78**
(2.97) (3.06) (3.29) (4.07)
Openness 22.78E-03* 22.75E-03* 22.96E-03* 22.16E-03
(2.01) (2.23) (2.47) (1.95)
Per capita real GDP 20.06 23.44E-03 7.75E-03 24.45E-03
(0.37) (0.02) (0.05) (0.03)
Turnover of central 3.44** 3.41** 3.86** 3.34**
bank governors (4.86) (5.30) (5.75) (5.64)
Asia 21.22** 21.25** 21.38** 21.23**
(4.22) (4.39) (4.21) (5.01)
Latin America 0.19 0.19 0.05 0.28
(0.45) (0.44) (0.10) (0.83)
Adjusted R 0.68 0.70 0.70 0.72
Observations 41 41 41 41
a
Figures in parentheses are heteroscedastic-consistent t statistics. * and ** denote significance at 5 and 1%, respectively.
inflation equations with negative and significant coefficient estimates, suggesting that, other things 4
given, countries with more corruption experienced higher inflation. The prediction that more open economies and countries with more independent central banks will have lower inflation is also borne out by the regression results. Finally, the significantly negative estimates on the Asian dummy suggest that there are other variables determining inflation that are not fully captured in the analysis.
4. Conclusions
Corruption has been blamed for many poor macroeconomic outcomes such as low investment and slow growth. This paper has extended the list of negative consequences of corruption and argued that it is also partly responsible for high inflation. The empirical evidence presented suggests that higher corruption is associated with higher inflation. The relationship is robust to the inclusion of other determinants of inflation, including the degree of central bank independence, political instability, and other structural characteristics. From a policy perspective, the main implication of this finding is that reforming economic and political institutions to strengthen the rule of law and reduce corruption should be part of the agenda for any meaningful policy reform.
4
202 F.A. Al-Marhubi / Economics Letters 66 (2000) 199 –202
References
Bardhan, P., 1997. Corruption and development: a review of issues. Journal of Economic Literature XXXV, 1320–1346. Barro, R., 1991. Economic growth in a cross section of countries. Quarterly Journal of Economics 106, 407–443. Cukierman, A., 1992. In: Central Bank Strategy, Credibility and Independence: Theory and Evidence, Cambridge University
Press, Cambridge.
Cukierman, A., Edwards, S., Tabellini, G., 1992. Seigniorage and political instability. American Economic Review 82, 537–555.
Lane, P., 1997. Inflation in open economies. Journal of International Economies 42, 327–347. Mauro, P., 1995. Corruption and growth. Quarterly Journal of Economics, 110, 681, 712. Romer, D., 1993. Openness and inflation, Quarterly Journal of Economics CVIII, 869–903.