Sonia Destrie Pratidina, 2016
THE IMPLEMENTATION OF PEER ASSESSMENTAS A METHOD IN ASSESSING STUDENTS’
D ESCRIPTIVE TEXT
Universitas Pendidikan Indonesia | repository.upi.edu | perpustakaan.upi.edu CHAPTER III
RESEARCH METHODOLOGY
This chapter provides the methodology in conducting the research and description of research procedure in attempt to obtain the answers from research questions formulated in the first chapter. This chapter presents four main parts of the investigation: research design, research site and participants, data collection technique, and data analysis.
3.1 Research Design
This study was a qualitative research where the data in this research are non-numerical and then the data would be analyzed by non-statistical methods (Dornyei, 2007). It only involved a mixture of documents from recordings, transcription, and description.
The research was designed to describe and interpret a phenomenon; in this case, the phenomenon of the implementation of peer assessment and students‟ perception on the use of peer assessment as a method in assessing students‟ descriptive text. Thus, this method was used since this study did not search something or make prediction. It only described the situation or phenomenon. In addition, this research used a descriptive method in describing the findings of the data.
3.2 Research Site and Participants
Sonia Destrie Pratidina, 2016
THE IMPLEMENTATION OF PEER ASSESSMENTAS A METHOD IN ASSESSING STUDENTS’ D ESCRIPTIVE TEXT
Universitas Pendidikan Indonesia | repository.upi.edu | perpustakaan.upi.edu
and they also used peer assessment as one of the methods in assessing their English learning.
3.3 Data Collection
The data were collected through three instruments, namely observation, interviews, and questionnaire. Those instruments aimed to gain the data accurately. Each of these data collection techniques will be discussed below.
3.3.1 Observation
Observation was used to obtain the information in the classroom interaction where peer assessment was implemented in the classroom. The learning activities in the classroom were observed and identified. It includedfrom the stages in implementing peer assessment at the very beginning: the teacher informed the use of peer assessment, then the teacher outlined the objectives of the lesson, the teacher explained the materials, the teacher and the students set the criteria of assessment, and the students assessed their peers using peer assessment. Heigham and Croker (2009) explained that observation was the conscious noticing and detailed examination of participants‟ behaviour in a naturalistic setting. In addition, this technique was used to see the students in a naturalistic setting; classroom. The observation was conducted for three meetings as long as peer assessment was implemented in the classroom. The observation was videotaped in order to give thorough information and reduce the missed information.
3.3.2 Interviews
Interviewswere used to explore the teacher‟s and students‟ point of view to the implementation of peer assessment as a method in assessing students‟ descriptive text.This current study used semi-structured interviews which consisted of a series of questions to elicit specific answers from respondents. The questions of interviewswere in the form of open-ended questions. The open-ended interviews enabled researcher to compare the responses from the interviewees (Paton, as
Sonia Destrie Pratidina, 2016
THE IMPLEMENTATION OF PEER ASSESSMENTAS A METHOD IN ASSESSING STUDENTS’ D ESCRIPTIVE TEXT
Universitas Pendidikan Indonesia | repository.upi.edu | perpustakaan.upi.edu
teacher‟s and students‟ experience in implementing peerassessment in classroom.
The interviews were conducted by asking the participants personally in whom the
researcher asks and records the participants at a time (Creswell, 2008).The interviews would be conducted in respondents‟ first language, which is bahasa Indonesia.The interviews were conducted to the teacher and the students after the peer assessment had been implemented. The process of interviews was audiotaped and then it would be transcribed and analysed.The teacher and the students were interviewed to check the accuracy of the research and find some additional information. In relation, Linn and Gronlund(1995) stated that interview could clarify questions, pursue promising lines of inquiry, and give the interviewees an opportunity in qualifying or expanding their answers. Therefore,the interviews were done to support the data gathered from the observation.
3.3.3 Questionnaire
Sonia Destrie Pratidina, 2016
THE IMPLEMENTATION OF PEER ASSESSMENTAS A METHOD IN ASSESSING STUDENTS’ D ESCRIPTIVE TEXT
Universitas Pendidikan Indonesia | repository.upi.edu | perpustakaan.upi.edu Table 3.1 The Questionnaire Framework
No. Aspects Number Total
1. Students‟ personal feelings, attitude, drives, and goals.
Adapted from The Latticework for Students‟ Perception.
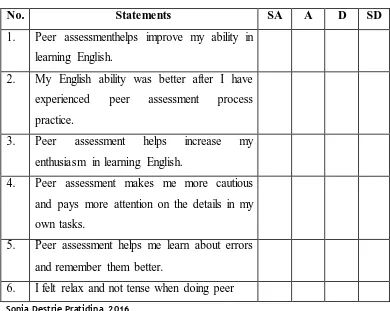
Table 3.2 Sample of Questionnaire
No. Statements SA A D SD
1. Peer assessmenthelps improve my ability in learning English.
2. My English ability was better after I have experienced peer assessment process practice.
3. Peer assessment helps increase my enthusiasm in learning English.
Sonia Destrie Pratidina, 2016
THE IMPLEMENTATION OF PEER ASSESSMENTAS A METHOD IN ASSESSING STUDENTS’ D ESCRIPTIVE TEXT
Universitas Pendidikan Indonesia | repository.upi.edu | perpustakaan.upi.edu
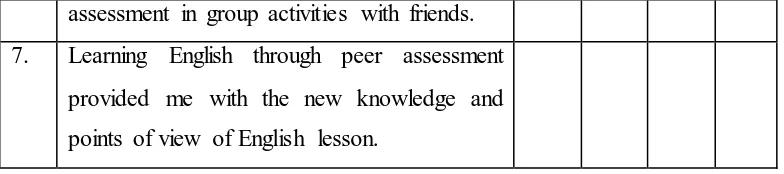
assessment in group activities with friends. 7. Learning English through peer assessment
provided me with the new knowledge and points of view of English lesson.
Adapted from, Puegphrom, P. &Chiramanee, T. Soc. Sci. & Hum. (2011). “The Effectiveness of Implementing Peer Assessment on Students‟ Writing Proficiency”. Social Science & Humanity Journals. 1-17
This study used four scales of Likert‟s scale, in order to avoid the neutral responses from the participant. Since a mid-point in the questionnaire will bring disadvantages; the researchers may not be collecting accurate responses (Losby& Wetmore, 2012). Each statement in the questionnaire consisted of values from 1 to 4 in which 4 is the most positive one. As regards, in answering the close-ended questionnaire, each participant should choose: „strongly agree‟, „agree‟, „disagree‟ or „strongly disagree‟ to each question provided. The data from the questionnaire were transferred manually into spreadsheet. The spreadsheet would be in the form below:
Table 3.3The Scoring System of The Questionnaires
Statements Strongly
Agree
Agree Disagree Strongly
Disagree
Positive 4 3 2 1
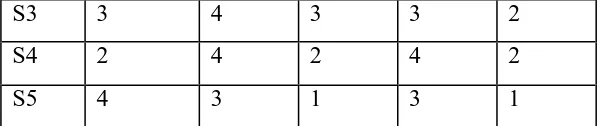
Table 3.4The Example of Coding Spreadsheet
Students Questionnaires
St. 1 St. 2 St.3 St.4 St. 5
S1 4 3 2 4 1
Sonia Destrie Pratidina, 2016
THE IMPLEMENTATION OF PEER ASSESSMENTAS A METHOD IN ASSESSING STUDENTS’ D ESCRIPTIVE TEXT
Universitas Pendidikan Indonesia | repository.upi.edu | perpustakaan.upi.edu
In the example above, it could be seen that Student 1 (S1) strongly agreed on statement 1 (St. 1) and on statement 4 (St. 4), agreed on statement 2 (St.2), disagreed on statement 3 (St. 3) and strongly disagreed on statement 5 (St. 5). On the other hand, Student 2 (S2) strongly agreed on statement 2 (St. 2), agreed on statement 1 (St. 1) and 4 (St. 4), disagreed on statement 3 (St. 3) and also strongly disagreed on statement 5 (St. 5). The same procedure was applied to the other responses of the students.
After all the data from the questionnairewere transferred into the spreadsheet, the data were checked once again in order to obtain accurate findings. Then, the tables or the graphics were set to display the data. As could be seen below:
Table 3.5The Example of Data Display (Table)
Statement 1:
Peer assessment membantusayadalambelajarbahasaInggris.
(Peer assessmenthelps improve my ability in learning English.)
Response Number of Respondents
Strongly Agree 6
Agree 22
Disagree 7
Strongly Disagree 0
Based on 35 respondents
S3 3 4 3 3 2
S4 2 4 2 4 2
Sonia Destrie Pratidina, 2016
THE IMPLEMENTATION OF PEER ASSESSMENTAS A METHOD IN ASSESSING STUDENTS’ D ESCRIPTIVE TEXT
Universitas Pendidikan Indonesia | repository.upi.edu | perpustakaan.upi.edu Chart 3.1The Example of Data Display (Graphic)
From the example above, it could be identified that the amount of students who have selected each statement was calculated. The calculation was in the form of combination. It was made from combination of strongly agree and agree which was called total agreement and combination of disagree and strongly disagree which was called total disagreement. For the statement 1 (S1), there were four students who strongly agreed and agreed, three students who disagreed and one student who did not give his respond. The sameprocedure was applied to the other statements.
3.4 Data Collection Procedure
In collecting the data, researcher employed several procedural steps as follow: a. First, observing the implementation of peer assessment in senior high school classroom by videotaping the learning situation and activities;
Sonia Destrie Pratidina, 2016
THE IMPLEMENTATION OF PEER ASSESSMENTAS A METHOD IN ASSESSING STUDENTS’ D ESCRIPTIVE TEXT
Universitas Pendidikan Indonesia | repository.upi.edu | perpustakaan.upi.edu
c. Third, collecting the data through interview based on the set of the implementation of peer assessment from teacher and students‟ view in the form of audio-taping;
d. Fourth, organizing, interpreting and analyzing the data obtained from interview; g.Fifth, writing the findings into a condensed body of information;
h. Sixth, deploying the questionnaires to the students;
i. Seventh, examining the data obtained from the questionnaires by finding out the frequency for each response item, calculating the percentage of each response and making a table that consists of the percentage;
j. Eight, analyzing and synthesizing the full condensed body of information into a description and constructing conclusion.
3.5 Data Analysis
The data gained from interview would be analysed descriptively. The analysis of collected data was conducted in several steps as follows:
3.5.1 The Analysis of Observation
First, videotapes from observation were transcribed. Then, the transcription of observation was analyzed. The analysis was based on the aspects related to the research questions. In addition, the information obtained was related to the implementation of peer assessment as a method in assessing students‟ descriptive text. It included the way of teacher in implementing peer assessment to her students and the way of students in rating their peers.
Sonia Destrie Pratidina, 2016
THE IMPLEMENTATION OF PEER ASSESSMENTAS A METHOD IN ASSESSING STUDENTS’ D ESCRIPTIVE TEXT
Universitas Pendidikan Indonesia | repository.upi.edu | perpustakaan.upi.edu
The final process of the observation was drawing conclusion. This process was made by perceiving all of the interpreted data into the generated pattern. Finally, the main outline that had been acquired was elaborated.
3.5.2 The Analysis of Interviews
First, the audiotapes of interviews were transcribed. Then, the transcribed were identified by reflecting the transcript. The process only focussed on the investigation aspect; the implementation of peer assessment as a method in assessing students‟ descriptive text. After that, the data were interpreted and discussed to get the main information. Finally, conclusions were drawing based on the data obtained.
3.5.3 The Analysis of Questionnaire
The data from the close-ended questions were calculated to get the percentage of how many students who strongly agreed, agreed, disagreed, and strongly disagreed to the statements in the questionnaires. In order to calculate the percentage of each aspect, the formula used as follows:
Percentage = Number of respondents who choose the answers (fo) x 100
Total respondents (N)
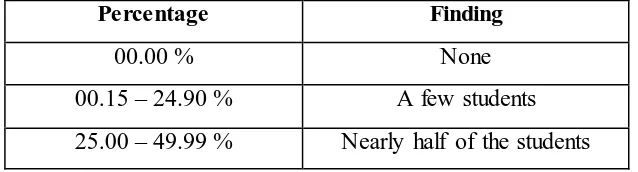
In interpreting each percentage, the framework from Suryadi (in Hamidah, 2005) was used:
Table 3.6The Framework of the Percentage Interpretation
Percentage Finding
00.00 % None
Sonia Destrie Pratidina, 2016
THE IMPLEMENTATION OF PEER ASSESSMENTAS A METHOD IN ASSESSING STUDENTS’ D ESCRIPTIVE TEXT
Universitas Pendidikan Indonesia | repository.upi.edu | perpustakaan.upi.edu
50 % Half of the students 50.01 – 74.99 % More than half of the students 75.00 – 99.99 % Nearly all of the students
100 % All of the students
The data showed whether students had positive or negative perception towards the implementation of peer assessment. After the data had been classified and labelled, the analysis continued into discussion and conclusion.
3.6 Concluding Remark