CHAPTER III
RESEARCH METHODOLOGY
This chapter covers the research methodology that is devoted to the
description of research design used in the research in order to find the answer for the
research problem which has stated in the first chapter of this paper. The description
includes the statement of research problem, research design, data collection, and
procedures for analyzing the data.
3.1 Research Problem
This research is implemented to find answer for the following questions:
1.3.1. What are the categories of teacher talk arisen in the English language
classroom?
1.3.2. What is the characteristic of interaction that occurs in the classroom as the
effect of teacher talk categories?
1.3.3. What are the students’ opinions on their teacher talk?
3.2 Research Design
This study was aimed at investigating the interaction in English as a foreign language
classroom. The subject of this study was specific to a classroom in which teacher talk
and her interaction with the students were observed and defined. Because of this
specification and small number of area, this study was categorized as a case study.
Zainal (2007, p.1) states that case study enables researcher to specifically examine
data from a very limited number of individuals as the subject of the study. This study
tried to provide descriptive answer from natural setting of classroom interaction in
which there were not any action or treatment to the study. This attempt was in line
phenomenon occurred in natural setting (Gomm, Martin, & Foster, 2000, p.4, Zainal,
2000)
This study was packed in descriptive form since the data gained of this study,
teacher talk and classroom interaction, were then described to search for the type of
teacher talk and the characteristics of classroom interaction through observation and
videotaping. This kind of form was employed to observe and describe the subject of
research without influencing it in any kind of way in order to reach the previously
mentioned aim of the research. Before describing the data, it was firstly calculated.
However, this attempt of data quantification is not the paramount as Gomm, Martin,
& Foster (2000) define that “quantification of data was not a priority. Indeed, qualitative data is treated as superior” (p.4).
For the additional information, this study also revealed the type of classroom
interaction in the English as a foreign language classroom by referring to Flanders
Interaction Analysis Categories. To answer the first research problem, an observation
sheet was used. In finding the students perception on their teacher talk, a
questionnaire is given to them. The last research problem was solved by employing
stage to stage method. They are were video-taping, coding, categorizing, and
analyzing.
3.3 Participant of the Research
The research was held in one of the vocational schools in Bandung. The school itself
was selected because it was accessible for the research in term of administration. The
participants of this study were a teacher and students of the third grader in which they
were studying English twice a week. The class was chosen due to its frequent
meeting in a week. This frequent meeting enabled the research to be conducted before
the school examination. This class was also selected because the third grader level
expectation in the curriculum was intermediate level in which teacher was expected
to reach the communicative objective. This academic characteristic was suitable with
classroom interaction characteristic. The class when study was held was in the first
semester of the academic 2014-2015.
3.4 Data Collection Method
This section is divided into two parts, instrumentation and procedure. Instrumentation
is the elaboration of some instruments used to gather data in order to answer the
research problems. After utilizing the instruments to collect data, the data were then
analyzed by following some procedures. The procedures in analyzing the data will be
described subsequent to the elaboration of instrumentation.
In this study Flanders’ Interaction Analysis Categories which has 10 categories of
teacher talk was employed. Identification of talk, coding, and categorizing were also
included in the analysis.
3.4.1 Instrumentation
Some instruments were used to gather data that was aimed to reach questions towards
the statement of problems. The questions would then lead to the attainment of the
research purposes. The instruments utilized in collecting data were observation sheet,
questionnaire, and videotaping that will be presented as follows.
3.4.1.1 Observation Sheet
To answer the first question, researcher made an observation sheet that was checked
in every meeting in the classroom to see the appearance of elements of teacher talk suggested by Flanders in Flanders’ Interaction Analysis Categories. This observation sheet was developed by adapting the Flanders elements of teacher talk which was
then elaborated and then checked if the elements existed or not in the teaching
process. In the end of the meeting, the tallies in each category in observation sheet
were then counted to see the quantity of teacher talk. Having obtained the quantity of
3.4.1.2 Questionnaire
Questionnaire was given to know more about the students’ perception on teacher’s talk referred to elements of teacher talk suggested by Flanders’ Interaction Analysis Categories. Questionnaire was developed by adjusting the statements with the categories of teacher talk in Flanders’ Interaction Analysis Categories. For example, the first and second statements in the questionnaire referred back to the teacher talk
category of accepting feelings. Students may decide if they strongly agree, agree,
disagree, or strongly disagree with the statements given in the questionnaire by
checking it. The check list was then analyzed by using Likert scale. The scale
response of Likert scale used in this questionnaire is the level of agreement. Wade
(2006) suggested the level of agreement in the Likert-Type scale response anchors
which were strongly disagree, disagree, neither agree or disagree (neutral), agree, and
strongly agree. The check list questionnaire consisted of 15 statements.
3.4.1.3 Videotaping
After getting the permission from the school to do the observation, the interaction in
the classroom started to be recorded to see the real phenomena of teacher and students’ interaction and how teacher used her/his talk. The videotaping was held for four meetings of English lesson in the classroom. Each meeting consisted of 2 hours
effective learning time (2x45 minutes).
The videotaping helped researcher avoid the missing of classroom interaction.
Grbich (Richards, 2003:115) affirmed that the detail of situation would need a
super-human memory or in the form of videotape. Therefore, Grbich (Richards, 2003:115)
also advised that all verbal talk to be recorded. Though the researcher was recording
the classroom interaction, the students and teacher interacted naturally as expected
and did not bother the teaching and learning process.
The study was aimed at investigating teacher’s talk, based on Flanders Interaction Analysis Categories (FIAC), students’ perception on their teacher talk, and the type of classroom interaction. Thus, to gain the answers of the research problems, the data
that has been obtained was analyzed by following procedure of the study. This
procedure consists of the elaboration of observation sheet calculation, videotaping
procedure in collecting data of classroom interaction and the analysis procedure of it,
and data processing gained from questionnaire.
3.4.2.1 Observation
As it has been described before, type of teacher talk will be observed through an
observation. Observation sheet was used to gather data of teacher talk in the
classroom by checking the elements of teacher talk that appeared in classroom. After
checking all the elements of teacher talk that emerged in the classroom, the
observation sheet was then processed by counting the tallies in every column of
categories. The calculation of tallies will be then described into words. The
observation sheet was checked in every meeting of classroom interaction observation.
The observation was held for four meetings.
3.4.2.2 Videotaping
Videotaping was employed to collect data of classroom interaction. The data were
analyzed to seek for the characteristic of classroom interaction. Videotaping was done
in four meetings of English language lesson. The table below shows the schedule of
videotaping based on the meetings of English as foreign language classroom in a
school as the place for research to be conducted.
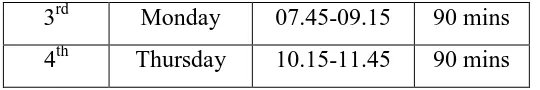
Table 3.1. Classroom Meeting
Meeting Days Hour Duration
1st Monday 07.45-09.15 90 mins
3rd Monday 07.45-09.15 90 mins
4th Thursday 10.15-11.45 90 mins
In Thursday, the schedule was actually three hours. However, teacher has
committed that the last hour is used to be the time for students practicing for the
national exam since the students are in their third grade. During the videotaping,
students and teacher acted naturally like they were studying as usual in every
meeting.
3.4.2.3 Questionnaire
Questionnaire was given to the students to find how they actually perceive their teacher talk which referred back to Flanders’ Interaction Analysis Categories (FIAC). Questionnaire was given in the last meeting of research and it was expected that all of
the students would come to the class so that it would be supporting more the findings
of teacher talk type.
3.5 Data Analysis
After conducting the study based on the procedures, the data has been gained. The
data gained were then analyzed by using some steps for each data collection method.
The following sub chapters present the elaboration of data analysis of each data that
has been gained.
3.5.1 Observation sheet tabulation
The observation sheet, which has been filled with tallies according to the appearance
of teacher talk categories suggested by Flanders, was then analyzed by counting the
number of tallies in each teacher talk categories. The following table displays the
example of tabulation of observation sheet.
Table 3.2. Observation Sheet Tabulation
1 Accepting
feelings
IIII
2 Praising and
Encouraging
3 Accepting or
using ideas
4 Asking
questions
5 Lecturing
6 Giving
direction
7 Authorizing or
justifying
authority
8 Students’
response
9 Students’
initiation
10 Silent periods
TOTAL
The percentage of each category was gained by dividing the number of tallies
in the category by the total number of tallies in all categories.
3.5.2 Videotaping
Videotaping was used to discover the characteristic of classroom interaction. The
videotaping would then be analyzed by following four steps of analysis, named
transcribing, coding, constructing the interaction matrix as suggested in FIAC, and
3.5.2.1 Transcribing
After the classroom interaction had been recorded, and then the recording was
transcribed. The recorded classroom interaction was transcribed as simple as possible
to make the analysis easier. When the teacher talked, the talk was labeled T as teacher
talk. When talk was possessed by a student, the talk was labeled by S. The talk of
more than one student was labeled Ss.
3.5.2.2 Coding
In analyzing classroom interaction, researcher needed to identify the categories of
teacher and learners talk from the transcription. The coding that researcher used was
based on the Flanders’ Interaction Analysis (FIAC). Below is the coding procedure
of classroom interaction. The coding process needed one coder outside the researcher.
Table 3.3. Coding Procedure for FIAC
Category
G: General Whenever there is an element of
doubt code to the prevailing
balance of teacher.
Rare events should be coded
whenever possible.
Categories of 1,2,3, and 9 are expected much less than 5, 6,7,
and 8.
1: Accept Feelings The code is for the situation when
teacher response to students’
grumbling or statement of
happiness to the learning or other
things.
repeats students answer. - Comparing it with other ideas
- Summarizing what student
has said
Code 3 more than once if
extended responses given
If teacher is making too much abstraction from students’ answer
or ideas then, code 5 is given. discussion then code 4 is given.
teacher:
6 & 7: Gives direction &
Criticized or Justifying Authority
Code 6 is used to indicate close supervision and direction by
teacher.
Code 6 is used for statements intended to produce compliance
from students.
If teacher gives announcements
then code 5 is given instead of
code 6.
Questions that is aimed at getting students’ compliance is coded as 6 e.g. “Could you turn off the projector?” or “Could anyone help me take my bag?”
8 & 9: Student Response &
Student Initiated
Making a choice between code 8 & 9 should related to the teachers’ preceding questions.
Pupil response can be for a closed or open teacher question
Code 8 is highly possible to turn into 9 if the students embellishes
made and independent judgment
about what the teacher has asked
or stated.
If there is any doubts use code 8 instead of 9.
Category 9 also used for students making target remarks (resistance
to compliance)
10: Silence or Confusion Pauses, short periods of silence,
and periods of confusion in which
communication cannot be
understood by the researcher.
Code 10 is also used when
students write what the teacher
has shown or do written exercises
from teacher
Adapted from:
(http://www.hebes.mdx.ac.uk/teaching/Research/PEBL/methpap6.pdf)
To help the researcher in coding the data, there are some rules related to the
coding procedure. The following are the rules:
1. If there are more than three categories in 3 second period, it should be noted
numerically farther from category 5 (category 10 is an exception).
2. The researcher should avoid including her own point of view.
3. If after 3 seconds, there are no changes in category, then it should be noted
with the same category numbers.
4. If the silent period exceeds 3 seconds, then it belongs to category 10.
6. When teacher repeats the student’s correct answers, then is noted as category
2 because it functions as encouragement or praises.
7. When teacher listen to a student and accepts his or her ideas to make a
discussion, then this belongs to category 3.
8. If teacher says “yes”, “ok”, “hmm”, or “alright”, it belongs to category no. 2.
9. When teacher jokes without making any expense on students, researcher
records it as category 2. However, if she or he makes joke over students then
it should be marked as category no.7.
10.When all students respond to the teacher, it belongs to category 8.
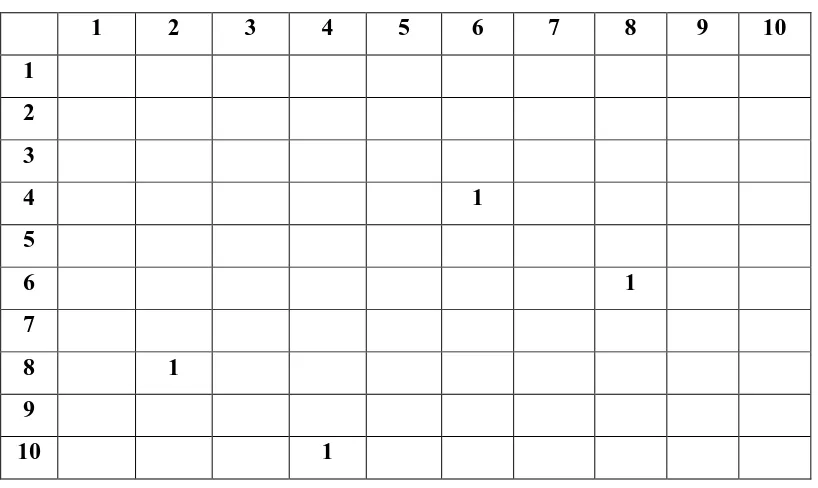
3.5.2.3 Constructing interaction matrix from the coded transcription
Before constructing the matrix from the coded data, it has to be organized firstly into
numbers as followed:
10 (category numbers)
1st pair
4
2nd pair
6
3rd pair
8
4th pair
2
The first pair showed the first tally on the matrix, and the second pair
represents another tally, etc. Then the tallies of the pair were put into the matrix.
matrix represents the first number of the pair while the column represents the second
number in a pair. The following figure is the example of interaction matrix.
Table 3.4. Interaction Matrix
1 2 3 4 5 6 7 8 9 10
1
2
3
4 1
5
6 1
7
8 1
9
10 1
Adopted from Flanders (1970) as cited in Nurmasithah (2010, p.59)
3.5.2.4 Analyzing the interaction matrix
If the matrix is in complete form, it can be seen that some areas of the matrix will
have more tallies than other areas. The area in the matrix shows the characteristic of
interaction in the classroom. Here is the division of the interaction characteristics.
Table 3.5. Characteristics of Classroom Interaction
1 2 3 4 5 6 7 8 9 10
1 TEACHER
SUPPORT
STUDENTS’
2
4 CONTENT
CROSS
5
6 TEACHER’
S
CONTROLL
PARTICIPATI
ON 7
8
9
10
Adopted from Flanders (1970) as cited in Nurmasithah (2010, p.59)
3.5.3 Questionnaire tabulation
Questionnaire that had been made was spread to 34 students in the classroom in order to seek for their perception on teacher’s talk. After getting back questionnaire from students, it was then tabulated by using Likert scale. Likert scale in this research was used to measure the perception of students on their teacher’s talk. Before giving questionnaire, researcher who wants to use Likert scale needs to make the measuring
so that there will not any ambiguities in defining the result of the questionnaire. There
are some steps of calculation in Likert scale. The following is the description of all
steps.
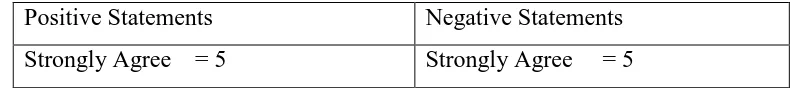
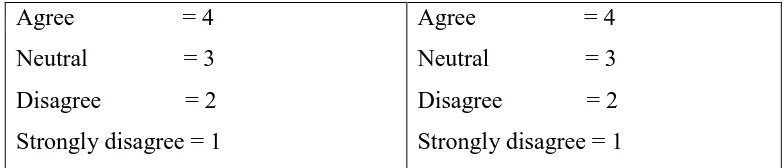
a. Scoring the statements
There were 5 responds for each statement that respondents could choose. The
table below shows the score for each statement in Likert scale.
Table 3.6. Likert Scale Statements Scoring
Positive Statements Negative Statements
The following is the example of statement in the questionnaire.
Table 3.7. Example of Statement Scoring
No
b. Defining the total score for each statement
This instrument was given to 34 students in the classroom, and then it was
recapitulated. From the 34 respondents, for example:
Response Strongly Disagree (1) = 0 student
Below is the way to calculate the score:
Total score of students’ response (5) = 5 x 25 = 125
Total score of students’ response (4) = 4 x 8 = 32
Total score of students’ response (3) = 3 x 1 = 3
Total score of students’ response (2) = 2 x 0 = 0
Total score of students’ response (1) = 1 x 0 = 0
Total = 160
The maximum score of statement no. 1 = 34 x 5 = 170
The lowest score = 36 x 1 = 36
c. Calculating the central tendency of the score
After getting the score of statement 1, then the central tendency each score is
calculated by using the formula suggested by Sudjana Sudjana (1984) as
cited in Nitiswari (2012, p. 39). The following is the formula.
P is the percentage that is intended to be found. Fo is the total score of
statement and N is the ideal highest value for the statement.
d. Classifying the average percentage N
The result that has been obtained from the formula, then is classified to know
the criteria of the statement.
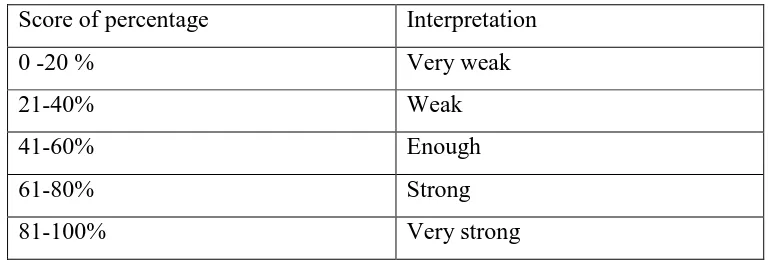
Here are the criteria that was suggested by Akdon (2008) in Nitiswari (2012,
pp. 39-40). After finding the criteria, interpretation was made based on the criteria resulted from the steps of calculation.
Table 3.8. Criteria of Likert Scale Statement
Score of percentage Interpretation
0 -20 % Very weak
21-40% Weak
41-60% Enough
61-80% Strong