IMPACT ASSESSMENT OF MIKANIA MICRANTHA ON LAND COVER AND
MAXENT MODELING TO PREDICT ITS POTENTIAL INVASION SITES
Tina Baidar a, Anu Bhalu Shrestha a, Rita Ranjit b, Ruby Adhikari c, Subash Ghimire d, Nawaraj Shrestha d a Survey Department, Nepal - [email protected] , [email protected]
b
Technical Resources International Inc, USA - [email protected] c Nepalese Army, Survey Mahasakha, Nepal - [email protected] d
Department of Civil and Geomatics Engineering, Kathmandu University, Nepal - [email protected], [email protected]
KEY WORDS: Mikania micrantha, Invasive Species, Chitwan National Park, Image Classification, Maxent Modeling
ABSTRACT:
Mikania micrantha is one of the major invasive alien plant species in tropical moist forest regions of Asia including Nepal. Recently, this weed is spreading at an alarming rate in Chitwan National Park (CNP) and threatening biodiversity. This paper aims to assess the impacts of Mikania micrantha on different land cover and to predict potential invasion sites in CNP using Maxent model. Primary data for this were presence point coordinates and perceived Mikania micrantha cover collected through systematic random sampling technique. Rapideye image, Shuttle Radar Topographic Mission data and bioclimatic variables were acquired as secondary data. Mikania micrantha distribution maps were prepared by overlaying the presence points on image classified by object based image analysis. The overall accuracy of classification was 90% with Kappa coefficient 0.848. A table depicting the number of sample points in each land cover with respective Mikania micrantha coverage was extracted from the distribution maps to show the impact. The riverine forest was found to be the most affected land cover with 85.98% presence points and sal forest was found to be very less affected with only 17.02% presence points. Maxent modeling predicted the areas near the river valley as the potential invasion sites with statistically significant Area Under the Receiver Operating Curve (AUC) value of 0.969. Maximum temperature of warmest month and annual precipitation were identified as the predictor variables that contribute the most to Mikania micrantha‟s potential distribution.
1. INTRODUCTION
Species invasion is profoundly altering communities and ecosystems worldwide (Gurevitch and Padilla, 2004). The Convention on Biological Diversity (CBD), underlines that the biological invasion of alien species is the second worst threat after habitat destruction and set global priorities and guidelines to collect information and coordinate international actions on invasive alien species management. Invasive alien species (IAS) is an alien species, which becomes established in natural or semi- natural ecosystems or habitat, an agent of change, and threatens native biological diversity (IUCN, 2000). An IAS has the potential to alter the structure and function of natural ecosystems in a significant way. This paper encompasses Mikania micrantha which is an invasive alien plant species (IAPS).
Mikania micrantha (commonly known as Mile-a-minute weed) is a native of Central and South America (“Global Invasive Species
Database,” 2014). It is one of the major IAPS in many tropical moist forest regions of Asia including Nepal. Nepal is a country with high climatic and physiographic diversity because of which plant and animal from any part of the world may find a suitable habitat here. Tiwari et al. (2005) listed 166 alien plant species which accounts 2.59% of the reported 6419 flowering plant species in Nepal. Among them, 21 species have been considered important with various levels of impacts on biodiversity and ecosystems under which Mikania micrantha is serious invasive alien plant species disrupting forests and shrublands. Commonly
known as Lahare banmara in Nepal, it is one of the “High Risk
Posed Invasive Alien Plant Species (IAPS) of Nepal” (Tiwari et
al., 2005). It is the most frequently encountered IAPS with high coverage in eastern and central part of Nepal.
It is generally agreed that infestation by IAS alters community structure and ecosystem processes (Bhoju et al., 2012). However, approaches taken to combat invasive species and even the data on which they should be based are clearly inadequate to deal with the onslaught of invasive species in Nepal (Kunwar et al., 2013). Nepal is a signatory to the CBD. Article8 (h) of the convention calls upon its contracting parties, as far as possible and as
appropriate, to “prevent the introduction of, control, or eradicate
those alien species which threaten ecosystems, habitats or
species”.
A few case studies in Nepal have indicated that IAS reduces species diversity and negatively affect forest regeneration. Papers on the study of Mikania micrantha in CNP have presented its impact on different species of flora and fauna. This paper aims to determine its potential invasion sites which can help in adapting control and preventive measures of the weed. The objectives of this paper are to:
Study the impact posed by Mikania micrantha on different land cover of study area such as grassland, riverine forest and sal forest.
2. STUDY AREA
This paper is based on the study performed in Chitwan National Park (CNP) and Buffer Zone Community Forest (BZCF) of Bachhauli VDC. The park is situated in the sub-tropical lowlands of southern central part of Nepal covering a total area of 932 sq. km. In 1984, the Chitwan National Park was included on the list of World Heritage Site by UNESCO (DNPWC, n.d.). Bachhauli VDC, with an area of 19.3 sq.km is located at north of the National park. The land cover consists of riverine forest, grassland and agricultural land.
Figure 1. Study area
Mikania micrantha is witnessed to have been expanding at a very alarming rate in CNP (Paudel, 2011). This weed has been creating a serious threat by suppressing the growth of native plants and preventing the regenerations of other plants due to its high dispersal ability (by winds, animals, and by its own natural expansion) and adaptability to colonize in new habitat (Ram, 2008). As we know that CNP is very rich in biodiversity if this species of IAPS goes on invading in this rate it may create threats to the whole ecosystem.
3. METHODOLOGY 3.1 Data Collection
The primary data were the Global Positioning System (GPS) location of sample points in the study area. Systematic random sampling technique with sampling interval 200m was used to collect the sample points in the selected BZCF. At each sample point, the coordinates of that point were recorded using handheld GPS. For the impact assessment purpose, the distribution of Mikania micrantha was observed within a circular plot of approximately 50 m radius around each point. The distribution was then classified into four different levels: 0, 1, 2, and 3 representing 0%, less than 50%, more than 50%, and 100% presence of species respectively. For sampling in the core area, similar method with 500 m sampling interval was used.
The secondary data includes Rapid eye satellite image of 5m resolution which was collected from Forest Resource Assessment (FRA), Nepal. Along with this, topographic data including administrative boundary, road and river of Chitwan district was obtained from Survey Department (DoS), Nepal.
3.2 Image Classification and Accuracy Assessment
Two-third portion of sample points were used to train the image classification algorithm, leaving one-third samples as a test dataset for assessing classification accuracy using proportional stratified random sampling technique. Object based image classification technique was used to classify the image. Multi-resolution segmentation algorithm was chosen for image segmentation.The parameters were defined through trial and error to successfully segment objects in an image. Segmentation outputs were visually checked in relation to target class (e.g., forest area or grassland) to evaluate which parameter combinations best captured the objects of interest.
The image objects created by segmentation were classified to give them both a meaning and a label. User defined decision rules or rule sets were developed by using the information within the image and the properties of the objects. The classification was
applied using a „„top-down‟‟ approach. That is, the classification started from very general classes, which were further subdivided into more specific classes. The final classification of the image resulted in seven land cover classes namely Sal Forest, Riverine Forest, Grassland, Water Bodies, Sand, Agricultural Land, and Bare Land. The accuracy assessment of image classification was performed by creating confusion matrix.
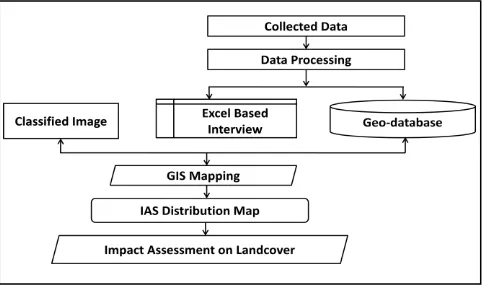
3.3 Mapping for Impact Assessment
Figure 2. Work flow diagram for distribution mapping
To prepare the distribution map, the GPS coordinates of all the samples were overlaid on the classified image. Then the buffer of 50m radius for each sampling point was generated. The buffered points were symbolized in a graduated manner according to their distribution i.e. presence of Mikania micrantha 0%, <50%, >50% and 100% with the darker colour representing higher presence.
3.4 Suitability Analysis through Maxent Model
Maxent modeling uses a set of occurrence localities, together with a set of environmental variables that describe some of the factors that likely influence the suitability of the environment for the species (Phillips et al., 2006). 19 bioclimatic variables with 30 arc seconds spatial resolution were downloaded from World-Clim Chitwan National Park
Latitude : 27.500000° N Longitude : 84.333300° E Area : 932 sq. km.
dataset provided in www.worldclim.org website. Data for altitude, precipitation, maximum, minimum, and mean temperatures of the same resolution were also downloaded from the same source. The Shuttle Radar Topographic Mission (SRTM) Digital Terrain Model (DTM) with 90 m resolution, downloaded from the www.srtm.usgs.gov website, was used to generate the slope, aspect and elevation data layers. The layers representing distance from road and river were also generated.
Figure 3. Work flow diagram for Maxent modeling
All the variables were tested for multi-collinearity by examining cross-correlations among them. Multi-collinearity test was conducted based on the values of correlation coefficient (r). Only one variable from a set of highly cross-correlated variables (r ±0.8) (Yang et al., 2013) was included in the model based on the potential biological relevance to the distribution of the species. Out of 28 variables, only 10 were selected as predictor variables. Among the 10 variables, 8 were non-collinear (Bio2, Bio5, Bio10, Bio3, Bio8, Ri_dist and Ro_dist) while the other 2 variables (Bio1 and Bio12) accounted for all the remaining variables since they were highly correlated.
For prediction, all the selected variables were used as input in the model. Two-third data from the total samples were used as training datasets and one-third as test datasets to run the model. For each run, the AUC (Area under the Response Curve) was assessed that determines the accuracy of the model.
S.N Code Environmental Variables Unit
1 Bio1 Annual mean temperature* ◦C
2 Bio2 Mean diurnal range (mean of
monthly max. and min. temp.) ◦C
3 Bio3 Isothermality ((Bio2/Bio7)×100) -
4 Bio4 Temperature seasonality (std. C of V
5 Bio5 Maximum temperature of warmest ◦C
6 Bio6 Minimum temperature of coldest ◦C
7 Bio7 Temperature annual range (Bio5– ◦C
8 Bio8 Mean temperature of wettest ◦C
9 Bio9 Mean temperature of driest quarter ◦C
10 Bio10 Mean temperature of warmest ◦C
11 Bio11 Mean temperature of coldest quarter ◦C
12 Bio12 Annual precipitation Mm
13 Bio13 Precipitation of wettest period Mm
14 Bio14 Precipitation of driest period Mm
15 Bio15 Precipitation seasonality (CV) C of V
16 Bio16 Precipitation of wettest quarter Mm
17 Bio17 Precipitation of driest quarter Mm
18 Bio18 Precipitation of warmest quarter Mm
19 Bio19 Precipitation of coldest quarter Mm
20 Tmin Monthly Minimum Temperature ◦C
21 Tmax Monthly Maximum Temperature ◦C
22 Tmean Monthly Mean Temperature ◦C
23 Prec Precipitation Mm
24 ElE Elevation M
25 SlO Slope % rise
26 ASP Aspect
27 Ri_dist Distance from River M
28 Ro_dist Distance from Road M
Table 1. Environmental variables used in the study
*Note: The variables highlighted in bold format were the ones selected through multi-collinearity test and, then used in modeling as environmental variables.
4. RESULT AND DISCUSSION 4.1 Impact on different Land Cover
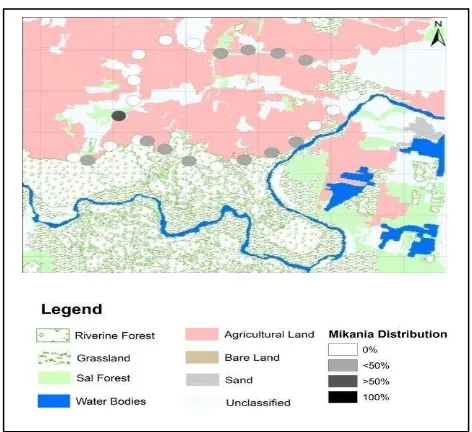
Figure 4. Distribution of Mikania micrantha in Bachhauli VDC
The overall accuracy of the classified map was 90% with Kappa coefficient 0.848. From the primary as well as secondary data collected in the field using GPS, the map showing the distribution of Mikania micrantha was prepared. The distribution is shown in graduated colors with 50 m buffer around each sampling point.
collected was 258 where the highest number of points lies in riverine forest whereas the lowest in agricultural land. 66.28% of points (171) show the presence of Mikania micrantha, where 87 points fall below 50% coverage, 60 points more than 50% coverage and 24 points have 100% coverage.
Coverage (%)
Land Cover
Riverine Forest
Sal
Forest Grassland
Agricultural
Land Total
100% 21 1 2 0 24
>50% 51 4 4 1 60
<50% 63 3 15 6 87
0% 22 39 17 9 87
Total
points 157 47 38 16 258
Presence
% 85.98 17.02 55.26 43.75 66.28
Table 2. Number of sample points in different land cover with respective percentage of Mikania micrantha coverage
From the above table, it is concluded that riverine forest has maximum impact of Mikania micrantha that poses the highest risk of invasion within its surrounding. 85.98% of sample points have presence of Mikania micrantha, whereas sal forest has the least percentage of presence points (17.02%). Grassland and agricultural land are moderately affected with 55.26% and 43.75% presence points respectively.
4.2 Suitability Analysis of Mikania micrantha
Figure 5. Potential invasion image generated using Maxent model
The output image uses colors to indicate predicted probability that conditions are suitable, with red indicating a high probability of suitable conditions for the species, green indicating conditions typical of those where the species is found and lighter shades of blue indicating low predicted probability of suitable conditions. White dots show the presence locations used for training, while violet dots show test locations.
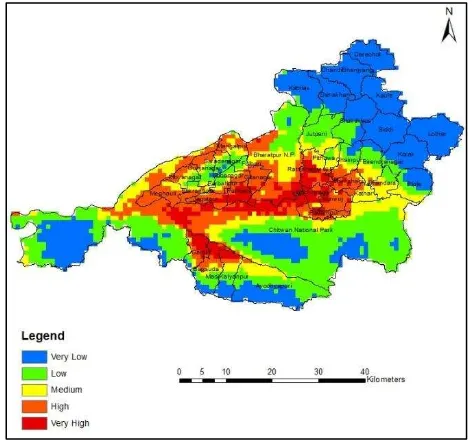
Figure 6. Potential invasion map of Chitwan district
From the potential distribution map, it can be observed that the sites near the river (Rapati, Reu, and Narayani valley) are colored in red, meaning they have very high risk of invasion. The churiya hill slope areas of the national park are colored in mostly green and somewhat blue indicating the lower risk of invasion. This is reasonable with the ground truth that was collected, which showed high level of presence of Mikania micrantha in the riverine forest than any other land cover. Riverine forest is affected mostly because here the weed can get enough moisture, sunlight and support to climb on, which is its suitable habitat.
Average presence was seen in grassland since the grass couldn‟t
provide much support to the climber weed which resulted in lesser impact of Mikania micrantha. The least impact is seen in sal forest because sal is a light demanding species and requires complete overhead light from early stages of development. Agricultural land is also shown as suitable habitat for the weed but in ground truth, the land cover is less affected due to continuous human intervention and manual removal of the weed. Maxent model predicts the species fundamental niche rather than realized niche, since it considers only niche-based presence data (Pearson, 2007; Kumar and Stohlgren, 2009). So, the potential distribution areas tend to be over-estimated compared to the realized niche of the species (their habitat). In reality, a species might have failed to disperse due to geographic barriers, human disturbance or associated competitive species.
4.3 Receiver Operating Characteristic (ROC) Curve
The Area Under the Receiving Operator Curve (AUC) was used
to evaluate model‟s goodness-of-fit and model with highest AUC value was considered as the best performer. In Figure 7, the red
(training) line shows the “fit” of the model to the training data.
the black line then this indicates that the model performs worse than a random model would. The further towards the top left of the graph that the blue line is, the better the model is at predicting the presences contained in the test sample of the data. Since the test line for this model is well above the black line with an AUC value of 0.969, it is concluded that the model performs well.
Figure 7. Sensitivity vs. 1-Specificity curve
4.4 Variable Contributions
The estimates of relative contributions of the environmental variables to the Maxent model are also given as an output by Maxent (Table 3). Here, the variable, maximum temperature of the warmest month has given the most contribution (53%) during the modeling for Mikania micrantha. Then, in the second position comes the variable, annual precipitation with 15.5% contribution.
Variable Percent
contribution
Permutation importance
Maximum temperature of warmest
month(◦C) 53 18.1
Annual precipitation(mm) 15.5 17.3
Distance from Road(m) 8.7 11
Isothermality ((Bio2/Bio7)×100) 6.7 0
Distance from River(m) 4.4 0.8
Mean temperature of warmest
quarter(◦C) 3.8 0.6
Mean diurnal range (mean of
monthly max. and min. temp.)( ◦C) 3.5 13.6
Mean temperature of wettest
quarter(◦C) 2.4 35.3
Slope 2 3.2
Annual mean temperature(◦C) 0 0
Table3. Analysis of variable contributions
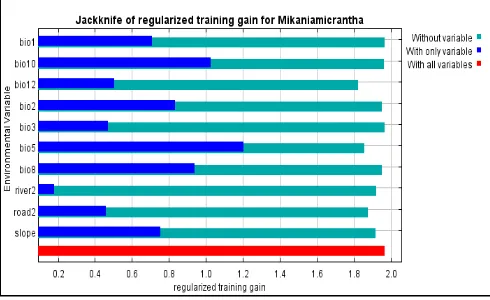
To get alternate estimates of which variables are most important in the model, a jackknife test was also run. The following Figure 8 shows the results of the jackknife test of variable importance.
The environmental variable with highest gain when used in isolation is bio5, which therefore appears to have the most useful information by itself. The environmental variable that decreases the gain the most when it is omitted is bio12, which therefore appears to have the most information that isn't present in the other variables.
Figure 8: Jackknife of Regularized Training Gain for Mikania micrantha
Therefore, from both of the above analysis, it is concluded that bio5 i.e. Maximum Temperature of warmest month and bio12 i.e. Annual precipitation have more contribution for predicting the potential invasion of Mikania micrantha.
5. CONCLUSION AND RECOMMENDATION This paper has assessed the impacts of Mikania micrantha on land cover and predicted the potential invasion sites in CNP through Maxent modeling successfully. This research aimed to provide a brief overview of the extent to which Mikania micrantha can invade the national park if no intervention is applied. The present study complements previous studies of impacts of various invasive species; however, the attempt to model Mikania micrantha invasion potential at CNP using Maxent algorithm provides uniqueness to the study.Because of the suitable habitat, this species has been expanding at an alarming rate in CNP and its BZCF area. The invasion has severely damaging effects on young trees, shrubs, grasses in mostly mixed and riverine forests and grasslands. The result of this paper shows that the riverine forest areas prove to be the most suitable habitat for this weed. There is no known practical use for this weed. Very few control measures have been adopted and hence, no significant outputs are noticed which calls for an urgent requirement for strong control measures.
The output of Maxent modelling is dependent mostly on the occurrence records, environmental layer and resolution at which the study is being conducted. By taking these factors into consideration, the Maxent model can further be used for predicting the potential invasion at various scales and for mapping potential distribution of other flora and fauna species as well.
6. ACKNOWLEDGEMENT
We acknowledge GIRC-Geomatics Project of Kathmandu University and International Center for Integrated Mountain Development (ICIMOD) for its financial contribution towards the achievement of the project. We wish to thank Kathmandu University, Department of Civil and Geomatics Engineering (DCGE) and Land Management Training Centre (LMTC) for their continuous guidance and supervision in successful completion of the project. Also, we owe great many thanks to the entire team of NTNC, BCC (National Trust for Nature Conservation, Biodiversity Conservation Center), Sauraha, Chitwan for their tremendous support and generosity during the field work in Chitwan National Park.
7. REFERENCES
Bhoju, D. R., Shrestha, B. B., & Niraula, R. R. (2012). Study on Invasive Alien Species (IAS) as Drivers to Deforestation and Degradation of Forests in Different Physiographic Regions of Nepal. BS JV API/REDD Cell, Climate Change Unit MFSC.
DNPWC. (n.d.). Chitwan National Park. Retrieved from http://www.dnpwc.gov.np/protected_areas/details/chitwannational park on 04-10-2014.
Global Invasive Species Database (2014). Species profile: Mikania micrantha. Retrieved from http://www.iucngisd.-org/gisd/species.php?sc=42 on 04-06-2014.
Gurevitch, J. and Padilla, D.K. (2004). Are invasive species a major cause of extinctions? Trends. Ecol. Evol. 19, 470–474.
IUCN. (2000). IUCN Guidelines for the Prevention of Biodiversity Loss due to Biological Invasion. Gland, Switzerland.
Kumar, S., &Stohlgren, T. J. (2009). Maxent modeling for predicting suitable habitat for threatened and endangered tree Canacomyricamonticola in New Caledonia. Journal of Ecology and the Natural Environment, 1(4), 094-098.
Kunwar, R. M., &Acharya, R. P. (2013). Impact Assessment of Invasive Plant Species in Selected Ecosystems of BhadaureTamagi VDC, Kaski, International Union for Conservation of Nature and Natural Resources, Lalitpur, Nepal.
Paudel, R. P. (2011). Insight Into Invasive Species (Mikania micrantha), Its Control Measures and Programmes in Nepal. The Initiation, 4, 115-119.
Pearson, R. G. (2007). Species‟ distribution modeling for
conservation educators and practitioners. Synthesis. American Museum of Natural History, 1, 1-50.
Phillips, S. J., Anderson, R. P., & Schapire, R. E. (2006). Maximum entropy modeling of species geographic distributions. Ecological modelling, 190(3), 231-259.
Ram, A. K. (2008). Impact of Mikania micrantha on Rhinoceros habitat in Chitwan National Park, Chitwan Nepal (Doctoral dissertation, Tribhuvan University).
Tiwari, S., Siwakoti, M., Adhikari, B. & Subedi, K. (2005). An Inventory and Assessment of Invasive Alien Plant Species of Nepal, IUCN - The World Conservation Union, Nepal. viii+114 pp.