UNDERSTANDING SPATIO-TEMPORAL MOBILITY PATTERNS FOR SENIORS,
CHILD/STUDENT AND ADULT USING SMART CARD DATA
Xianfeng Huang a, Jing Tan a, *
a State Key Laboratory of Information Engineering in Surveying, Mapping and Remote Sensing (LIESMARS), Wuhan University, 129 Luoyu Road, Wuhan, 430079, China - (huangxf, tanjing)@whu.edu.cn
Commission I
KEY WORDS: Transportation, Spatio-temporal, Mobility Patterns, Smart Card Data, Network Analysis, GIS
ABSTRACT:
Commutes in urban areas create interesting travel patterns that are often stored in regional transportation databases. These patterns can vary based on the day of the week, the time of the day, and commuter type. This study proposes methods to detect underlying spatio-temporal variability among three groups of commuters (senior citizens, child/students, and adults) using data mining and spatial analytics. Data from over 36 million individual trip records collected over one week (March 2012) on the Singapore bus and Mass Rapid Transit (MRT) system by the fare collection system were used. Analyses of such data are important for transportation and landuse designers and contribute to a better understanding of urban dynamics.
Specifically, descriptive statistics, network analysis, and spatial analysis methods are presented. Descriptive variables were proposed such as density and duration to detect temporal features of people. A directed weighted graph
G
( , , )
N L W
was defined to analyze the global network properties of every pair of the transportation link in the city during an average workday for all three categories. Besides, spatial interpolation and spatial statistic tools were used to transform the discrete network nodes into structured human movement landscape to understand the role of transportation systems in urban areas. The travel behaviour of the three categories follows a certain degree of temporal and spatial universality but also displays unique patterns within their own specialties. Each category is characterized by their different peak hours, commute distances, and specific locations for travel on weekdays.
* About the corresponding author: Jing Tan, Email: [email protected]
1. INTRODUCTION
There are a variety of people living in urban areas conducting a variety of activities. They study, work, travel to other places, constituting the pulse of the city and forming their own activity clusters. Research has shown that most individuals have very stable mobility patterns that can be analyzed and used as travel behavior to make predictions (Agard, et al., 2006; Bagchi and White, 2005; Liang, et al., 2009; Park, et al., 2008). It has been shown that user mobility can potentially be predicted with 93% average confidence (Song, et al., 2010). However, different age groups can have different travel patterns. This is a relative and fuzzy assumption that needs further clarification.
Related work has been done to assess the potential of data mining and spatial analysis techniques for urban analysis. For instance, Ordóñez, et al., 2013 and Chakirov, et al., 2012 used smart card and survey data to estimate dynamic workplace capacities; floating car data and point of interest (POI) data were used to discover regions of different functions in a city (Yuan, et al., 2012); In a paper by Chen, et al., 2013, the characteristics of a polycentric urban form were represented by analyzing travel survey data to infer spatial structure of urban functional centers.
This study proposes a method to detect the underlying spatio-temporal mobility patterns by analysing the use of smart cards among senior, child/student and adult commuters in Singapore. Since urban travel is a good proxy for the transfer of urban flows such as people, freight, and information, the motivation for this work is to explore the relationship between commuters who use smart cards every day and the underlying urban
geography. This relationship is of high importance for transportation and land-use designers and contributes to a better understanding of urban dynamics.
In this work, mobility pattern refers to travel behaviors such as starting time of a certain trip or staying time of a certain activity and interesting places to conduct some activities. The main contributions of this study include: (1) detecting human flow patterns using smart card records as the data source; (2) using quantitative measures such as graph properties to obtain an overview of travel demand. Specifically, in dealing with weighted networks, this study uses eigenvector centrality as the measure to distinguish the spatial distribution for the three categories of commuters. This study can contribute to better design and planning of future urban transport systems as well as feasible facility location according to individual or group pattern preferences.
2. DATASET DESCRIPTION AND DATA PRE-PROCESSING
This study was performed on over 36 million individual trip records for one complete week from 19, March, 2012 (Monday) till 25, March, 2012(Sunday) collected by a fare collection system in Singapore. Every day there are about 5 million transit records from the users. In particular, all the passengers were divided into three different categories according to age distribution: Adult, Child/Student and Senior citizen. Detailed information about the records is shown in Figure1. The smart card information is shown in Table 1.
Figure 1. The proportion of travel records corresponding to the three categories for the whole week, in March 2012.
Field Description
Journey ID The unique number for a journey Card ID The coded number for a stored
value card
Passenger Type Derived based on the card type the commuter hold – Adult, Senior Citizen and Child (including students)
Travel Mode Refer to transport mode of the ride – Bus or Metro.
Boarding_STOP_STN Boarding bus stop for a bus ride, or station of entering rail system for a metro ride.
Alighting_STOP_STN Alighting bus stop for a bus ride, or station of leaving rail system for a metro ride.
Ride start date The date of a ride started. Ride start time The time of a ride started. Ride distance The ride distance in km.
Ride time The time interval (minutes) between the boarding and the alighting of a ride.
FarePaid Fare paid for the ride
Transfer_number The transfer sequence number of a journey
Table 1. Smart card information collection
Based on the smart card data, useful information can be collected and analysed for each category of commuters. For each category, the boarding time for a journey, as well as the travel time and the location of check-in and check-out, can be collated to infer the Origin-Destination (O-D) feature of the trip to construct a network.
3. MOBILITY PATTERN DETECTION
3.1 Temporal Mobility Patterns
Bus / metro stops are the focus of this study, because such stations represent a hub within which attractiveness generates. In order to discover areas that people often visit, for instance, trendy shopping places and leisure places or living and working areas, their level of attractiveness is represented in time domain as the boarding / alighting volume (density) and duration of relevant stops.
3.1.1 Density fluctuation with time:
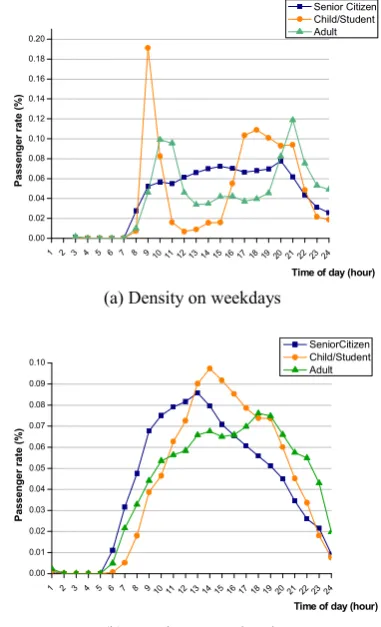
This study split the whole day into 24 time intervals and calculated the percentage of people heading to all stations on both weekdays and weekends. The temporal patterns are shown in Figure 2.
Figure 2. Public transit temporal patterns among the three categories in different day
Figure 2 (a) and 2 (b) show that during weekdays there are obvious morning and evening commuter peaks. This rhythm reflects the daily life pattern of citizens in Singapore. However, each category has a slightly different pattern. For senior citizens, the morning peak begins from 8am and stays high till the evening (21:00), suggesting that seniors in Singapore are not restricted to early morning and evening office commuting hours, which means that they have more flexible schedules. For children/students and adults, two prominent peaks (morning and evening) can be identified, indicating their regular commuting behavior. Specifically, the PM peak lasts from 17:00 through 22:00 for children/students, and the AM peak begins one hour later for adults than the other two categories.
In comparison, the weekend patterns are similar despite a slight difference in peak hours due to the absence of commuting flows over weekends. The overall trend shows that the peak hour first begins among senior citizens, then followed by adults and children/students in sequence, which is in accordance with seniors’ way of life. They tend to start their weekend earlier than adults and students.
3.1.2 How long do people stay on these locations (duration):
Duration, or staying time is estimated as the period between two trips used to perform certain activities such as working, studying, social visit etc. In this study, it is measured by calculating the time interval between the alighting time at one specific station for a trip and the boarding time of the same station for the following trip.
1 2 3 4 5 6 7 8 9 10 11 12 13 14 15 16 17 18 19 20 21 22 23
Figure 3. Percentage of duration for an activity in one location
Figure 3 shows that a large proportion of trips last 1-hour or less, meaning that the duration for an activity in one location is generally less than an hour. Besides, a peak shows around 10-hour for adults on weekdays, suggesting that the time interval between morning peak and evening peak is employment related. It also means that the average working time is about 10 hours for adults. Similarly, it can be inferred that the average working/leisure activity time for seniors is 9-10 hours and the average studying time for students is 7 hours. On weekends, however, the peak shows around 2.5 hours for children/students, suggesting that they commute for recreation on weekends.
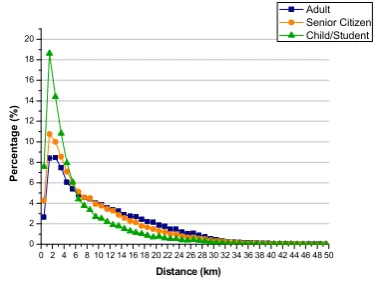
3.1.3 Travel Distance Analysis:
The analysis of distances for the three categories is shown as a probability density function (PDF) in Figure 4. The graph shows that most of the journeys are within a distance of 2km, especially for children/students. This may be attributed to the fact that human flows are composed around short distances between work and home locations.
0 2 4 6 8 10 12 14 16 18 20 22 24 26 28 30 32 34 36 38 40 42 44 46 48 50
Figure 4. Probability density function of distance for the three categories
3.2 Spatial Mobility Patterns
3.2.1 Research Method
The AM and PM peak mobility pattern variations between the three categories can be detected through temporal analysis. But how do they distribute on a spatial scale and do obvious connections exist between different bus/metro stations? In order to answer these questions, this work developed an integrated transfer from bus stops to metro stops and vice versa. Based on this, an O-D matrix of travel (trip volumes) is constructed merely considering the very first boarding station of a certain journey and the last alighting station of the same journey, ignoring the transfers in the middle.
Then, appropriate metrics are defined by combining topological and dynamical observables. These enable us to undertake the statistical analysis of complex networks whose edges have been assigned a given weight, and to characterize the complex statistical properties and heterogeneity of the actual strength of edges and vertices. Specifically, topological observables deal with unweighted networks in order to study the underlying physical structure of the network, while dynamical observables deal with weighted networks which investigate the correlations among weighted quantities i.e. intensity of human mobility (dynamics of traffic flow taking on the structure).
Meanwhile, basic graph properties are applied to measure various centralities, which provide an overview of travel demand and interactions in the city. In particular, centrality in unweighted networks are measured by degree centrality, closeness centrality, and betweenness centrality; and centrality in weighted networks are constructed by the strength
s
i (the weighted degree that indicates intensity of travel – trip volumes – to and from one area) as well as eigenvector centrality of the vertices as the definition of the importance of a vertex or influence measures mathematically. By comparing these properties, the urban interactions within a city with respect to location can be figured out.Finally, to gain a deeper understanding of the human mobility and locations of interest, such indices are selected and projected into geographical space to determine hot spots. Then spatial interpolation and spatial statistic tools are applied to transform the discrete network nodes (or stations) into structured human movement landscape.
3.2.2 Case Study in Singapore
The statistical analysis in 3.1.3 shows that most commuters’ daily activity is confined to limited neighborhoods of 1 to 2 km. So the networking experiments merely for short rides (travel distance within 2km) can reflect their travel patterns to some degree. Table 2 shows the global network properties for the three categories.
Senior
citizen Child/student Adult
Number of nodes 3716 3486 4442
Number of edges 14114 16199 29467
Closeness
centrality 3.66E-07 5.82E-07 4.01E-07 Betweenness
centrality 2.91E+04 3.33E+04 3.04 E+04 Average degree
(unweighted) 7.60 9.29 13.27
Average strength
(weighted) 27.68 67.41 164.45
Eigenvector centrality
(weighted) 7.31E-04 8.14 E-04 9.56 E-04 Table 2. The statistical properties of the short ride network for
the three categories
From the table above, some differences can be easily recognized for the three categories: adults always have more nodes and edges, and have higher degree as well as betweenness centrality, due to their majority (80%) in the commuter data for Singapore. However, the child/student group only takes up 10% of the commuting population, while have higher closeness centrality, meaning that they tend to travel to more closely concentrated places, mainly studying areas.
To gain a better understanding of the spatial distribution of interested locations, an attractiveness index was to be selected as the attribute field to be projected into geographical space to determine hot spots, which reflect spatial patterns of individuals. Since other measures of node centrality such as betweenness and closeness are defined only for simple graphs without weighted edges, in this case, the eigenvector centrality (EVC), which forms the foundation for the PageRank algorithm used by Google (Brin, S., and Page, L. 1998), was selected as the attractiveness measure.
Mathematically, EVC is known as influence measures, which is ideally suited for influence type processes. The idea is that even if a node influences just one other node, which subsequently influences many other nodes (that themselves influence still more others), then the first node in that chain is highly influential. Thus, a node that has a high eigenvector score is one that is adjacent to nodes that are themselves high scorers. The EVC of a node
i
is defined being proportional to the sum of the EVC ofi
’s neighbors:( ) j j nn i i
e e
(1)where
nn i
( )
denotes the set of neighbors of nodei
. We can rewrite (1) in a compact matrix form:
A e
e
(2) Wheree
is the leading eigenvector of the adjacency matrixA
(with the elements of the matrix being equal to the edge weights) relative to the eigenvalue of
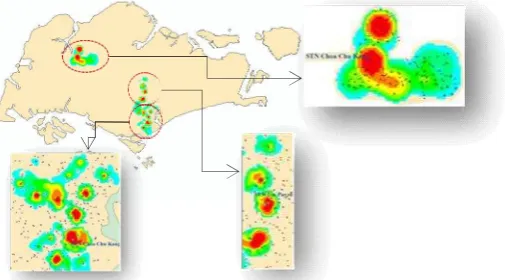
, representing the vector of nodes’ centrality scores.In this case, the EVC value of a node in the network can reflect the connectivity and the level of attractiveness which is proportional to its spatial impact of the corresponding station and its nearby area. Through spatial mapping of EVC at each station point, their distinct spatial patterns (as shown in Figure 5) can be detected. Then the IDW spatial analysis tool in ArcGIS is implemented to interpolate the EVC distributions of the three categories and the clusters are displayed in the same map (as shown in Figure 6).
Figure 5. Spatial mapping of EVC at each station point
Figure 6. Interpolated EVC landscape for the three categories (b) Child/student: West Region (a) Senior: Central Region and North-East
Region
(c) Adult: Central Region
Legend: low high
Figure 7. Master Plan 2008 by Urban Redevelopment Authority (URA)
For the three images shown in Figure 5, inspection of the weighted eigenvector centralities highlighted important differences in traffic flows for the three categories for short rides. This suggests that each of the three groups of riders have places of interest that are unique to each group. The interpolated map of the computed EVC index, from which the preferred locations of each category can easily be detected is shown in Figure 6. The detected clusters are marked with ellipses for each category. For example, the image shows the areas mapped in red to be more popular than those in blue. For the cluster of each category, the most typical station (with high EVC value) is selected and identified to evaluate the feasibility of this method.
Specifically, senior citizens prefer Central Region and North-East Region, suggesting that they tend to have more diverse location choices for their activities and their average activity spaces are larger than the other two categories. This can be explained by the fact that station such as Toa Payoh, located in the Central Region of Singapore, covers the Housing and Development Board (HDB) housing estate. The housing estate is self-contained and has a town center acting as a focal point for the shopping and entertainment needs of the residents. Industrial developments were also built within such areas to provide the senior citizens with job opportunities close to home.
However, children/students prefer the West Region, which contains several educational institutions (shown in Figure 7: Master Plan 2008 of Singapore). Further investigation shows that the Choa Chu Kang Metro Station, for instance, with a relatively high value of EVC, has high level of attractiveness for the student group. It is an interchange station serving the Choa Chu Kang area of Singapore, which is a major residential town and neighbourhood and is a suburban area within the West Region of Singapore. There are currently eight primary schools and six secondary schools in Choa Chu Kang New Town along with a junior college, which is also compatible with its popularity among children/students.
Besides, the Central Area, which houses most of the commercial areas, is one of the most significant places for adults to visit. For instance, Raffles Place, located in the Downtown Core and the Central Area, featuring the landmarks of the country, includes notable buildings such as One Raffles Place, Republic Plaza and OCBC Center. The stock exchange of Singapore - the Singapore Exchange - and administrative buildings like the
Parliament House, the Supreme Court and City Hall are also located in the vicinity.
This distinct feature can be justified by the Pearson correlation coefficient (as the table show below).
Pearson correlation coefficient Senior vs Child /
Student -0.0011
Child / Student
vs Adult -0.0015
Senior vs Adult 0.0039
Table 3. Pearson correlation coefficient of short ride
Table 3 shows the Pearson correlation coefficients between the three categories. Pearson correlation coefficient, also known as Pearson’s
r
, is a measure of the strength of the linear correlation or dependence between two variables that is defined as the (sample) covariance of the variables divided by the product of their (sample) standard deviations. The value ranges from −1 to 1, where 1 is total positive correlation, 0 is no correlation, and −1 is total negative correlation. In this study, two arbitrary EVC of the three categories are selected to compute the Pearson correlation coefficient value. It can be seen from the table above that the value is quite close to 0 whatever the category, suggesting that space isolation exists between them.4. CONCLUSION
This work is aimed at understanding the behavior patterns of senior citizens, adults and children/students using transportation data. The aim is to find the distinct features of people’s behavior patterns for commuters from different ages. It proved partly that the people of different ages live in the same city, but in a different world, as their behavior results in different spatio-temporal patterns. The travel behavior for the three categories follows a certain degree of temporal and spatial universality but also displays unique patterns within their own specialties on both bus and metro links. Each category is characterized by different peak hours, commute distances, and specific locations for travel on weekdays.
This work explored ways to understand human mobility patterns with quantitative measurements of spatio-temporal features using smart card data. In particular, descriptive variables were proposed such as density and duration to detect temporal features and network centrality indices especially eigenvector centrality to compare spatial variations for the three categories. It is an innovative instance to implement such network centrality into the analysis of spatial patterns of human flow, since using network and graph theory with smart card data analysis does not have a very long history, especially when dealing with weighted network.
The division of commuters according to their age is another innovative point in this work. Previous efforts mostly focused on the regularity of human flows in cities. However, this study is concerned with the diversity among them by combining network analysis and spatial interpolation method. Using such combinations, the distinct features of commuters can be effectively detected from the distributions of network and spatial properties.
LEGEND
BUSINESS COMMERCIAL
OPEN SPACE RESIDENTIAL
RESERVESITE EDUCATIONAL
INSITUTION
In addition, the data source applied in this work is smart card data, which is comparatively new but is being rapidly introduced for the biggest transit systems worldwide.
However, the limitations to this analysis were posed by the use of only one week of data. This implies that the data set is not enough to reflect the real situation of human flow over a period of time. If more data across weeks or years could be obtained, it would be possible to conduct a larger-scale study on the network analysis. Besides, the data source is only confined to smart card data, without combining other data sources.
To sum up, much work still has to be done using multiple data sources to study human mobility and urban dynamics. In the future, different data sources from additional urban infrastructure (e.g. taxi trajectory data, cell phone record data) combining with urban statistical data (e.g. population, travel survey data) can be fused to gain higher levels of understanding of urban dynamics.
REFERENCES
Agard, B., Morency, C., Trépanier, M., 2006. Mining Public Transport User Behaviour From Smart Card Data. In: 12th IFAC Symposium on Information Control Problems in Manufacturing-INCOM , pp. 17-19.
Bagchi, M., White, P., 2005. The potential of public transport smart card data. Transport Policy, 12(5), pp. 464-474.
Chakirov, A., Erath, A., 2012. Activity identification and primary location modelling based on smart card payment data for public transport. Eidgenössische Technische Hochschule Zürich, IVT, Institute for Transport Planning and Systems.
Carreras, I., Miorandi, D., Canright, G.S., Engø-Monsen, K., 2007. Eigenvector centrality in highly partitioned mobile networks: Principles and applications. Advances in biologically inspired information systems, Springer, pp. 123-145.
Liu, L., Hou, A., Biderman, A., Ratti, C., Chen, J., 2009. Understanding individual and collective mobility patterns from smart card records: A case study in Shenzhen, Intelligent Transportation Systems, 2009. In: Intelligent Transportation Systems, 2009. ITSC'09. 12th International IEEE Conference on. IEEE, pp. 1-6.
Ordóñez Medina, A. and Erath, A., 2013. Estimating Dynamic Workplace Capacities using Public Transport Smart Card Data and a Household Travel Survey. In: Proceedings of the presented at Transportation Research Board (TRB) 92nd Annual Meeting,Washington, D. C., pp. 20-30.
Park, J.Y., Kim, D. J., Lim, Y., 2008. Use of smart card data to define public transit use in Seoul, South Korea. Transportation Research Record: Journal of the Transportation Research Board,2063, pp. 3-9.
Brin, S., Page, L., 1998. The anatomy of a large-scale hypertextual Web search engine. Computer networks and ISDN systems, 30(1), pp. 107-117.
Soh, H., Lim, S., Zhang, T., Fu, X., Lee, G.K.K., Hung, T.G.G., Di, P., Prakasam, S., Wong, L., 2010. Weighted complex network analysis of travel routes on the Singapore public
transportation system. Physica A: Statistical Mechanics and its Applications, 389(24), pp. 5852-5863.
Song, C., Qu, Z., Blumm, N., Barabási, A.L., 2010. Limits of predictability in human mobility. Science, 327(5968), pp. 1018-1021.
Yuan, J., Zheng, Y., Xie, X., 2012. Discovering regions of different functions in a city using human mobility and POIs, In:
Proceedings of the 18th ACM SIGKDD international conference on Knowledge discovery and data mining, ACM, Beijing, China, pp. 186-194.
Zhong, C., Arisona, S.M., Huang, X., Schmitt, G., 2013. Identifying spatial structure of urban functional centers using travel survey data: a case study of Singapore. In: Proceedings of The First ACM SIGSPATIAL International Workshop on Computational Models of Place, Orlando, FL, USA, pp. 28-33.