3D PAINTING DOCUMENTATION: EVALUATION OF CONSERVATION CONDITIONS
WITH 3D IMAGING AND RANGING TECHNIQUES
D. Abate ¹, F. Menna ², F. Remondino ², M.G. Gattari ³
¹ 3D GraphLab ENEA UTICT, Bologna, Italy
[email protected], http://www.afs.enea.it/project/graphlab/index.shtml ² 3D Optical Metrology unit, Bruno Kessler Foundation, Trento, Italy
<fmenna><remondino>@fbk.eu, http://3dom.fbk.eu
³ Soprintendenza per i Beni Storico Artistici ed Etnoantropologici, Bologna, Italy [email protected]
Commission V – WG2
KEY WORDS: Cultural Heritage, Photogrammetry, Structured light sensor, Monitoring, Comparison
ABSTRACT:
The monitoring of paintings, both on canvas and wooden support, is a crucial issue for the preservation and conservation of this kind of artworks. Many environmental factors (e.g. humidity, temperature, illumination, etc.), as well as bad conservation practices (e.g. wrong restorations, inappropriate locations, etc.), can compromise the material conditions over time and deteriorate an artwork. The article presents an on-going project realized by a multidisciplinary team composed by the ENEA UTICT 3D GraphLab, the 3D Optical Metrology Unit of the Bruno Kessler Foundation and the Soprintendenza per i Beni Storico Artistici ed Etnoantropologici of Bologna (Italy). The goal of the project is the multi-temporal 3D documentation and monitoring of paintings - at the moment in bad conservation’s situation - and the provision of some metrics to quantify the deformations and damages.
1. INTRODUCTION
Heritage conservation and preservation should be always coupled with adequate and accurate documentation and surveying actions. The concept and application of “preventive conservation and monitoring” became a widespread concept in Europe after the Vantaa ICOM-CC conference in Finland (2000) where everyone agreed on the importance of a careful monitoring of the environmental conditions surrounding cultural heritage. Several actions took place after the Vantaa conference and a number of rules and solutions have been sought in the following years. The main factors impacting on the conservation state of an artwork were recognized to be, as far as microclimate is concerned, relative humidity, temperature and light. Biological aspects such as insect attacks were also considered relevant and therefore to be studied and monitored. Another important identified factor was the air’s quality and air dispersed pollutants which are deposited on the artwork’s surface and may cause a noticeable decay even in a short time. Recently, several scientific projects - often EU-funded - started whose aim was to define and meet the most up-to-date guidelines in preventive conservation (ERA -Environmental
Research for Art Conservation, MIMIC - Microclimate Indoor Monitoring in Cultural Heritage Preservation, LiDo (Light Dosimeter for Monitoring Cultural Heritage, Development, Testing and Transfer to the Market, SMOOHS - Smart Monitoring of Historic Structures, LaserACT - Laser multitask non-destructive technology in conservation diagnostic procedures, etc.). One of the most successful and recent idea was to consider some of the above mentioned issues not separately but the resulting global impact factor as all causes act concurrently.
Nowadays the installation of climate control units to provide human comfort as well as good conservation conditions inside museums is facilitating conservation and preservation actions. On the other hand museums’ depots and storage rooms which host large part of collections are sometimes not maintained in a stable environmental conditions due to lack of funding and bad practice. This inappropriate practice is crucial for all artworks, particularly for paintings conservation (especially for those realized on wooden supports). These kinds of artworks indeed are very sensitive to the variation of some parameters like light, temperature and humidity.
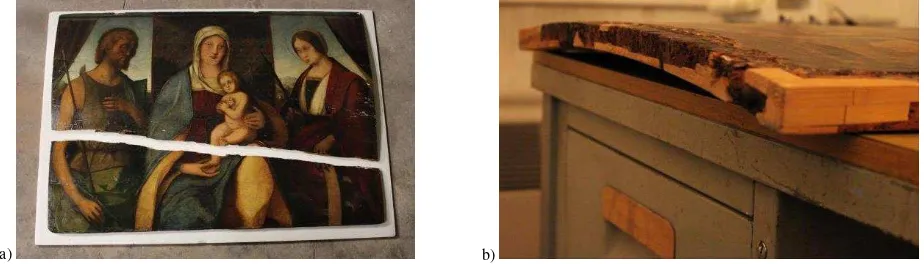
a) b)
Figure 1. An example of a damaged painting (a). A Cretan icon showing a clear bending effect (b). Both paintings are located in the depots of the Soprintendenza per i Beni Storico Artistici ed Etnoantropologici of Bologna, Italy.
Artwork Relative Humidity (%) Temperature (°C) Painting on
wooden support 45-65 19-24
Table 1. Thermo-Hygrometric parameters for the conservation of optimal chemical and physical conditions of artworks.
The most used specifications for indoor climate control in Italian museums are contained in the Italian standard UNI 10829:1999 (Mibac, 1999). According to these guidelines the optimal thermo-hygrometric parameters for the conservation of paintings on wooden support are shown in shown in Table 1. When thermo-hygrometric parameters are altered, wooden paintings can suffer of support’s deformation, resulting in curving and warping, which can affect the depicted surface causing cracks, pigments detaching until the worst and unrepairable break of the support (Fig.1, a).
Starting from this assumption and following the concept of preventive conservation and monitoring, it was decided to carry on a monitoring activity on some selected paintings. A traditional monitoring of thermo-hygrometric parameters was combined with 3D imaging and ranging techniques. Reality-based 3D techniques (Remondino & Rizzi, 2010) can indeed offer a useful support to identify and measure the conservation’s status of paintings on wooden tables assessing, at sub-millimetres level, the deformation of the support assuming it was originally flat.
For this project, three paintings were selected among a collection in the deposits of the Pepoli - Campogrande Palace in Bologna (Italy):
Saint John the Baptist (198 x 62.5 cm) by Giacomo Francia, ca XVI century;
Cretan icon (85 x 55 cm), ca XVII century (Fig.1, right); Oil on canvas (30 x 20 cm) by Ludovico Cavalieri, ca
XIX century.
The three paintings (the first two are on a wooden support while the third one is an oil on canvas) were digitized using photogrammetry and structured light scanning techniques with the following aims:
analyse the geometric features of the paintings (e.g. brush strokes);
visualize additional information about the style; influence the overall visual impression of the painting; measure the shape of the wooden support;
assess the deformation’s status assuming an original planarity of the support;
monitor the shape of paintings on a medium/long term period;
produce high-resolution orthoimages for digitization, analyses and restoration purposes.
Beside these aims, the project is seeking an efficient cost-effective procedure for a systematic 3D recording of paintings in order to study the deformations occurred over time and plan the optimal conservation conditions and policies. The reasons behind the use of both imaging and ranging techniques are to evaluate and compare the benefits and drawbacks of each technique in terms of:
time necessary to digitize a complete painting (front and back side);
In the field of painting’s conservation there is a number of non-contact techniques which allow detailed analyses of the artwork’s surface and support in the visible and non-visible spectrum.
Multispectral imaging and 3D surveying techniques can be used for different purposes to provide reliable data to restorers for planning the restoration process or adjust the environmental conditions. In recent years the study and characterisation of artworks’ surface by means of different non-invasive digital techniques is quickly evolving (Fontana et al., 2005; Blais et al., 2007; Lahanier et al., 2008; Remondino et al., 2011; Granero-Montagud et al., 2013). Typical outputs are usually represented by pigment identification, colour measurements, extraction of geometric features (brush strokes details), shape’ measurements, etc. Range-based 3D modelling techniques (Guidi et al., 2004; Akca, 2007; Blais et al., 2008; Breuckmann, 2011), such as laser scanners and structured light sensors, and image-based 3D modelling technique, such as photogrammetry (Robson et al., 2004; D’Amelio & Lo Brutto, 2009; Barazzetti el al., 2010) can provide for precise and reliable 3D geometrical and radiometric information useful for detailed analyses and inspections. Both approaches allow the retrieval of very high geometric details with reported spatial resolutions ranging from 60 µm and 400 µm.
With respect to related works, the study presented in this paper reports the analysis of the whole paintings (both front and back sides), 3D reconstructions with dense image matching methods for measuring fine geometrical details on the painting surface and the use of spherical targets for accurately connect the two sides in a unique reference frame. Comparisons between active scanning and photogrammetry are also reported.
3. SURVEY CAMPAIGNS
The structured light scanning and photogrammetric acquisitions were realized within one week, to guarantee neither significant shape variations nor changes in environmental conditions (temperature, humidity, etc.) between the surveys. Both surveys were planned to deliver similar geometrical results with comparable sub-millimetre spatial resolution. Different strategies for each technique were exploited to solve the main problem of surveying a thin flat object on both the sides. Besides the difficulties arisen from the geometric shape of paintings and their brilliant surfaces, many constraints were present, generally dictated by the location and preservation of the paintings themselves. The vulnerability of this class of objects requires a careful project planning that takes into account their sizes, surface materials as well as limited mobility. Indeed, the space in the deposits is usually very narrow and, furthermore, rarely the paintings can be moved from the room in which they are stored. For this reason the locations where the paintings are situated represent one of the main constraints that do not allow to find a standard procedure applicable to any case study. From this point of view the deposits of Pepoli - Campogrande Palace in Bologna can be considered a very complicate scenario for photogrammetric and laser scanning acquisitions (being the space available in the deposit’s room approximately 3x2 square meters) and so a representative case study.
4. RANGE-BASED SURVEY
The paintings digitization was performed exploiting a structured light Breuckmann SmartScan 3D HE instrument. This active sensor allows the simultaneous recording of 3D geometries and colour information. The instrument features two cameras with a resolution of 5Mpx (2.452x 2.056 pixel), a field of view of 240 x 200 mm and a measuring depth of ca 150 mm. This ensures a X-Y spatial resolution of 100 µm for single range map. According to the manufacturer specifications, the active system can achieve a X-Y spatial resolution of 26µ according with the VDI 2634 specification (Luhmann, 2000; VDI/VDE, 2002, 2008).
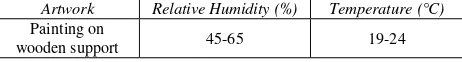
In order to avoid likely deformations during the registration of the range maps due to low overlapping, a sheet of polystyrene used as additional plane constrain was placed behind the artwork. Some nails were skewered on the polystyrene sheet all around the painting and some magnetic targets (4 mm diameter) placed on top of them (Fig. 2a).
a) b)
Figure 2. a) 3D structured light scanning survey of the Saint John the Baptist painting. On the upper part of the image a closer view of the
used targets is shown. b) The 195 range maps of the Saint John the Baptist painting after the final ICP alignment which closed with 40 m
RMSE.
During the scanning process (4 days for all the 3 artworks), the targets were acquired together with the borders of the wooden artwork in order to create the frame of the painting, filled later with the scans of the internal parts. This method allowed to avoid deformations which can occur when digitizing flat surfaces.
In order to acquire on both sides of the artworks, a 2 mm adhesive targets were placed on the lateral edges.
The traditional range data processing pipeline was applied using the Optocat proprietary software package. The surrounding range maps were pre-aligned using the automatically recognized targets while the internal range maps were manually registered. Finally an ICP minimization procedure refined the alignment of all the acquired maps delivering a unique and dense point cloud for every artwork (Fig. 2b). Table 2 summarizes the overall RMSE values after the ICP processes. It is worth notice how the global RMSE of the alignment is significantly higher when front and back sides of the painting are merged together in a unique reference system (Cretan icon).
After the alignment process, all the range maps of each painting were merged together in a single polygonal model (Table 3) with a spatial resolution of 0.4 mm.
The final merged models consisted of millions of polygons as shown in the table below.
Painting Root Mean Square Error (RMSE)
Saint John the Baptist 0.04 mm
Cretan icon 0.2 mm (front & back side)
Ludovico Cavalieri 0.03 mm
Table 2. RMSE values of the alignment procedures.
Painting # Range Maps # Polygons
Saint John the Baptist 195 10.5 mil
Cretan icon 193 14.8 mil
Ludovico Cavalieri 25 2.9 mil
Table 3. Range-based surveying data and modelling results.
5. PHOTOGRAMMETRIC SURVEY
A photogrammetric survey of a painting can be considered a special case of surveying a flat surface i.e. a relatively simple shape to model. Today digital photogrammetry can be a feasible and flexible solution and a quasi-standard procedure may be found to suggest general best practices for systematic 3D surveys. The main difficulties arise when both the front and back of the painting must be surveyed in a unique reference frame as it is the case of this project where a sub-millimeter global accuracy was required. The painting’s shape is such that a standard camera network consisting of a sequence of overlapping photos all around would not be feasible or at least would be unreliable. Indeed, the front and back parts of the paintings would be connected by the sides of the painting that are normally very narrow leading to a geometrically unstable connection of back-to-front parts. These difficulties can be overcome using external object points (e.g. targets) positioned strategically around the painting.
For the presented artworks, the main purpose of the photogrammetric survey was to record the paintings’ 3D shape and a faithful photographic color reproduction with a spatial resolution of ca 0.2 mm, demanded to monitor the surface and the presence of possible fractures.
In order to survey the front and back of the paintings, two separate surveys for each painting were planned. These surveys were intended to be processed separately and then merged using a similarity transformation in a unique frame by means of common spherical targets.
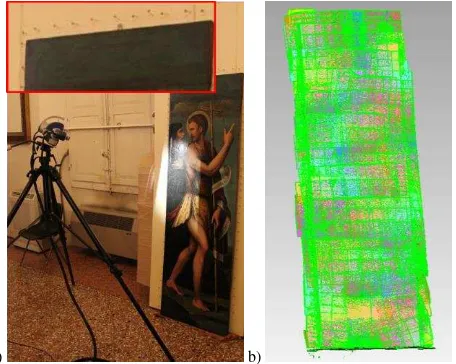
The paintings were placed vertically on an easel and 10 spherical targets attached to two photographic light-stands were placed on the lateral sides in order to be visible, at the same time, from the front and the back side of the painting (Fig. 3). The camera used for the survey was a Nikon D3X featuring a 24 megapixel full-frame CMOS sensor (6 m pixel size). Given the requirements of sub-millimeter accuracy for 3D geometry and 0.2 mm spatial resolution for the texture, a photographic scale of 1:30 was selected. With such scale, the ground sample distance (GSD) of the images was about 0.18 mm. A 50 mm prime lens was mounted on the Nikon camera yielding to a camera-to-object distance of about 1.5m. The camera’s autofocus was disabled and the lens focusing ring fixed with a piece of insulating tape to avoid accidental changes of interior orientation parameters during the photogrammetric survey. In order to maximize the rapidity of the photogrammetric survey and achieve high accurate results, an automatic photogrammetric approach including self-calibration was planned for each painting. To avoid projecting coupling between interior and exterior orientation parameter due to the The International Archives of the Photogrammetry, Remote Sensing and Spatial Information Sciences, Volume XL-5, 2014
flat shape of the object a proper camera network was planned including convergent and rotated images.
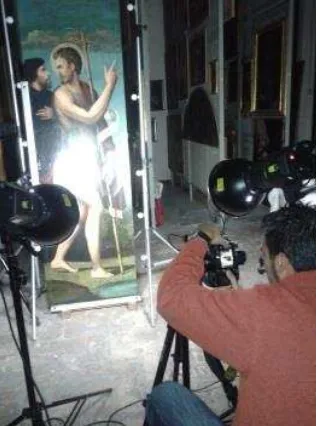
Figure 3. Photographic setup for the Saint John the Baptist painting with two lights symmetrically on the sides of the camera.
This step is mandatory if reliable results are expected and to avoid a degradation of object points precision (Fraser, 1982; Kraus, 1997; Nocerino, 2013, 2014). In all the photogrammetric projects, two scale bars in horizontal and vertical positions were placed at the bottom and aside the painting. The paintings were properly lighted up using two calibrated photographic lamps. To reduce the specular reflections, images were acquired using polarized lights. Images were mandatorily taken on a stable tripod and each image was checked for possible blur presence caused both from very long exposure time and from limited depth of field. Indeed, in this project using an aperture value of f/16 the expected depth of field resulted about 340 mm (considering a circle of confusion of 12 m that is also the diffraction limit for the selected aperture value). The extension of depth of field is an important additional parameter that must be considered when surveying a heritage asset in quasi macro photogrammetry (Menna et al., 2012).
The images were automatically processed using Agisoft Photoscan, the extracted tie points were filtered and reduced in number using the procedure proposed by Nocerino et al. (2013, 2014) which takes into account multiplicity of rays and their spatial distribution. The filtering procedure was necessary to keep only well distributed reliable points and to reduce the computational time when using standard bundle adjustment software. Tie points were then imported in Photomodeler and a self-calibrating bundle adjustment was run to obtain main statistical values and inter-correlations between camera parameters (all values missing in Photoscan).
For the Saint John the Baptist painting, at the end of the bundle adjustment, the automatic tie point extraction on the painting surface achieved a RMSE of image observations of 0.45 pixels. The average spatial precision of the derived 3D coordinates was 0.035 mm on the painting plane and 0.075 mm along the depth axis, corresponding to a relative global precision of 1:52,000 (Fig. 4-middle). High redundancy with up to 25 rays per each tie point was achieved (Fig. 5-right). For the other paintings similar values were obtained.
The centres of the spheres were marked using the semi-automatic tool implemented in Photomodeler. It is not clear from software documentation if the semi-automatic algorithm is able to remove the eccentricity of imaged spheres. Given the high RMSE residuals of about 0.9 pixels on the spheres, it is likely that the eccentricity remains uncorrected. The average 3D precision of the spheres was respectively 0.1 mm on the painting plane and 0.2 mm along the depth axis, corresponding to a relative global precision of 1:9,100. Further analyses are being carried out to improve the accuracy of spheres marking using an in-house developed algorithm.
The front and the back of the paintings were merged in an unique reference frame after computing a similarity transformation by means of the spheres. For the Saint John the Baptist painting, the average RMS of residuals of the transformation was about 0.4 mm in the paintings plane and 0.2 mm orthogonally to it. The differences between expected precision and residuals from the similarity transformation indicates that some systematic effects are present in 3D computation of spheres’ centers.
Figure 4. Photogrammetric processing of the Saint John the Baptist images. Left: distribution of the automatically extracted tie points over an image and some of the (ten) spheres used for connecting the back and front of the painting. Middle: camera network geometry and tie points in 3D - colors represent the estimated spatial precision (sigma xyz) of the derived 3D coordinates (units in mm). Right: color-coded visualization of the multiplicity
of the derived sparse point cloud, i.e. number of images in which each 3D point is visible.
a)
b)
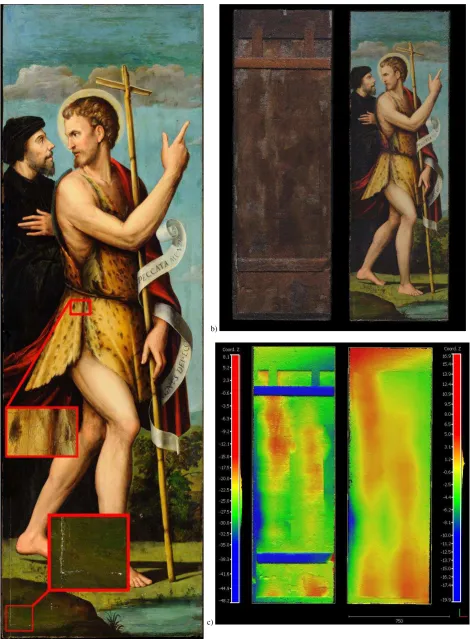
c)
Figure 5. Analysis of the Saint John the Baptist painting. A 0.2 mm resolution orthophoto with closer views of some hairline fractures (a). Coloured dense point clouds of both sides of the painting, ca 3 mil. points per side (b). 3D coordinates of the photogrammetric dense point cloud coded
according to the distances from the least square plane computed on the painting surface (c).
A dense image matching procedure was afterwards run in Photoscan with a sampling interval of 0.7 mm producing a point cloud of about 3 million points per side. An orthophoto with a spatial resolution of 0.2 mm/pixel was also produced (Fig. 5 - a) and available online through HDview free plugin
(http://www.afs.enea.it/project/graphlab/hd/francia/battista_fran
cia.htm).
6. FEATURES AND DEFORMATION ANALYSES
The produced 3D models were then inspected and analyzed to identify any features not visible at first sight. During the initial visual inspection the Cretan icon showed significant bending toward the borders, whereas the Saint John the Baptist painting didn’t show any apparent deformation.
To enhance hidden characteristics, some shading algorithms were applied. Inlays were identified in the lateral and upper part of the painting (noticeable also during visual inspection) and at the bottom, which were not evident. Assuming the original planarity of the wooden support of the Saint John the Baptist painting, a best fitting procedure was run. The result shows a slight deformation which reaches its negative and positive peaks on the lower left side (19.9 mm) and on left up corner (16.9 mm) for a maximum absolute range of about 37 mm (the entire painting spans ca 198 x 62.5 cm). By modelling in three-dimensions both the front and back of the paintings in a unique reference system it is possible to correlate the observed deformation pattern for further restoration interventions. In Figure 5b and 5c the front and back parts of the painting are shown side by side. The back has been flipped horizontally to be compared directly with the front. The deformation pattern seems to be quite dependent on the wooden frame on the back, especially in the upper part.
The evident deformation of the Cretan icon (Fig. 1b) translates into a characteristic colour pattern of deformation (Fig. 6) and was assessed in the order of ~17 mm.
The oil on canvas by Ludovico Cavalieri was visualized with different shading techniques (Fig. 7). Surface details (i.e. brush strokes) were highlighted revealing elements of the author’s artistic style as well as providing elements for the restoration process (detachment, loss of pigments, etc.).
7. CONCLUSIONS
The article reported a study on 3D range- and image-based techniques used to provide for an efficient cost-effective non-invasive procedure for a systematic 3D recording and multi-temporal monitoring of paintings. High resolution orthoimages were obtained from the photogrammetric method to identify and document fine fractures of painting surfaces. A method for inspecting the colour degradation over time is being also implemented using the procedure exposed in (Remondino, 2011). Systematic orthophoto, generated at different epochs, will be compared by supervised inspections and with automatic methods.
Shading techniques were also used for exploiting the potentialities of 3D techniques in characterizing authors’ style. As already stated, the choice of the right digitization technique is fundamental but it’s primarily dictated by the final goal of the project and considering time, local constraints, required accuracy and budget.
The structured light technique allows to acquire highly accurate and reliable geometric data at a very fast speed (acquisition time of ca 1 second per range map in fast mode). Drawbacks are
represented by the cost of the active sensor, its transportability, the need of a powerful computer for data processing (a workstation 8 double cores, 24 GB RAM was used) and, normally, a time consuming post-processing phase (for example the Cretan icon required 2 hours of data acquisition and ca two days of post-processing – the same artwork needed ca 30 min for the image acquisition and 2 hours of post-processing). A low-quality texture (with respect to SLR cameras), often influenced by the environmental conditions, is generally achieved however a separate photographic setup can be realized where possible.
Figure 6. Cretan icon: an image of the artwork with the spheres and bars used during the photogrammetric processing (above). The result of the
best fitting plane of 3D coordinates (in mm) obtained with the structured light system (below).
Figure 7. Oil on canvas by Ludovico Cavalieri: an image of the artwork (above) and the structured light system’s 3D model visualized in shaded mode (below). The brush strokes are clearly visible thanks to the
sub-millimetre geometric resolution of the digitization.
On the other hand, photogrammetry has the advantage of being a cheap and flexible technique able to fulfil a broad range of different resolution and accuracy specifications but it requires good photographic expertise to properly set up lights and acquire the images.
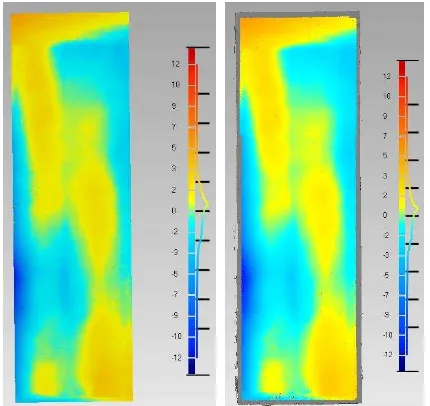
Nevertheless, in our tests, both techniques were successful in delivering results featuring the required sub-millimetre accuracy. Indeed the comparison of the result achieved through 3D scanning and photogrammetry showed similar results in terms of spatial accuracy (Fig. 8).
Figure 8. Deformation analysis on the Saint John the Baptist painting assuming a planar shape of the artwork. Photogrammetric 3D model (left) and structured light scanner 3D model (right).
ACKNOWLEDGEMENTS
The research team would like to thank the staff of Pepoli-Campogrande museum in bologna (Italy), especially Mr. Pasquale Minopoli, for all the support given during the photogrammetric and 3D scanning surveying. A special thanks also to Manfrotto, a Vitec Group company, for providing the photographic materials (lights, clamps, tripods, etc.) used in the photogrammetric surveys.
REFERENCES
Akca, D., Gruen, A., Breukmann, B., Lahanier, C., 2007. High definition 3D-scanning of art objects and painting. Proc. Optical 3D Measurement Techniques Conference, Vol.2, pp. 50-58.
Barazzetti, L., Remondino, F., Scaioni, M., Lo Brutto, M., Rizzi, A., Brumana, R., 2010. Geometric and radiometric analysis of paintings. Int. Archives of Photogrammetry, Remote Sensing and Spatial Information Sciences, Vol. 38(5), pp.62-67, ISPRS Commission V Symposium, Newcastle upon Tyne, UK.
Blais, J., Taylor, F., Cournoyer, L., Picard, M., Borgeat, Godin, L., Beraldin, J.-A., Rioux, M., Lahanier, C., 2007. Ultra high-resolution 3D laser color imaging of paintings: the Mona Lisa by Leonardo da Vinci. Proc. 7th Inter. Conference on Lasers in the Conservation of Artworks, pp. 435-440, Madrid.
Blais, F., Cournoyer, L., Beraldin, J.-A., Picard, M., 2008. 3D imaging from theory to practice: the Mona Lisa story. Proc. SPIE 7060, Current Developments in Lens Design and Optical Engineering IX, 70600L. Breuckmann, B., 2011. 3-dimensional digital fingerprint of paintings. Proc. 19th European Signal Processing Conference (EUSIPCO 2011), pp. 1249-1253, Barcelona, Spain.
D'Amelio, S., Lo Brutto, M., 2009. Close range photogrammetry for measurement of painting surface deformations. Int. Archives of Photogrammetry, Remote Sensing And Spatial Information Sciences, Vol.38(5/W1), pp. 1-6.
Fontana, R., Gambino, M.C., Greco, M., Marras, L., Materazzi, M., Pampaloni, E., Pelagotti, A., Pezzati, L., Poggi, P., 2005. 2D imaging and 3D sensing data acquisition and mutual registration for painting conservation. Proc. SPIE Videometrics VIII, pp. 51-58.
Fraser, C. S., 1984. Network design considerations for non-topographic photogrammetry. Photogrammetric Engineering and Remote Sensing, Vol. 50(8), pp. 1115-1126.
Kraus, K., 1997. Photogrammetry. Volume 2: Advanced Methods and Applications. Ferd-Dümmlers Verlag.
Granero-Montagud, L., Portalés, C., Pastor-Carbonell, B., Ribes-Gómez, E., Gutiérrez-Lucas,A., Tornari, V. Papadakis, V., Groves, R.M., Sirmacek, B., Bonazza, A., Ozga, I., Vermeiren, J., van der Zanden, K., Föster, M., Aswendt, P., Borreman, A., Ward, J.D., Cardoso, A., Aguiar, L., Alves, F., Ropret, P., María Luzón-Nogué, J., Dietz, C., 2013. Deterioration estimation of paintings by means of combined 3D hyperspectral data analysis. Proc. SPIE Vol.8790, 879008.
Guidi, G., Atzeni, C., Seracini, M. Lazzari, S., 2004. Painting survey by 3D optical scanning: The case of Adoration of the Magi by Leonardo da Vinci. Studies in Conservation, Vol.49, pp. 1-12.
Lahanier, C., Aitken, G., Pillay, R., Beraldin, J.-A., Blais, F., Borgeat, L., Cournoyer, L., Picard, M., Rioux, M., Taylor, J., Breuckmann, B., Colantoni, P., de Deyne, C., 2008. Two-dimensional multi-spectral digitization and three-dimensional modelling of easel paintings. Report, NRC Publication Archive.
Luhmann, T., Wendt, K., 2000. Recommendations for an acceptance and verification test of optical 3-D measurement systems. Int. Archives of Photogrammetry and Remote Sensing. Vol. 33(B5), pp. 493-500. Menna, F., Rizzi, A., Nocerino, E., Remondino, F., Gruen, A., 2012. High resolution 3D modeling of the Behaim globe. Int. Archives of Photogrammetry, Remote Sensing and Spatial Information Sciences, Vol. 39(5), pp. 115-120. XXII ISPRS Congress, Melbourne, Australia. Mibac, 1999. Works of art of historical importance. Ambient conditions for the conservation. Measurement and analysis UNI. Nocerino, E., Menna, F., Remondino, F., Saleri, R., 2013: Accuracy and block deformation analysis in automatic UAV and terrestrial photogrammetry - Lesson learnt. ISPRS Annals of the Photogrammetry, Remote Sensing and Spatial Information Sciences, Vol. II(5/W1), pp. 203-208. Proc. 24th Intern. CIPA Symposium, 2–6 Sept., Strasbourg, France.
Nocerino, E., Menna, F., Remondino, F., 2014. Accuracy of typical photogrammetric networks in cultural heritage 3D modeling projects. Int. Archives of Photogrammetry, Remote Sensing and Spatial Information Sciences, Vol. 40(5), in press.
Remondino, F., Rizzi, A., 2010. Reality-based 3D documentation of natural and cultural heritage sites – Techniques, problems and examples. Applied Geomatics, Vol.2(3), pp. 85-100.
Remondino, F., Rizzi, A., Barazzetti, L., Scaioni, M., Fassi, F., Brumana, R., Pelagotti, A., 2011. Review of geometric and radiometric analyses of paintings. The Photogrammetric Record, Vol. 26(136), pp. 439-461.
Robson, R., Bucklow, S., Woodhouse, N., Papadaki, H., 2004. Periodic photogrammetric monitoring and surface reconstruction of a historical wood panel painting for restoration purposes. Int. Archives of Photogrammetry, Remote Sensing and Spatial Information Sciences, Vol. 35(B5), pp. 395-400.
VDI/VDE 2634/PART2, 2002. Optical 3-D Measuring Systems – Optical Systems based on Area Scanning
VDI/VDE 2634/PART3, 2008. Optical 3-D Measuring Systems – Multiple View Systems based on Area Scanning