3D geospatial modelling and visualization for marine environment: Study of the marine
pelagic ecosystem of the south-eastern Beaufort Sea, Canadian Arctic
J. Sahlina,*, M. A. Mostafavia, A. Forestb, M. Babinb, B. Lansardc
a
Dept. of Geomatic Sciences, Université Laval, Québec, Canada - [email protected], [email protected]
b
Takuvik Joint International Laboratory, Université Laval (Canada) - CNRS (France), Département de Biologie and Québec-Océan, Université Laval, G1V 0A6, Canada - (Alexandre.Forest, Marcel.Babin)@takuvik.ulaval.ca.
c
LEGOS, Laboratoire d’Études en Géophysique et Océanographie spatiales, CNRS-UPS-CNES, 31400 Toulouse, France - [email protected]
KEY WORDS: GIS, Oceanography, Visualization, Spatial, Modelling, Three-dimensional, Interpretation
ABSTRACT:
Geospatial modelling of the marine pelagic ecosystem is challenging due to its dynamic and volumetric nature. Consequently, conventional oceanographic spatial analysis of this environment is in a 2D environment, limited to static cutting planes in horizontal and vertical sections to present various phenomena. In this paper, we explore the contribution of recent 3D development in GIS and in scientific visualization tools for representation and analyses of oceanographic data sets. The advantages of a 3D solution are illustrated with a 3D geospatial voxel representation of water masses distribution in the southeastern Beaufort Sea (west of the Canadian Arctic).
1. INTRODUCTION
Oceans cover 71% of the Earth's surface and with an average depth of approximately 4000 m, the volume of the marine pelagic ecosystem (water column) represent 99% of the biosphere (Angel, 1993). From a geospatial modelling perspective, this environment imposes different challenges compared to the terrestrial system. Whereas the latter is most often represented as an empty space filled with object (trees, houses etc...), the pelagic ecosystem is a continuous abiotic and biotic spatial geographical phenomenon in a full three-dimensional (3D) environment. Study of the marine ecosystem, as well as management and conservation of marine resources, can be enhanced with adequate geospatial 3D modelling.
Traditional Geographic Information Systems (GIS), that are leading tools for the study and observation of spatial data, are not suitable to model geoscientific datasets since they have been principally designed for static and two-dimensional (2D) objects in terrestrial applications (Carette et al., 2008; Ledoux and Gold, 2008; Wright and Goodchild, 1997). Nevertheless, recent 3D GIS development justifies an update of their potential for marine pelagic geospatial modelling. Although lacking much of the flexibility in data management and ease of use of GIS, various specific scientific visualization tools have also been developed for modelling of the geologic subsoil, mainly motivated by oil and gas industry. These geomodelling tools are interesting from an oceanographer’s perspective in that they treat, at least partially, the same type of continuous field as we find in the pelagic ecosystem.
*
In this paper, we first analyse and compare the capacity of different GIS tools for representation, visualization and analysis of a 3D dynamic marine environment. Specifically, we conduct a qualitative comparison between capacities of commercial GIS, commercial marine GIS, and academic prototype GIS as well as geomodelling tools (section 2). We demonstrate how recent
*
Corresponding author.
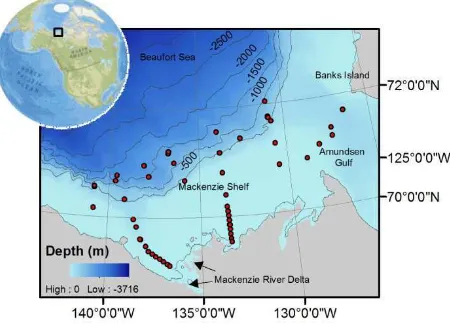
development in 3D spatial modelling tools can improve representation, visualization and analyses of oceanographic phenomena and highlight some improvements that should be carried out to these tools in order to achieve an optimal marine spatial modelling tool. Finally, we propose an integration of the benefits from 3D geomodelling tools with advantages of GIS to improve 3D spatial modelling of oceanographic data sets. The third part of the paper is devoted to a case study proposing a 3D solution to visualization of water masses distribution in the southeastern Beaufort Sea (west of the Canadian Arctic). The data for this case study were obtained from the Malina oceanographic campaign conducted over the Mackenzie shelf between the 31th of July and 26th of August in 2009 (Figure 1). More detailed information about the Malina campaign can be found elsewhere (e.g. Matsuoka et al. 2012).
Figure 1. Location of sampling stations for the Malina cruise in the Beaufort Sea, Canadian Arctic.
International Archives of the Photogrammetry, Remote Sensing and Spatial Information Sciences, Volume XXXVIII-4/C26
2. 3D SPATIAL REPRESENTATION O ECOSYSTEM
Pelagic marine features are characterize boundaries, dynamic, and full 3D structure 1995; Shyue and Tsai, 1996). These restrictive for data acquisition, as well modelling and representation. A furth oceanographic data sets is the frequent anis of data, due primarily to logistics and co expensive sampling at sea. Development of 3D geospatial modelling of the marine pe consequently challenging. This might explai analysis of oceanographic phenomena is tr environment, limited to static cutting plane vertical sections either contoured or colou various parameters (Head et al., 1997).
Oceanic physical parameters, such as tempe define distinct water masses with more or les Vertical and horizontal distribution of th influences the oceanic carbon cycles, whi important role in regulating global cli objective of the Malina oceanographic cam better understanding of these interactions. spatial analyses in a 3D geospatial model o can then be of great value. Such a model co use in a resource management or conservatio
A summary of some common and specialise this work are listed in Table 1. These ha according to criteria for their suitability modelling of the pelagic environment. Th
Criteria ArcGIS 10
Commercial GIS 3D Interpolation - 3D raster representation - 3D vector representation
Visualization cuts - Visualization iso-surfaces - Visualization volumes - 3D statistical analyses - 3D spatial analyses -
Table 1. Review of five geospatial m
3. 3D GEOSPATIAL SOLUTI REPRESENTATION OF WATER DISTRIBUTION: MALINA CAS
In the south-eastern Beaufort Sea, several typ can be identified, such as the nutrient Halocline Water (UHW). The fractional pre obtained for each of the 243 sampling accordingly to a method described by Lans geospatial voxel model of this water mass w Paradigm GOCAD, a scientific visualization 3D geological spatial modelling. This spati by a grid of 150 x 75 x 100 voxels in x, compressed vertically between water surfa surface. UHW values were attributed to each through a 3D interpolation of sampling po kriging.
OF THE PELAGIC
ized by their fuzzy re (Gold and Condal, e characteristics are ell as for geospatial rther problem with nisotropic distribution costs associated with of tools available for pelagic ecosystem is lain why conventional traditionally in a 2D anes in horizontal and lour-coded to present
perature and salinity, less fuzzy boundaries. these water masses hich in turn play an climate. One partial campaign was to gain ns. Visualization and l of these phenomena could also be of good
tion perspective.
lised tools reviewed in have been evaluated ty for 3D geospatial This review indicates
that recent efforts of 3D develop mostly focused on object centred co structures (for example: ArcGIS Indeed, several research teams h adequate 3D marine GIS (Arsenau 2009). We consider that an adequ pelagic continuous phenomena volumetric field representations. T more developed in geomodelling t the use of 3D raster-based mode voxel (VOlume piXEL) structures beginning of 1990, they are still GIS (the GIS open-source GRA exception to this generality, offerin It is also worth noticing that the m Voronoï tessellations, whose adva various academic works (Beni et 2008), are absent so far in comm tools. A draw-back with the geomo paper is its limited ability for im imperative in oceanographic resea use of remote sensing. Another ess marine geospatial modelling tool static cuts in vertical direction. E might seem trivial and does not re method, this operation is not poss and very limited with EnterVol ArcGIS that permits volumetric Finally, none of the tools eval consideration the dynamic natur pelagic phenomena or to assess a of spatial 3D models, such as cross 2007).
Fledermaus HabitatSpace CTech EnterVol Commercial
marine GIS
Academic
prototype GIS Extension to ArcGI Limited (Kriging) Kriging (limited), ID Limited
? Limited
- Limited
- ?
- Limited
l modelling tools from commercial and academic GIS as well a
TION TO ER MASSES ASE STUDY
types of water masses t rich pacific Upper presence of UHW was ing points (x, y, z) nsard et al. (2012). A s was constructed with ion tool developed for atial model was built x, y, z direction and rface and bathymetric ach voxel in the model points with ordinary
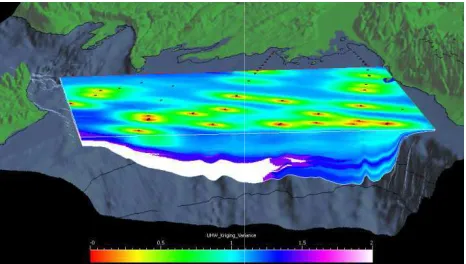
Figure 2. Kriging variance of sp Upper Halocline Water in the Beau
sampling p
lopment in the GIS field have conceptual design using vector IS version 10, Fledermaus). have recognized the lack of ault et al., 2004; Mesick et al., quate representation of marine na needs fully developed ring limited volume rendering). more dynamic data structures -vantages have been stressed in et al., 2011; Ledoux and Gold, mmercial geospatial modelling modelling tool reviewed in this image treatment and analyses, search considering the common essential function for an optimal ool is the visualization of 2D . Even though such a function require a true 3D interpolation ossible at present with ArcGIS ol, commercial extension to tric representation (Table 1). valuated permit to take into ture and fuzzy boundaries of a general predictive capability oss-validation (e.g. Foglia et al.
ol Paradigm Gocad
cGIS Geomodelling tools
, IDW Kriging, IDW, other.
ll as from geomodelling.
spatial 3D model for pacific Beaufort Sea. Black dots indicate
points.
International Archives of the Photogrammetry, Remote Sensing and Spatial Information Sciences, Volume XXXVIII-4/C26
The kriging variogram’s dependent predictiv in Figure 2. In general, the lower the e location, the better is the prediction of the sp
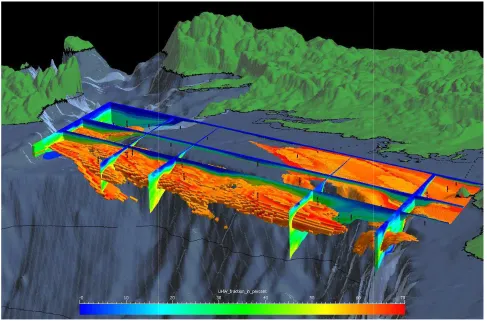
The final spatial model permits us to visual volumes as well as cuts in any plane of the
Figure 3. Geospatial representation of Up approximately the upper 500 m of the constituted of UHW and voxels containing
black dots. Vertical exaggeration in fig
4. DISCUSSION AND CONCL
This research has explored the potential modelling tools for the study of marine pel review of common GIS indicates that these mostly lack the necessary functions representation of gradual phenomena, primo study of marine ecosystems. However geomodelling tools for representation of t promising, which is illustrated in this paper 3D solution to visualization of a water mass Beaufort Sea, constructed with Paradigm Integration of volumetric representation in a an important advance towards an optimal ma must also include representation and analys static vertical cuts. On the contrary, geomo be adapted to the marine environment b functions for oceanographic research such and analyses. However, all spatial modelling the pelagic environment would also bene spatial data structure that takes into conside nature and fuzzy boundaries of the pelagic en
ctive error is presented error for a specific spatial model.
alize iso-surfaces and he water mass (Figure
3) and enables spatial 3D analyses and intersection. This case study s volumetric representation develope tools can be used to extend usual i pelagic phenomena from 2D st environment.
pper Halocline Water on the Mackenzie shelf in summer 2009 e water mass contained within the spatial model. Scale indicat ing more than 60 % of UHW are coloured-filled. Visible samp figure is 75 times that of reality. Spatial model was constructed
CLUSIONS
ial of 3D geospatial pelagic ecosystems. A ese software products ns for volumetric mordial for geospatial ver, performance of f this environment is er by a snap-shot of a ss in the south-eastern m Gocad (Figure 3). a GIS environment is marine GIS. This tool lyses functions of 2D modelling tools could by improving basic ch as image treatment ing tools conceived for enefit from including ideration the dynamic environment.
Our future research will explor geospatial modelling tools for the ground data in the identification organic carbon fluxes in the Beaufo
5. ACKNOWLED
The authors are grateful for the pa this project from Natural Science Council of Canada.
6. REFEREN
Angel, M. V, 1993. Biodivers Conservation Biology, 7(4), pp. 760
Arsenault, R., C. Ware, M. Plumlee D. Wiley, T. Gross and A. Bi visualizing time varying oceanogra
ses, such as volume calculation y shows that recent advances in ped primarily for geomodelling al interpretation of static marine static planes to a true 3D
009. This snapshot illustrates cates fraction (%) of water mpling points are indicated by
ted with Paradigm Gocad.
lore the contribution of 3D he combination of satellite and on of biological hot-spots and ufort Sea.
LEDGEMENTS
partial financial contribution to ces and Engineering Research
ERENCES
ersity of the pelagic ocean. 760-772.
lee, S. Martin, L. L. Whitcomb, Bilgili, 2004. A system for graphic 3D data. In: Oceans '04
International Archives of the Photogrammetry, Remote Sensing and Spatial Information Sciences, Volume XXXVIII-4/C26
Mts/Ieee Techno-Ocean '04, Vols 1- 2, Conference Proceedings, Kobe, Japan, pp. 743-747.
Beni, L. H., M. A. Mostafavi, J. Pouliot and M. Gavrilova, 2011. Toward 3D spatial dynamic field simulation within GIS using kinetic Voronoi diagram and Delaunay tetrahedralization. International Journal of Geographical Information Science, 25(1), pp. 25-50.
Carette, V., M. A. Mostafavi and R. Devillers, 2008. Towards Marine Geographic Information Systems: Multidimensional Representation of Fish aggregations and Their Spatiotemporal Evolutions. In: Oceans 2008, Vols 1-4, pp. 531-540.
Foglia, L., S. W. Mehl, M. C. Hill, P. Perona and P. Burlando, 2007. Testing alternative ground water models using cross-validation and other methods. Ground Water 45(5), pp. 627-641.
Gold, C. and A. R. Condal, 1995. A spatial data structure Integrating GIS and Simulation in a Marine Environment. Marine Geodesy, 18, pp. 213-228.
Head, M. E. M., P. Luong, J. H. Costolo, K. Countryman and C. Szczechowski, 1997. Applications of 3-D visualizations of oceanographic data bases. Paper presented at Oceans '97 Mts/Ieee Conference Proceedings, Vols. 1-2, pp. 1210-1215.
Lansard, B., A. Mucci, L. A. Miller, R. W. Macdonald, and Y. Gratton, 2012. Seasonal variability of water mass distribution in the southeastern Beaufort Sea determined by total alkalinity and δ18O, Journal of Geophysical Research, Vol 117, 19 p.
Ledoux, H. and C. M. Gold, 2008. Modelling three-dimensional geoscientific fields with the Voronoi diagram and its dual. International Journal of Geographical Information Science, 22(5), pp. 547-574.
Matsuoka, A., Bricaud, A., Benner, R., Para, J., Sempéré, R., Prieur, L., Bélanger, S. and M. Babin, 2012. Tracing the transport of colored dissolved organic matter in water masses of the Southern Beaufort Sea: relationship with hydrographic characteristics, Biogeosciences, 9, pp. 925-940.
Mesick, S. M., T. C. Vance, C. J. Beegle-Krauss and D. Steube, 2009. HabitatSpace: Multidimensional Characterization of Pelagic Essential Fish Habitat. In: Oceans 2009, Vols 1-3, pp. 1953-1961.
Shyue, S. W., and P. Y. Tsai, 1996. A study on the dimensional aspect of the marine geographic information systems. Paper presented at Oceans '96 Mts/Ieee, Vols 1-3 / Supplementary Proceedings: Coastal Ocean - Prospects for the 21st Century, pp. 674-679.
Wright, D. J., and M. F. Goodchild, 1997. Data from the deep: Implications for the GIS community. International Journal of Geographical Information Science, 11(6), pp. 523-528.
International Archives of the Photogrammetry, Remote Sensing and Spatial Information Sciences, Volume XXXVIII-4/C26