__________________________________________
* Corresponding authorSOFT COMPUTING APPROACH FOR LIQUEFACTION IDENTIFICATION USING
LANDSAT-7 TEMPORAL INDICES DATA
Sengar S.S.a, Kumar A.b, *, Ghosh S. K.a, and Wason H. R.a
a
Indian Institute of Technology, Roorkee, India-(sandydeq, scangfce, wasonfeq) @iitr.ernet.in
bIndian Institute of Remote Sensing, Dehradun, [email protected]
KEY WORDS: Earthquakes, Landsat, Accuracy, Temporal Indices Data
Working Group VIII/1
ABSTRACT:
A strong earthquake with magnitude Mw7.7 that shook the Indian Province of Gujarat on the morning of January 26, 2001, caused widespread appearance of water bodies and channels, in the Rann of Kachchh and the coastal areas of Kandla port. In this work, the impact of using conventional band ratio indices from Landsat-7 temporal images for liquefaction extraction was empirically investigated and compared with Class Based Sensor Independent (CBSI) spectral band ratio while applying noise classifier as soft computing approach via supervised classification. Five spectral indices namely, SR (Simple Ratio), NDVI (Normalized Difference Vegetation index), TNDVI (Transformed Normalized Difference Vegetation Index), SAVI (Soil-Adjusted Vegetation Index) and Modified Normalized Difference Water Index (MNDWI) were investigated to identify liquefaction using temporal multi-spectral images. It is found that CBSI-TNDVI with temporal data has higher membership range (0.968-0.996) and minimum entropy (0.011) to outperform for extraction of liquefaction and for water bodies extraction membership range (0.960-0.996) and entropy (0.005) respectively.
1. INTRODUCTION
With the advent of operational remote sensing it is now possible to efficiently and accurately map earthquake induced ground changes including the appearance of water bodies and changes in soil moisture conditions. During the earthquake, strong shaking produced liquefaction in the fine silts and sands below the water table in the Rann of Kachchh. Digital image classification is a fundamental image processing operation to extract land cover information from remote sensing data and it assigns a class membership for each pixel in an image. Often, particularly in coarse spatial resolution images, the pixels may be mixed containing two or more classes. Soft classification methods may help in quantifying uncertainties in areas of transition between various types of land cover. Fuzzy classifications may be beneficial where a mixed pixel may be assigned multiple class memberships.
Till date many researchers in remote sensing field have applied time series indices to study cropping pattern. Nianlong et al., (2010), applied time series NDVI data to identify land use classification. Wardlow and Egbert, (2008), used a hierarchical crop mapping to classify multi-temporal NDVI data. Lucas et al., (2007), studied the use of time-series Landsat sensor data using decision rules based on fuzzy logic to discriminate vegetation type. Based on past research works it indicates that researchers have used multi-spectral, hyper-spectral as well as microwave data for specific land use/land cover (LULC) identification while using temporal data sets with importance of different indices.
Kumar and Roy, (2010), has worked with add on bands in multi-spectral dataset of Worldview -2. This work has proposed class based sensor independent spectral band ratio NDVI approach for extracting a crop at a time. Ramakrishnan et al., (2006), map the earthquake induced liquefaction around
the Bhuj, by calculating the absorption of energy in the NIR and SWIR region of electromagnetic spectrum. Saraf et al., (2002), used picture colour transformation of IRS-1D band 4 data to map liquefaction of Bhuj. Mohanty et al., (2001) and Singh et al., (2001), used image differencing to find liquefaction.
A lot of work has been done in the field of single class extraction through time series multi-spectral data but while going through the literature it has been identified that to find liquefaction using various indices with noise classifier has not been explored in the past. In this study it has been tried to identify liquefaction using temporal indices.
2. INDICES AND CLASSIFICATION APPROACHES
For generating band ratio data, it is important to know various types of band information present in multi-spectral data. Based on spectral information of remote sensing data, the user has to decide which spectral bands of data are to be used in different band ratio functions and require expert knowledge.
2.1 CBSI Spectral Band Ratio
To overcome the need for expert knowledge about remote sensing data, in this work a CBSI spectral band ratio has been proposed in eq. (1).
CBSI spectral band ratio = k (1)
where; g is grey value, r and c are row and column of a class location respectively, n denotes number of bands, k denotes number of classes.
International Archives of the Photogrammetry, Remote Sensing and Spatial Information Sciences, Volume XXXIX-B8, 2012 XXII ISPRS Congress, 25 August – 01 September 2012, Melbourne, Australia
Here, the user has to provide the location of a class in the form of row and column or latitude and longitude. Based on class location, spectral information as grey value from all the bands will be read and using minimum, maximum operators to find out which bands have minimum, maximum gray values to establish maximum range in spectral difference. Then these bands are used in indices by setting that band having minimum grey value as well as maximum grey value band. Here a simple condition is also applied that if indices values were negative then replace it with zero value. This enhances the concerned class of interest and only requires geo-location of a class, while spectral remote sensing data information is not required.
2.2 Noise Classifier
Dave (1991), introduced concept of "Noise Cluster' such that noisy data points may be assigned to the noise class. The approach is developed for objective functional type (fuzzy K-means) algorithms and its ability to detect 'good' clusters amongst noisy data is demonstrated. The classification performance is evaluated by criteria such as the accuracy and reliability. These criteria cannot show the exact quality and certainty of the classification results. This study proposes the noise classifier, as a special criterion for visualizing and evaluating the uncertainty of the results. The class membership matrix for a class and for noise present is given by; zero. The objective function, which satisfies this requirement, may be formulated as; band ratios along with a special form of noise classifier; impact the accuracy ofthe temporal liquefaction classification. For this the automatic land cover mapping approach (ALCM) module from, SMIC: Sub-Pixel Multi-Spectral Image Classifier package (Kumar et al., 2010) has been used. The ALCM module has capability to process multiple multi-spectral images for single land cover class extraction at sub-pixel level using supervised approach.
2.3 Entropy Analysis
The uncertainty affects the extracted information quality in remote sensing and propagates in processing, transmitting and classification processes. Usually, the classification performance is evaluated by criteria such as the accuracy and reliability. These criteria cannot show the exact quality and certainty of the classification results. This study uses the entropy, as a special criterion for visualizing and evaluating the uncertainty of the results. To have a global measure of uncertainty (fuzziness) for the whole dataset, the mean index of fuzziness (IF) can be computed from Eq (5);
IF = (5)
where IF values range from 0.0 (no uncertainty) to 1.0 (complete uncertainty). Thus, these measures may allow depiction of the uncertainties in the datasets, which can either be a classified image (i.e. soft classification outputs) or the reference data (Ibrahim et al. 2005, Hamid and Hassan 2006).
2.4 Test Data and Study Area
The remote sensing data used for this work was Landsat-7
satellite multispectral two date’s (Jan’8, 2001 and Fab’9, 2001)
temporal data from ETM+ sensor. To create multispectral data 6 spectral bands {blue (0.45-0.515 μm), green (0.525-0.605 Gujarat state of India for liquefaction identification. To separate liquefied area with pre-earthquake existing water bodies with boundary coordinates Lat 23o13’N-23o16’N and Long 70o05’E -70o09’E was taken.
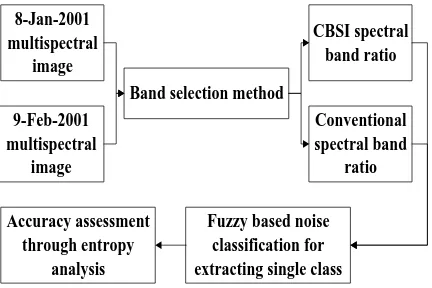
3. METHODOLOGY
There has been requirement for identifying only one class that is, liquefaction, in Kachchh area. Keeping this in mind, the work was divided into four steps as shown in figure 1.
8-Jan-2001
Firstly both pre and post earthquake Landsat-7 multispectral images were identified. To create the models of all band ratio indices, ERDAS Model Maker was used. Initially, an attempt have been made with conventional spectral band ratio temporal indices, later on, CBSI spectral band ratio indices from International Archives of the Photogrammetry, Remote Sensing and Spatial Information Sciences, Volume XXXIX-B8, 2012
XXII ISPRS Congress, 25 August – 01 September 2012, Melbourne, Australia
equation (1), applied on study area to identify liquefaction. The noise classifier was applied as supervised classifier to extract single class, liquefaction as well as water bodies separately. Finally the accuracy assessment through entropy analysis using equation (5) was done for both liquefaction and water bodies.
4. RESULTS AND DISCUSSION
This study mainly focuses on identifying the areas in and around Kachchh region with abnormal increase in liquefaction after the Bhuj earthquake in 2001. The basic principle behind using the satellite images in mapping the liquefaction changes is that electromagnetic spectrum absorbed by liquefied soil for different indices is different. Different indices help to distinguish reflectance of soils by its moisture content. The one class of interest, namely, liquefaction was studied for discrimination with background and especially separates it with water bodies in the study area.
Table 1. Temporal indices results for liquefaction identification
Table 2. Temporal indices results for water body identification
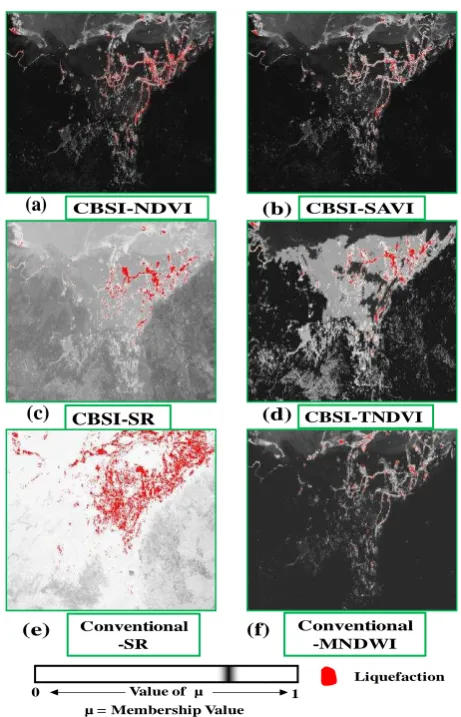
The NDVI, SAVI, SR and TNDVI band ratio techniques were applied on both images using CBSI spectral band ratio approach, while SR and MNDWI were used conventional method to find out liquefaction as well as water bodies. The region behind it is CBSI-MNDWI behaves like CBSI-NDVI; and conventional NDVI, SAVI and TNDVI gives negative
values for liquefaction identification. Only SR technique was used as CBSI as well as conventional approach because it use direct ratios between band 3 and band 7, and ratios between band 3 and band 4 respectively.
Value of µ 1
Figure 2. Different classified output for liquefaction identification
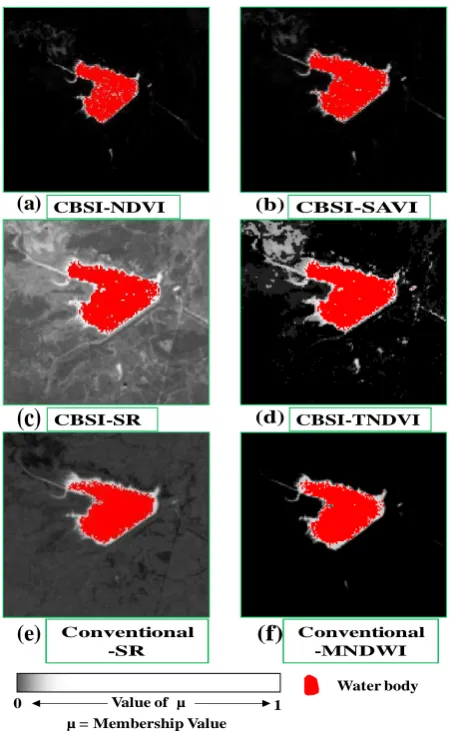
It was observed from table 1 for liquefaction identification, the temporal indices values of CBSI-SR and conventional SR shows higher correlation and CBSI-TNDVI shows least correlation. The CBSI-TNDVI shows least entropy (0.011) for liquefaction identification. As water bodies not changed in this period (Jan’8, 2001 and Fab’9, 2001) therefore the temporal indices values for water bodies not changed very much. For water bodies identification it is observed from table 2 that all temporal indices shows good results but CBSI-TNDVI shows least entropy (0.005). The classified outputs are shown in figures 1 and 2 for identifying liquefaction as well as water bodies respectively.
5. CONCLUSION
In this study, effect of different indices (CBSI and conventional) has been studied for extracting liquefaction as well as water bodies in the study area. From table 1, it was observed that temporal indices from NDVI, SAVI and TNDVI using CBSI method and conventional MNDWI show less correlation for liquefaction, implying these are outperform to identifying liquefaction. The results indicate from classified output and temporal indices values that CBSI-TNDVI is best
s For liquefaction identification
8
s For water body identification
8
International Archives of the Photogrammetry, Remote Sensing and Spatial Information Sciences, Volume XXXIX-B8, 2012 XXII ISPRS Congress, 25 August – 01 September 2012, Melbourne, Australia
for liquefaction (Entropy 0.011 and membership range 0.968-0.996) and water body (Entropy 0.005 and membership range 0.960-0.996) identification because it shows least correlation and higher membership value. The less membership range indicates here that the one class of interest can easily identify without merged with other class and less entropy indicate here that less uncertainty in one class of interest. This proposed technique will be suitable to identify liquefaction area in post earthquake studies in a short span of time.
(a)
(b)(c)
(d)(e)
(f)
Value of µ 1 0
µ = Membership Value
Water body
CBSI-NDVI CBSI-SAVI
CBSI-SR CBSI-TNDVI
Conventional -SR
Conventional -MNDWI
Figure 3.Different classified output for water-body identification
6. REFERENCES
Dave R. N. 1991. Characterization and detection of noise in clustering, Pattern Recognition Letters, 12, pp. 657-664.
Hamid D. and Hassan G. 2006. Measurement of uncertainty by the entropy: application to the classification of MSS data, International Journal of Remote Sensing, 27(18), pp. 4005-4014.
Ibrahim M.A., Arora M.K. and Ghosh S.K. 2005. Estimating and accommodating uncertainty through the soft classification of remote sensing data, International Journal of Remote Sensing, 26, pp. 2995–3007.
Kumar A., Ghosh S.K. and Dadhwal V.K. 2010. ALCM: Automatic land cover mapping, Journal of Indian remote sensing, 38, pp. 239-245.
Kumar A. and Roy P. S. 2010. Effects on specific crop mapping using worldview-2 Multispectral add on bands-A soft classification approach, Geospatial World Forum, Hyderabad.
Lucas R., Rowlands A., Brown A., Keyworth S. and Bunting P. 2007. Rule-based classification of multi-temporal satellite imagery for habitat and agricultural land cover mapping, ISPRS Journal of photogrammetry and Remote Sensing, 62(3), pp. 165-185.
Mohanty K.K., Maiti K. and Nayak S. 2001. Monitoring water surges, GIS Development, 3 , pp. 32–33.
Nianlong H.,Tingting L. and Chuang L. 2010. Using NDVI data for malaysia land use classification, ICACC 2010, pp. 187-190.
Ramakrishnan D., Mohanty K.K. and Nayak S.R., 2006. Mapping the liquefaction induced soil moisture changes using remote sensing technique: an attempt to map the earthquake induced liquefaction around Bhuj, Gujarat, India, Geotechnical and Geological Engineering 24, pp. 1581–1602.
Saraf A.K., Sinvhal A., Sinvhal H., Ghosh P. and Sarma B. 2002. Satellite data reveals 26 January 2001 Kutch Earthquake induced ground changes and appearance of water bodies, International Journal of Remote Sensing, 23(9), pp. 1749– 1756.
Singh R.P., Bhoi S., Chandresh, Sahoo A.K. and Kanwar R. 2001. Changes in ocean after the Gujarat earthquake, GIS @ Development, 5(3), pp. 35-36.
Wardlow B.D. and Egbert S.L. 2008. Large-area crop mapping using time series MODIS 250 m NDVI data, An assessment for the U.S. Central Great Plains, Remote Sensing of Environment, 112, pp. 1096–1116.
International Archives of the Photogrammetry, Remote Sensing and Spatial Information Sciences, Volume XXXIX-B8, 2012 XXII ISPRS Congress, 25 August – 01 September 2012, Melbourne, Australia