DETECTION OF COLLAPSED BUILDINGS
BY CLASSIFYING SEGMENTED AIRBORNE LASER SCANNER DATA
Sander Oude Elberink a, Moreblessings Shoko a,b, Seyed Abdolmajid Fathi a, Martin Rutzinger a,c a
Faculty of Geo-Information Science and Earth Observation, University of Twente, The Netherlands b
Department of Surveying and Geomatics, Midlands University, Zimbabwe c
Institute of Geography, University of Innsbruck, Austria
,
[email protected],
[email protected],
[email protected]KEY WORDS: Supervised classification, maximum entropy modelling, rule based classification, airborne laser scanner data, segmentation, object-based point cloud analysis
ABSTRACT:
Rapid mapping of damaged regions and individual buildings is essential for efficient crisis management. Airborne laser scanner (ALS) data is potentially able to deliver accurate information on the 3D structures in a damaged region. In this paper we describe two different strategies how to process ALS point clouds in order to detect collapsed buildings automatically. Our aim is to detect collapsed buildings using post event data only. The first step in the workflow is the segmentation of the point cloud detecting planar regions. Next, various attributes are calculated for each segment. The detection of damaged buildings is based on the values of these attributes. Two different classification strategies have been applied in order to test whether the chosen strategy is capable of detect-ing collapsed builddetect-ings. The results of the classification are analysed and assessed for accuracy against a reference map in order to validate the quality of the rules derived. Classification results have been achieved with accuracy measures from 60-85% complete-ness and correctcomplete-ness. It is shown that not only the classification strategy influences the accuracy measures; also the validation meth-odology, including the type and accuracy of the reference data, plays a major role.
1. INTRODUCTION
In January 2010 Haiti was stroke by a major earthquake. As a rapid response several spatial datasets including remote sensing data were collected in order to provide a comprehensive data set for assisting hazard management. Most of the earliest dam-age maps were produced by manual interpretation of high reso-lution optical images. Among the data collected also airborne laser scanner (ALS) point clouds were acquired after the Haiti earthquake (RIT IPLER 2011). Rapid mapping of damaged re-gions and individual buildings is essential for efficient crisis management. The quality of damage maps that are manually produced depends on individual operators, whose maps are of-ten produced under time pressure, using existing data sources that might remain unchecked.
The challenge is to clearly identify a unique and distinct pattern in the ALS data belonging to a collapsed building structure. This unique pattern can then be used to automate the identifica-tion of collapsed buildings throughout a given data set of large areas. Finding the unique pattern is a challenge because of the random and irregular nature of damaged building structures, which cannot be easily mathematically described and explained by analysing volume, slope or size attributes as it is the case for undamaged buildings.
In this paper we describe two different strategies how to proc-ess ALS point clouds in order to detect collapsed buildings automatically. Our aim is to detect collapsed buildings using post event data only. We focus on the completely collapsed buildings, i.e. buildings where the entire structure has fallen apart. These type of features are categorised as “heap of de-bris”, “heap of debris with planes”, “pancake collapse , all sto-ries” or “heap of debris with vertical elements” or “outspread multi layer collapse”, according to the damage catalogue of Schweier and Markus (2006).
The proposed approach starts with a segmentation algorithm that groups ALS points that roughly lie in a certain plane.
Vari-ous geometric and radiometric attributes are calculated for each segment. For damaged building detection two different strate-gies to train and classify the complete dataset are compared which each other. The first is a rule based classification, where in a training stage a selection of segments is classified into col-lapsed buildings, non-colcol-lapsed building, roads and vegetation. Using rules based on the signature of those training segments from collapsed buildings, the complete dataset is classified. The second strategy uses training segments, which are extracted automatically using a reference dataset. This training dataset is supposed to contain only segments from collapsed buildings. Next, a classification model, based on maximum entropy mod-elling, is used to detect collapsed buildings. Finally, the out-comes of both methods are compared.
2. RELATED WORK
Several studies show that automated building detection from ALS data is feasible (e.g. Matikainen et al. 2010, Rottensteiner et al. 2007, Rutzinger et al. 2009). Methods working directly in the 3D point cloud have the advantage to maintain the highest accuracy and resolution of the ALS data. Furthermore, object-based approaches combining segmentation and classification al-low describing objects not only by their properties, which are derived directly from the point cloud but can also consider shape, neighbourhood and hierarchical relations of objects in the classification step (c.f. (Blaschke, 2010), (Rutzinger et al., 2008)). Many different point cloud segmentation algorithms have been proposed especially for the delineation of planar re-gions e.g. for the extraction of roof planes and roads (e.g. (Filin and Pfeifer, 2006), (Rabbani et al., 2006), (Vosselman et al., 2005).
seg-mentation algorithms working on Digital Surface Models (DSMs) for the detection of damages buildings. As test data set a training area with 16 damaged buildings of the Swiss Military Disaster Relief was used. The comparison shows that the region growing algorithm performs better than an extended Random Sample Consensus (RANSAC) algorithm. However, an area wide data set was not processed and no quantitative perform-ance evaluation has been performed. Vögtle and Steinle (2004) present an approach to detect damaged buildings based on change detection in multi-epoch ALS data. Their method seg-ments and classifies both pre- and post-event ALS data, fol-lowed by an object-based change detection step. The disadvan-tage of this method is that it requires pre-event data, which might not be available or accessible, especially in the first days after a disaster such as an earthquake.
3. DATASETS AND TEST SITE
3.1 Airborne laser scanner data
On Tuesday 12 January 2010, Haiti was hit by an earthquake near the town of Léogâne, west of Haiti's capital Port-au-Prince. The ALS data has been acquired by Kucera Interna-tional between January 21-27, 2010 using a Leica ALS50 Li-DAR1 system, with an average point density of about 3 points per square meter. The data contains intensity information as the system recorded the return amplitude of the received echo.
Two regions are selected as training and validation areas, re-spectively. The two areas represent densely built-up areas com-prising multi-story buildings, urban vegetation, and roads partly covered by debris. Training samples have been taken from the training region. ALS data in the validation area has been classi-fied using the training results, and validated using a reference dataset.
3.2 UN reference dataset
Usage has been made of a classified damage building assess-ment map from the UN2. This assessment map is made by joint collaboration between the United Nations Institute for Training and Research (UNITAR) Operational Satellite Applications Programme (UNOSAT), European Commission Joint Research Centre (EC JRC) and the World Bank. This reference dataset has been produced by manual interpretation of image analysts who categorized buildings into destroyed, severely damaged, moderately damaged and no visible damage.
4. METHODOLOGY
4.1 Workflow
The first step in the workflow is the segmentation of the point cloud detecting planar regions (explained in 4.2). Next, various attributes are calculated for each segment (see 4.3), which are used as input in the classification step. Two different classifica-tion strategies have been applied in order to test whether the chosen strategy is capable of detecting collapsed buildings (see 4.5 and 4.6).
4.2 Segmentation
Segmenting the ALS data is the first step in grouping points that belong to a certain object part. We followed a surface
1
Data available on: http://www.opentopography.org 2
Data downloaded from: http://www.unitar.org/unosat/
growing approach, in which the seeds are detected in a Hough transformation, as suggested by (Vosselman et al., 2004). After the seeds of segments are detected in Hough space, points are added to the segments in a planar surface growing procedure. Two main criteria to grow a segment are listed here:
The candidate point should be located near the plane fitted through the segment, within a certain threshold. The distance between a candidate point and the
nearest point in the segment should not exceed a certain 3D radius.
For this project we choose parameter settings of 0.2 m and 1.0 m respectively. This means that points are grouped into one segment if they are within a distance of 0.2 m to the plane fitted through all the points, and the point should be within a distance of 1 m to another point in the segment.
4.3 Calculation of segment attributes
Our aim is to detect damaged buildings based on geometric and radiometric characteristics of segments. Of course, the main characteristic is implied in the fact that the segments only con-tain points that lie in a cercon-tain planar surface. For each of these segments, a list of attributes is calculated. The attributes are proposed to be able to separate segments on collapsed buildings from other classes, such as vegetation and non-collapsed build-ings.
4.3.1 Number of points per segment (‘NP’)
The total number of points that form a segment is an indicator of the size of certain feature. The expectation is that the number of points of segments on collapsed buildings is less than those of terrain, roads and possibly non-collapsed buildings, but slightly more than segments in vegetation.
4.3.2 Mean height above the Digital Terrain Model (‘D2DTM’)
This attribute represents the normalised mean height of a seg-ment. It is an indicator how close the segment is to the ground surface. In our research, the Digital Terrain Model (DTM) has been produced from the ALS data in a semi automatic segment based filter procedure. The segmentation for the production of the DTM is performed in a smooth surface growing algorithm, as described in (Sithole and Vosselman, 2005).
4.3.3 Number of unsegmented to segmented points ratio (‘NUSPR’)
This attribute represents the ratio between the number of un-segmented points and the un-segmented points near the centre of the current segment. This ratio indicates whether the structure near the segment centre contains points that are just too far away from the fitted plane to be inserted into the segment. All unsegmented points are selected that are within a perpendicular distance of 1 m to the plane fitted through the segment. It is a measure for the roughness of the surface, just outside the bounds of a segment.
4.3.4 Planarity of segment (‘PLAN’)
4.3.5 Standard deviation of intensity (‘STDINT’)
This attribute contains a radiometric characteristic of the seg-ment. The standard deviation of intensity represents the homo-geneity of the features reflectance. Normally, we expect a stan-dard feature to have a homogenous intensity value. From studying the cloud intensities there are rough areas, e.g. col-lapsed buildings that contain a mix of intensity values. In our research the influence of different intensity values caused by different acquisition geometry, e.g. in strip overlapping areas, is ignored.
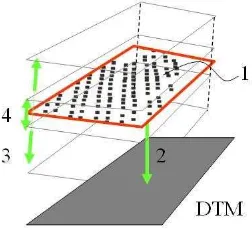
In the figures and tables in the remainder of the paper, the ab-breviation of attribute names have been used. In Figure 1 four geometric parameters are visualised for one segment. The num-bers correspond to the subsection numnum-bers in section 4.3.
Figure 1 Four geometric parameters in a schematic representa-tion: NP (1), D2DTM (2), NUSPR in range between 0.2-1.0 m from plane (3), planarity of segment within 0-0.2 m (4).
4.4 Training and validation areas
Both our strategies are based on a supervised classification pro-cedure. However, the selection of training areas differs per strategy. In the –rule-based classification method a human op-erator has selected training areas, each containing collapsed buildings, non-collapsed buildings, vegetation and roads. The selection is based on human interpretation of pre- and post event image datasets. The image datasets include high resolu-tion satellite imagery and oblique aerial images. The maximum entropy classification method only selects training segments on collapsed buildings, by using the UN reference dataset. In an automatic approach, the segments are selected that are nearest to the point location of collapsed buildings in the reference map. For each occurrence in the reference map, only one seg-ment, i.e. the nearest, is selected. This results in a one class training dataset.
For validation the classification results are compared to the ref-erence dataset. The independent refref-erence dataset is a point shape file, containing the centre locations of collapsed build-ings. We calculated whether in a radius of 5 m there is a classi-fied segment of collapsed buildings. If there is, it counts as a True Positive (TP), otherwise it is a False Negative (FN). False Positives (FP) are segments classified as collapsed buildings, but without any reference point within 5 m of any point in the segment. Accuracies measures are determined by computing completeness (Eq. 1), correctness (Eq. 2), and overall quality (Eq. 3) as:
4.5 Rule based classification
Segments in the training areas of four classes are analysed to get the signature of each of the classes. In Table 1 an overview is given of the average attribute value of the features in the training area per class.
NP D2DTM
Table 1 Summary of average attribute values in training areas.
Figure 2 gives more insight in how the attribute values can be used to detect collapsed buildings. It is shown that the parame-ter NUSPR is potentially a good discriminator between vegeta-tion and collapsed buildings. Although the number of samples is limited, it clearly indicates that the ratio between the number of unsegmented points and segmented points in a 1 m buffer zone around each segment is about 0.9 for vegetation, and 0.2 for segments on collapsed buildings.
Ratio unseg / seg points
0.000
Figure 2 Values for the ratio between number of unsegmented points and segmented points (NUSPR), for 4 classes in 6 training areas.
From the statistics of the training areas the following conditions were chosen as base thresholds to create a rule based classifica-tion. These thresholds serve as a signature in the rule based classification of collapsed buildings in the Haiti dataset.
Minimum Maximum
The detection of collapsed buildings is performed by checking to what extent the attribute values of each segment compare with the signature of collapsed buildings in the training data. The classification is based on a count system where a counter is initialised that counts the number of times a segment meets the above conditions and at the end sums up the count per segment. The result is a label per segment that ranges from 0 (none of the conditions fulfilled) to 5 (all fulfilled). We selected the seg-ments with labels 4 and 5 and classified them as being segment on a collapsed building. In our implementation, no specific weight is given to the attribute values.
Although the influence of threshold values is transparent and the algorithm is easy to adjust to specific situations, we ex-tended the research by analysing of a more sophisticated classi-fication approach to reduce the influence of individual thresh-old values. In addition to that is of interest to know the contribution of each of the attributes.
4.6 Maximum entropy modelling
4.6.1 Motivation to use maximum entropy
Maximum entropy modelling is a machine learning method that can predict a certain distribution of a class, e.g. collapsed build-ings, by making use of the unpredictable behaviour of segments in that class. A statistical model is proposed that calculates the entropy of a dataset and selects the model with the highest en-tropy. It means that the probability distribution of the class col-lapsed buildings is calculated for the whole dataset that best represent the knowledge taken from the training dataset.
The motivation is that we do not have to assume anything on the probability distribution other than what is observed in the training data (Manning and Schutze, 1999). This is considered to be an advantage for us considering the random and irregular nature of damaged building structures.
An implementation of maximum entropy modelling was used that was originally created for species habitat modelling, as de-scribed (Phillips et al., 2006; Phillips and Dudik, 2008) and (Elith et al., 2010). This approach is implemented in the soft-ware ‘MaxEnt’3.
4.6.2 Input MaxEnt
MaxEnt needs two files to classify a dataset: the first is a sam-ple file, containing segments and their attribute values of the training dataset. The second file contains all other segments in-cluding their attribute values. Attribute values of the training dataset are used to calculate the empirical distribution of seg-ments in the class of collapsed buildings. During the classifica-tion, MaxEnt calculates to what extent a certain attribute con-tributes to calculating the probability of segments being part of a collapsed building; this is called the gain of a certain attribute.
4.6.3 Jackknife test
In the jackknife analysis as implemented in Maxent, two sce-narios are determined for each attribute. The first scenario is the one where the attribute is the only variable used for classifica-tion, whereas the second scenario performs the classification with all except that attribute. The jackknife test returns a list, ordering the attributes from most to least informative for classi-fication. For many applications this is used to select only the most informative attributes, as gathering the attributes might be labour intensive or expensive. Though the latter reason does not hold for our application, the jackknife test is giving insight in
3
Freely available at www.cs.princeton.edu/~schapire/maxent
what attribute is delivering informative data on the location of damaged buildings.
5. RESULTS
5.1 Rule based classification
In Figure 3 results are shown of our rule based classification. Centre points of segments are labelled according to the label of the corresponding segment. Green, yellow and orange points are not likely to represent collapsed buildings, as they fulfil none or only up to three conditions in the rule base. Red points are highlighting possible areas of total collapse as they display the highest probability of damage, based on the number of times the segments satisfied the thresholds defined in Table 2.
Figure 3 Overview classification result showing centre points of segments coloured by number of counts (green = 0/1, yellow = 2, orange = 3, red =4/5.
Figure 4 shows a part of the dataset where the ALS points are labelled according to the label number of the corresponding segment.
Figure 4 ALS points of segments labelled by counts of fulfilled conditions. White circles indicate regions with seg-ments classified as collapsed buildings (labels 4 and 5).
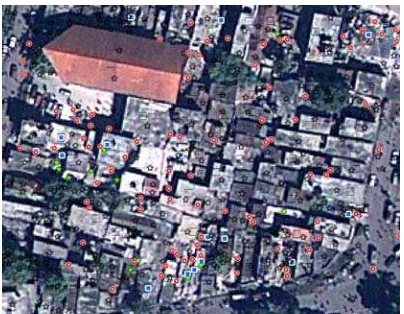
Figure 5 shows both the classification results in red and the ref-erence data in blue, overlaid on a post event satellite image. It can be seen that there is not an exact correspondence between the classified data and the reference data. Reasons can be found in the differences in representing the results (buildings vs. seg-ments) and differences in deriving the results (manual interpre-tation of imagery and automatic generation of geometric fea-tures). Quantitative measures are shown in Table 4.
There are a few areas of misclassification noticed for example there are several tent camps within the place and areas with shanty structures that have been classified as collapsed build-ings. The reason is that the characteristics of tents and shanty structures show several similarities with a collapsed building at-tributes. At the left in Figure 6 segments classified as collapsed buildings are shown next to a satellite image, taken by GeoEye. Some segments including tents are classified as collapsed build-ings. The satellite image was captured one week before the ALS data, so small differences in both figures can also be caused due the time difference.
Figure 6 Tent camp clusters inside stadium recognised as seg-ments on collapsed buildings. The GeoEye image (right) was captured one week before the ALS data (left).
5.2 Maxent classification result
The result of Maxent is a prediction whether a segment is part of a collapsed building or not. The prediction is represented by a probability parameter, ranging from 0 to 1, see Figure 7. Seg-ments having a probability higher than 0.5 have been classified as segments on collapsed buildings.
Figure 7 Left: Prediction of collapsed buildings (green = 0-0.4, yellow = 0.4-0.6, orange = 0.6-0.8, red = 0.8-1.0). Right: Image overlaid with reference data (blue) and classified segments (red).
The result of the jackknife test is listed in Table 3. It can be seen that the attribute which is most informative is number of points (NP) which therefore appears to have the most useful in-formation by itself. ‘Number of points’ is also the variable that decreases the gain the most when it is omitted from the list of attributes. This result seems logical as this attribute is the only variable that holds information on the size of the segment. It
can be expected that the planarity variable (PLAN) and the ‘ra-tio between not segmented points and segmented points’ (NUSPR) are some how correlated with each other. This means that the decrease of information is lower if one is omitted.
Variable Percent contribu-tion
Permutation impor-tance
NP 46.4 47.2
NUSPR 21.9 20.1
D2DTM 15 13.5
STDINT 11.8 10
PLAN 4.9 9.1
Table 3 Results of the jackknife test showing the importance of a variable.
5.3 Comparison of results of both methods
In Figure 8 classification results of both methods are visualised together with the reference data, overlaid on a pre-event Geo-Eye satellite image.
Figure 8 Segment centres classified as collapsed buildings for rule based classification (green star), MaxEnt approach (red circle) and reference data (blue box).
For both methods the three accuracy measures are calculated as a function of the True Positives, False Negatives and False Positives, listed in 4. The low correctness of the Maxent ap-proach (63%) was caused by a relative large number of False Positives: predicted collapsed buildings were not found in the reference data. This is caused by fact that the distribution of that training dataset was too wide, causing too many segments that are considered to be similar to the training data. As a result, these are falsely classified as collapsed buildings. As a conse-quence more segments are near damaged buildings in the refer-ence map, resulting in a higher completeness value.
Rule based classi-fication
Maxent
Completeness 70% 82%
Correctness 74% 63%
Overall quality 56% 60%
Table 4 Accuracy measures of two approaches on the same dataset. Training dataset differs between the two ap-proaches.
collapsed building. Instead of using the segment centre, we used the existence of any laser point of a segment, classified as collapsed buildings. For the rule based classification the results improved by more than 10% to 80% completeness, 75% cor-rectness and 70% overall accuracy. The reason is that there are more True Positives found and less False Negatives. Similar changes are found if the radius to search for classified segments increased from 5 to 10 m. Main conclusion is that the influence of threshold values in the validation step should be analysed in order to draw conclusions on the individual accuracy measures.
6. DISCUSSION
The choice of using planar segments as entity to detect dam-aged buildings can be considered slightly contradictory. First of all, the appearance of damaged buildings cannot be considered typically planar. We have softened this problem by taking into consideration the planarity of segments and the number of near-by unsegmented points. Both of these attributes are considered as important in the jackknife test. Secondly, our results actually represent segments on damaged buildings, instead of the build-ings themselves. Grouping those segments that belong to the same building is needed in order to count the number of col-lapsed buildings.
A disadvantage of a rule based classifier is that the design needs manual work, e.g. for selecting the optimal attributes and its corresponding thresholds. However, for applications in disaster management, where availability of data and the required output may differ per disaster, it can be considered as an advantage to manually adapt the classification strategy to the needs.
7. CONCLUSION
We have presented two methods to detect collapsed buildings in ALS data. The advantage of ALS point cloud analysis is the possibility to calculate geometric and radiometric attributes of segments directly in the original 3D measurements, which have highest accuracy. Methods have been presented to derive rules based from training data. In addition, we have presented a way how to determine the contribution of each of the attributes to the classification result.
The rule based classifier shows a direct relation to the attributes in the training data. In some situations collapsed buildings were not detected, as the corresponding segments did not fit the thresholds in the rule base. On the other hand, the Maxent clas-sifier depends on the availability of precise training data, hence may not be ideal in the initial time pressured computations. Moreover, its accuracy is likely to depend on way how the ref-erence is captured. The choice of training data influences the classification result. Several researchers explain that by boot-strapping, i.e. iteratively nd randomly using a subset out of the training dataset, it is possible to reduce the influence of a single training dataset (Phillips and Dudik, 2008). However, the effect of choosing the (complete) training dataset is not minimised by bootstrapping. The reference data is represented by the central location of a collapsed building, not necessarily matching the centre location of the corresponding segments in the ALS data. For future research we have to analyse the influence of the dif-ference between the training dataset that was created manually, and the dataset that was determined automatically by selecting segments near a reference data point.
Only by choosing the way how to match reference data and classified data, one can influence the accuracy measures by over 10%. It shows that besides the classification procedure, the validation procedure is at least equally important. In this paper we do not draw conclusions on the accuracy values itself, as the influence of the validation procedure has not been fully
ana-lysed. Future work focuses on analysing the influence of threshold values in both the classification and validation proc-esses.
8. ACKNOWLEDGEMENTS
ALS data were acquired by Rochester Institute of Technology and Kucera International, under sub-contract to ImageCat Inc. and funded by the Global Facility for Disaster Reduction and Recovery (GFDRR) hosted at The World Bank. The reference dataset is part of the "Remote sensing damage assessment: UNITAR/UNOSAT, EC JRC and World Bank”.
9. REFERENCES
Blaschke, T., 2010. Object based image analysis for remote sensing. ISPRS Journal of Photogrammetry and Re-mote Sensing, 65(1): 2-16.
Elith, J. et al., 2010. A statistical explanation of MaxEnt for ecologists. Diversity and Distributions, 17(1): 43-57. Filin, S. and Pfeifer, N., 2006. Segmentation of airborne laser
scanning data using a slope adaptive neighborhood. ISPRS Journal of Photogrammetry and Remote Sens-ing, 60(2): 71-80.
Phillips, S.J., Anderson, R.P. and Schapire, R.E., 2006. Maxi-mum entropy modeling of species geographic distri-butions. Ecological modelling, 190(3-4): 231-259. Phillips, S.J. and Dudik, M., 2008. Modeling of species
distri-butions with Maxent: new extensions and a compre-hensive evaluation. Ecography, 31(2): 161-175. Rabbani, T., van Den Heuvel, F. and Vosselmann, G., 2006.
Segmentation of point clouds using smoothness con-straint. International Archives of Photogrammetry, Remote Sensing and Spatial Information Sciences, 36(part 5), 248-253.
Rehor, M., Bähr, H.-P., Tarsha-Kurdi, F., Landes, T. and Grus-senmeyer, P., 2008. Contribution of two plane detec-tion algorithms to recognidetec-tion of intact and damaged buildings in lidar data. The Photogrammetric Record, 23(124): 441-456.
Rutzinger, M., Höfle, B., Hollaus, M. and Pfeifer, N., 2008. Object-Based Point Cloud Analysis of Full-Waveform Airborne Laser Scanning Data for Urban Vegetation Classification. Sensors, 8(8): 4505-4528. Schweier, C. and Markus, M., 2006. Classification of Collapsed
Buildings for Fast Damage and Loss Assessment. Bulletin of Earthquake Engineering, 4(2): 177-192. Sithole, G. and Vosselman, G., 2005. Filtering of airborne laser
scanner data based on segmented point clouds. Inter-national Archives of Photogrammetry, Remote Sens-ing and Spatial Information Sciences, XXXVI(part 3/W19), 66-71.
Vögtle, T. and Steinle, E., 2004. Detection and recognition of changes in building geometry derived from multitem-poral laserscanning data. International Archives of Photogrammetry, Remote Sensing and Spatial Infor-mation Sciences, Vol 35(part B2), 428-433.
Vosselman, G., B. Gorte, G. Sithole and Rabbani, T., 2004. Recognising Structure in Laser Scanner Point Clouds. International Archives of Photogrammetry, Remote Sensing and Spatial Information Sciences, XXXVI(part 8 / W2), 33-38.