CALIBRATION OF FULL-WAVEFORM ALS DATA BASED ON ROBUST INCIDENCE
ANGLE ESTIMATION
F. M. Abed, J. P. Mills, P. E. Miller
School of Civil Engineering and Geosciences, Newcastle University, Newcastle upon Tyne, United Kingdom (f.m.al-fadhly, j.p.mills, p.e.miller)@ncl.ac.uk
KEY WORDS: ALS, Full-waveform, Calibration, Analysis, Modelling, Segmentation
ABSTRACT:
Full-waveform airborne laser scanning data has shown its potential to enhance available segmentation and classification approaches through the additional information it can provide. However, this additional information is unable to directly provide a valid physical representation of surface features due to many variables affecting the backscattered energy during travel between the sensor and the target. Effectively, this delivers a mis-match between signals from overlapping flightlines. Therefore direct use of this information is not recommended without the adoption of a comprehensive radiometric calibration strategy that accounts for all these effects. This paper presents a practical and reliable radiometric calibration routine by accounting for all the variables affecting the backscattered energy, including the essential factor of angle of incidence. A new robust incidence angle estimation approach has been developed which has proven capable of delivering a reliable estimation for the scattering direction of the individual echoes. The routine was tested and validated both visually and statistically over various land cover types with simple and challenging surface trends. This proved the validity of this approach to deliver the optimal match between overlapping flightlines after calibration, particularly by adopting a parameter which accounts for the angle of incidence effect.
1. INTRODUCTION
Small-footprint full-waveform (FW) airborne laser scanning (ALS) has become a fully commercial technology and during the last seven years has increased in availability. It is an active remote sensing technique which provides end users with a significant combination of geometric and physical information about Earth surface coverage (Shan and Toth, 2009). Discrepancies between overlapping flightlines delivered from FW post processing is a particular problem in terms of both geometric and physical aspects. Although the geometric aspect of this problem has been widely investigated by the literature, the physical aspect is still challenging and needs further investigation in order to be overcome (Wagner et al., 2008). Therefore, eliminating discrepancies of FW backscatter signals between overlapping flightlines is the primary focus of the research presented here.
The physical information that FW data provides is affected by many variables during travel between the sensor and the target. These include atmospheric, incidence angle and target property effects. A robust radiometric calibration strategy must be capable of eliminating all aforementioned effects and delivering reliable radiometric information for ground features (Briese et al., 2008). This necessitates overcoming the mis-match of the backscattered signals between overlapping flightlines. Later, the calibrated signals could be exploited alongside the geometric information to enhance available segmentation approaches.
To fully utilize FW measurements, Wagner et al. (2008) suggested the adoption of a physical quantity, such as the backscatter cross-section, that includes all the variables affecting target backscattered signal. Following this, Briese et al. (2008) proposed an absolute calibration technique of FW data using natural reference targets. This technique presented a practical workflow. However incidence angle effects are not considered in the calibration process. To eliminate this
particular effect, Jutzi and Gross (2010) presented an investigation studying the optimal surface reflection model which should be applied to overcome variables affecting echo amplitude signals including the angle of incidence effect. This found that echo amplitude variations caused by incidence angle and range effects can be eliminated by using the Lambertian reflection model (Jutzi and Gross, 2010). As the radar equation considers all Earth surface feature properties (including scattering direction), atmospheric and system characteristic, and the range effect, this can be considered as well-suited for ALS radiometric calibration purposes (Wagner et al., 2008). Following this, Lehner and Briese (2010) incorporated the incidence angle effect in the proposed radiometric calibration workflow. However, although, the presented routine is highly valid over planar features, their findings concluded that results are uncertain over natural features with challenging surface trends.
In this paper, a practical radiometric calibration routine for FW data is presented and validated over different land cover types, including man-made and natural, with the aim of eliminating FW backscattered signal discrepancies between overlapping flightlines. This routine is based on applying robust surface normal estimation - termed the RSN method - to deliver robust incidence angle estimation for individual returns, particularly over challenging natural surfaces. Later, these values are used to consider the incidence angle effect in the radar equation and deliver more reliable backscattered signals. The study has been tested over several targets with different surface trends and properties. Later, the results are analysed both visually and statistically and a comparison between the backscattered signals delivered from the overlapping flightlines is presented for each target. In order to assess which configuration is able to best eliminate flightline discrepancies, four different backscatter parameters are considered.
2. METHODOLOGY 2.1 Background
Due to the similarity between ALS and radar systems, scientists tend to use the radar equation (equation (1)) to describe all the parameters that affect the received power Pr:
atm sys t
r t r
R D P
P
422 4
(1)
Where Pt= transmitted power
Dr = diameter of the receiver aperture R = range between the sensor and the target βt2 = laser beam divergence
σ= backscatter cross-section ηsys = system transmission factor ηatm= atmospheric transmission factor
Laser backscatter energy (σ) is a measure of directional scattering power that defines all target characteristics (equation (2)) including scattering direction, reflectivity and area of illumination (Hӧfle and Pfeifer, 2007; Wagner et al., 2008).
i
A
4 (2)
Where Ω= scattering angle ρ = surface reflectivity
Ai = size of the area illuminated by the laser beam
In FW ALS data, Pr can be represented as a product of echo amplitude and pulse width (Wagner et al., 2008). Equation (1) can be re-arranged with the assumption that all unknown parameters could be assumed to be a constant in a certain ALS system. This delivers a new constant factor for each ALS campaign called the calibration constant Ccal, and equation (1) can be re-formulated to yield the calibration equation as follows (Briese et al., 2008):
atm i p i
cal R Ps
C
,4
4
While
sys r t
t cal
D P C
2 2
(3)
Where Pisp,i= the product of echo amplitude and width
A reference target with known backscatter cross-section value should be used to deliver a good estimation of the calibration constant for the entire campaign. Later this constant can be used to deliver the backscattered energy for individual echoes.
Wagner et al. (2008) introduced another parameter, termed the backscatter cross-section coefficient (γ) (equation (4)) by considering the area illuminated at the object (Alf) rather than the area illuminated by the laser beam (Ai) where both values vary with different altitudes and beam divergences (see equation (5) and (6)). Moreover Ai requires additional information to be delivered such as the local incidence angle for each individual laser echo (Lehner and Briese, 2010).
lf
A
(4)
4
2 2
t lf
R
A
(5)i t i
R A
cos 4
2 2
(6)
To account for the incidence angle effect in the calibration procedure we need to normalise both backscatter cross-section (σ) and backscatter cross-section coefficient (γ) values with respect to the angle of incidence effect. This produces two more backscatter parameters within the Lambertian scattered assumption represented by equations (7) and (8), as follows:
i
cos
(7)
i
cos
(8)
The four mentioned backscatter parameters represented in equations (3), (4), (7), and (8) respectively can be considered to be useful values for accurate recognition of surface targets, and a promising source of information for ALS segmentation techniques. Therefore these parameters will be assessed in the calibration routine presented herein.
2.2 Calibration Routine
Small-footprint FW datasets were captured with the Riegl LMS-Q560 scanner for a study site located at Bournemouth on the south coast of England. The Bournemouth dataset is composed of nineteen flightlines with an average flying height of 350 m, producing a point density of 15 points/m2 with a 0.18 m footprint diameter size. This data was collected from a helicopter platform in May 2008 and covers various land cover types including urban and natural surface features.
The FW dataset has been post-processed using the Rigorous Gaussian pulse Detection (RGD) software (Lin et al., 2010). Due to processing complexity which comes from the large dataset and the substantial number of echoes that RGD can detect, an effective processing strategy has been developed using a grid computing technique to process the entire dataset. The new routine relies on high-throughput computing (Condor) utilizing the Newcastle University network (Abed and McGough, 2010).
In order to calibrate the Bournemouth dataset, the four aforementioned backscatter parameters should be estimated for individual laser echoes. To achieve this, incidence angle estimation for individual echoes has to be first undertaken. As incidence angle is a function of illumination direction from the sensor to the target and the surface normal vector associated with the point, a new Robust Surface Normal (RSN) method has been developed (Abed et al., 2010). This aims to produce a robust surface normal estimation over any land cover type and thus deliver more reliable incidence angle estimation for individual FW echoes. The method is based on the k-nearest neighbours algorithm by including a minimum number of points to estimate the normal following 3D moment invariant theory. It defines the 3D spherical volume by including only the three
nearest Euclidian neighbouring points to the point in question. FW echo amplitude values are used as a weighting function in the invariant definition. To ensure robustness of the delivered normal, a threshold value, based on data density and point accuracy, is applied to the vector dot product in 3D space. This determines whether the selected points provide a suitable basis for accepting the 3D volume definition, or whether the current neighbourhood system should be rejected and a new definition computed (Abed et al., 2010). The new RSN method is based on robust planarity checking that delivers the exact normal value over planar surfaces and the best approximate normal over non-planar surfaces. This is opposed to an unreliable normal delivered from fitting a plane to a group of points with different orientations which is commonly acquired over natural land coverage and surfaces with rough trends. This is mainly because the normal delivered from available methods could be reliable for some of the points used to define the orientation of the surface but not necessary for the point of interest itself which would translate to an erroneous normalised echo amplitude value. A robust normal estimation method is essential for different lidar applications, including the segmentation of point clouds.
22 1m-radius circular PVC fabric targets were distributed across the Bournemouth site and have been utilized as reference targets for calibration purposes. Although successive reflectivity measures should be taken for the reference targets during data capture, this condition could not be met in this dataset. Therefore, indoor reflectivity measurements using an Analytical Spectral Device (ASD) with two different fore-optics and different incidence angle settings between 0° and 90° was performed post-capture, in order to deliver the best reflectivity estimation for the reference targets. Atmospheric conditions for the flight campaign have been estimated using the models presented by Hӧfle and Pfeifer (2007) based on visibility records relating to an atmospheric centre located near the study site.
In order to undertake the radiometric calibration, firstly the RSN method was applied to the reference targets echoes to guarantee the consideration of the incidence angle effect on the reference target backscattered energy. Thereafter the calibration constant was estimated for all reference target echoes individually. To avoid noise effects, the mean calibration constant was then calculated to be considered later for determination of the individual backscatter parameters. Thereafter, the four backscatter cross-section parameters were estimated for individual echoes within each selected target tested in this research. Several homogeneous targets (in terms of feature composition and material) and a selective interest area from Bournemouth study site have been tested and validated using statistical and visual tools. The validation process aims to compare the backscatter signals from both overlapping flightlines to demonstrate the performance of the backscatter signals after calibration. Twenty homogeneous targets covering different land cover types and including planar and natural discontinuous trends have been tested. This includes roads, house roofs, artificial ground, cars, natural and undulating terrain, bare ground, grassed ground, scrub, and trees.
3. RESULTS AND DISCUSSION 3.1 Visual Analysis
Analysis was firstly applied for all selected targets by examining the discrepancies between the flightlines represented by the
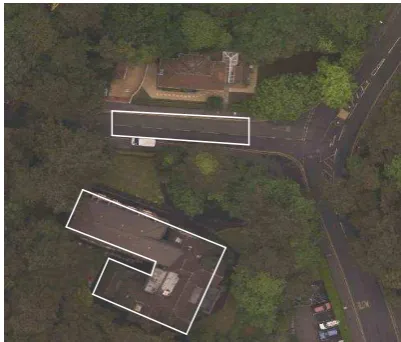
histograms and the normal distribution curves of the backscattered signals before and after calibration. For demonstration purposes, asphalt road and complex roof targets marked by white borders in Fig 1 have been analysed and presented in Fig 2 and 3 respectively.
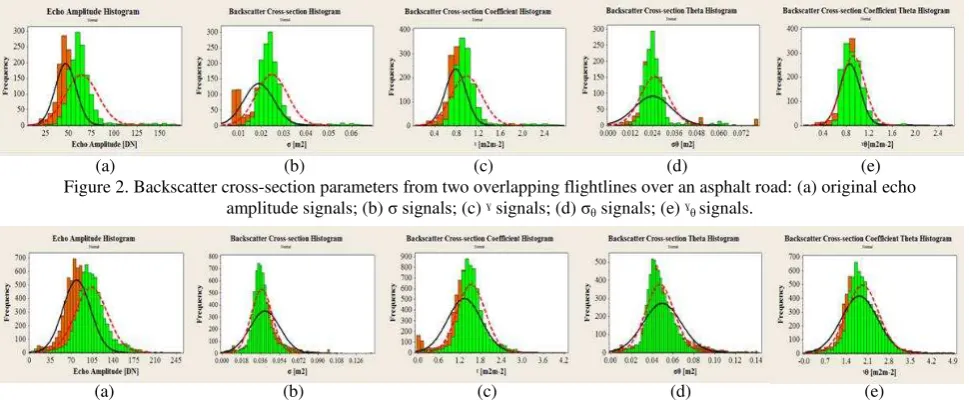
The asphalt road target comprises two sections of different reflectivity values, in addition to the white road markings in the middle. Fig. 2 demonstrates the elimination of discrepancies between flightline signals after calibration delivered from the four backscatter parameters. However, the results delivered from γθ show the best performance, as evidenced through the nearly perfect match between flightline signals, due to the minimisation of differences between the standard deviation and mean values for both flightlines. This is due to the fact that this parameter delivers stable values from different flying heights in addition to compensating for the angle of incidence effect.
Similar outcomes are illustrated in Fig. 3 over a complex roof surface. This demonstrates the robustness of the RSN method by delivering reliable surface normal values, even for relatively minor details such as chimneys on the roof. These results indicate that the best match can be delivered from γθ through inclusion of robust incidence angle estimation.
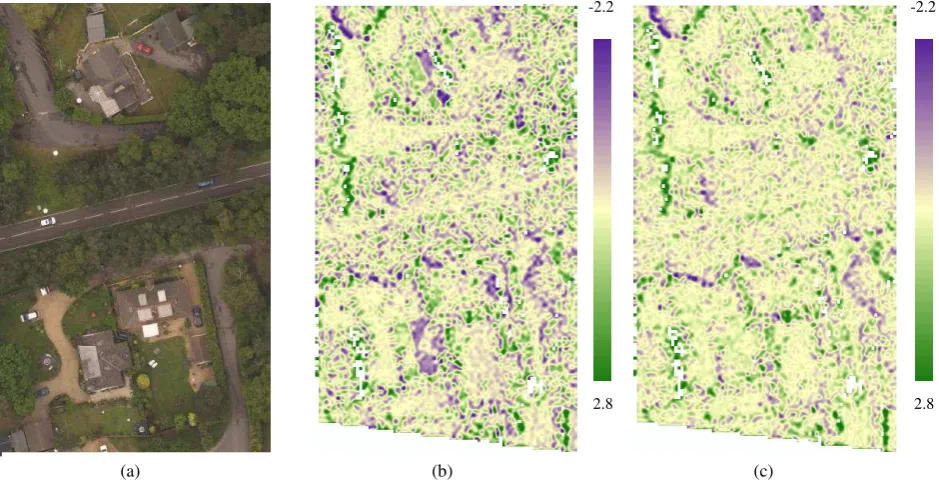
Thereafter, a small interest area (≈ 100m x 60m) which comprises various surface features was selected and analysed by producing maps of echo amplitude signals and the four backscatter parameters together with difference maps between overlapping flightlines, as presented in Fig. 4. The results show that γθ delivers the smallest difference results over the interest area in comparison to the other parameters. The reduction in the signal differences is clearly visualised over roofs and grass regions in Fig. 5, demonstrating the minimisation of differences between the backscatter signals before and after calibration. It is also evident that a relative elimination in the signal differences has been delivered over vegetated regions. To further assess these outcomes, statistical analysis was adopted.
3.2 Statistical Analysis
Statistical analysis was firstly undertaken for each individual target to ensure homogeneity. Each target sample was tested to ensure a normal distribution, which was a prerequisite for subsequent statistical analysis, assessing skewness and kurtosis.
Figure 1. Orthophoto highlighting asphalt road and complex building targets.
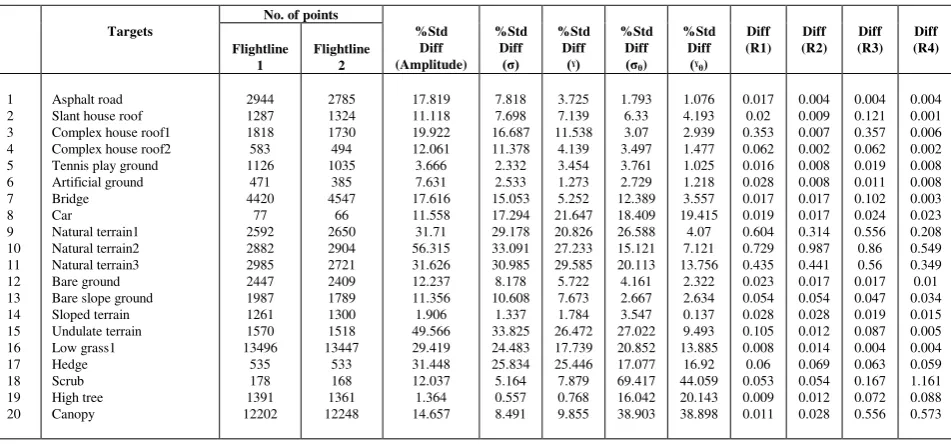
Box plots and histograms were then produced to visualise the behaviour of each sample before and after calibration. Thereafter a test for variance was undertaken using the F and Levene’s tests for each individual target. The histogram and the variance test results were studied in order to assess the standard deviation difference in percentage between the flightlines for each of the examined waveform parameters (Table 1). This shows the superior performance of the γθ parameter over most of the targets except vegetation (Table 1). However more analysis to compare sample means is required as the overarching aim is to deliver best match between flightlines translated by the sample means.
The two sample T-test was adopted for all targets individually, by comparing the sample means from overlapping flightlines. This test is effective in comparing the samples as it relying on the results delivered from variances test. Moreover, the two sample T-test can deliver four different interpretation indicators which could be adopted to justify the precision level of the delivered results. These are P-values, T-values, Confidence Interval (CI)/ Standard Error (SE), and also the absolute mean of the differences between flightlines. A Pareto chart –a graph represent the main effect, was also produced for each individual target based on the T values delivered from the T-test to highlight the the backscatter parameter that delivers best match between flightlines signals and represented by the smallest T-value. The results delivered from all targets-including natural surfaces, indicate that the γθ parameter delivers the best match between overlapping flightlines except over vegetation, the σ parameter shows better performance. These outcomes have been demonstrated over all tested targets and presented in Table 1. The analysis is based on computing the standard deviation differences in percentage and the differences in the ratio (R) of the variation coefficients (VC) (as presented by Jutzi and Gross, 2010) between overlapping flightlines for the four backscatter parameters, as follows:
1 1 2
1 1)
(R R flightline R flightline
Diff
Amplitude
C C
V V
R1 ,
Amplitude
C C
V V R2 ,
Amplitude
C C
V V
R3 , and
Amplitude
C C
V V R
4
i i C
M std V
Where std = sample standard deviation
M = sample mean
i = sample size
Table 1 indicates that marked improvements have been achieved over all targets after calibration. This is evidenced by the small standard deviation differences as compared with the original echo amplitude differences, delivered from all backscatter parameters except in one particular case that shows drawbacks in all backscatter parameters over a car target. This particular behavior could be explained by the small sample size of this relatively small target that causes it to fail in the statistical tests due to its negative skewness distribution. However, the differences in the ratio (R) of the variation coefficients (VC) is more representative as it considers both standard deviation and mean values of each particular target. The γθ parameter shows a good match by delivering the smallest difference R value represented by Diff(R4) over all targets except in the case of vegetation where σ shows to deliver better match over these targets.
To generalize these findings over a large-scale study area, a Pareto chart was produced for the interest area, as highlighted in Fig. 5 and presented in Fig. 6. The chart translates the discrepancies between flightlines delivered from the four backscatter parameters based on T-values from the T-test over the interest area. It shows that the γθ parameter delivers the best match through the lowest T-value (highest P-values), while σ shows the poorest performance of all the parameters.
These findings demonstrate the importance of the incidence angle effect in FW radiometric calibration strategies. It also highlights the robustness of the adopted RSN method which shows potential for exploiting the FW γθ parameter alongside geometric information to enhance for purposes of segmentation. Figure 2. Backscatter cross-section parameters from two overlapping flightlines over an asphalt road: (a) original echo
amplitude signals; (b) σ signals; (c) ˠ signals; (d) σθ signals; (e) ˠθsignals.
Figure 3. Backscatter cross-section parameters from two overlapping flightlines over complex roof surface: (a) original echo amplitude signals; (b) σ signals; (c) ˠ signals; (d) σθ signals; (e) ˠθsignals.
(a) (b) (c) (d) (e) (a) (b) (c) (d) (e)
Amplitude[DN] σ [m2] ˠ [m2m-2] σθ[m2] ˠθ[m2m-2]
Diffe
re
n
ce
s
F
li
g
h
tl
in
e
2
F
li
g
h
tl
in
e
1
2.7 -2.2
0.06 2.3
-0.04 -1.8
0.05 -0.04
159 -132
3.4 0.1
0.8 3.2
0.1 0.1
0.6 0.1
217 8
3.4 0.1
0.8 3.2
0.1 0.1
0.6 0.1
217 8
2.8 2.8
-2.2 -2.2
Figure 5. Difference maps from two overlapping flightlines of an interest area in the Bournemouth study site: (a) orthophoto of the interest area; (b) original echo amplitude difference map; (c) ˠθdifference map.
(a) (b) (c)
Figure 4. Difference maps for two overlapping flightlines, showing the original echo amplitude signals and the backscatter cross-section parameters for an interest area in the Bournemouth study site.
Table 1. Results of the standard deviation difference in percentage and the ratio (R) of the variation coefficients (VC) delivered from all tested targets.
Figure 6. Pareto chart of backscatter cross-section parameters over the interest area in the Bournemouth study site.
4. CONCLUSIONS
This paper presents a practical radiometric calibration approach for FW-ALS data based on a robust incidence angle estimation method. The method presented herein aims to eliminate the discrepancies between echo backscatter signals delivered from overlapping flightlines. The results show the clear potential of the γθ parameter – the backscatter coefficient, accounting for the incidence angle effect – particularly for non-vegetated targets. In the case of vegetation, the backscatter cross section, σ is shown to deliver improved results. The method has been validated both statistically and visually over different land cover types, including man-made and natural features. It has been proven that the angle of incidence has a major effect on FW backscatter energy by delivering the best match between different flightline signals when considering this effect in the calibration routine. This effect could be overcome by adopting a robust surface normal estimation approach such as the RSN method, which delivers reliable normal vector estimation for individual echoes.
REFERENCES
Abed, F.M., McGough, S., 2010. Processing data intensive Matlab jobs through Condor, in Proceedings of All Hands Meeting 2010, Cardiff, Wales, UK: On CD-ROM.
Abed, F.M., Mills, J.P., Miller, P., 2010. Radiometric calibration of full-waveform ALS data based on local incidence angle in natural
terrain, in Proceedings of RSPSoc and Irish Earth Observation
Symposium, Cork, Ireland, pp. 250-257: On CD-ROM.
Briese, C., Hӧfle, B., Lehner, H., Wagner, W., Pfennigbauer, M., Ullrich, A., 2008. Calibration of full-waveform airborne laser scanning
data for object classification, in Proceedings of SPIE- The
International Society for Optical Engineering, Orlando, FL, USA, DOI:
10.1117/12.781086.
Hӧfle, B., Pfeifer, N., 2007. Correction of laser scanning intensity data:
Data and model-driven approaches, ISPRS Journal of Photogrammetry
and Remote Sensing, 62(6), pp. 415-433.
Jutzi, B., Gross, H., 2010. Investigations on surface reflection models for intensity normalisation in airborne laser scanning (ALS) data,
Photogrammetric Engineering and Remote sensing, 76(9), pp. 1051-1060.
Lehner, H., Briese, C., 2010. Radiometric calibration of Full-Waveform
airborne laser scanning data based on natural surfaces, The
International Archives of Photogrammetry, Remote Sensing and Spatial Information Sciences, Vol. 38, Part 7B, pp. 360-365.
Lin, Y.-C., Mills, J.P., Smith-Voysey, S., 2010. Rigorous pulse detection from full-waveform airborne laser scanning data,
International Journal of Remote Sensing, 31(5), pp. 1303-1324.
Shan, J., Toth, C.K. (Eds.), 2009. Topographic laser ranging and
scanning - principles and processing, CRC Press, Taylor and Francis Group, FL, USA.
Wagner, W., Hyyppa, J., Ullrich, A., Lehner, H., Briese, C., Kaasalainen, S., 2008. Radiometric calibration of full-waveform
small-footprint airborne laser scanners, The International Archives of
Photogrammetry, Remote Sensing and Spatial Information Sciences,
Vol. 37, Part B1, pp. 163-168.
Targets