POINT
CLOUD
DERIVED
FROM
VIDEO
FRAMES:
ACCURACY
ASSESSMENT
IN RELATION
TO
TERRESTRIAL
LASER
SCANNING
AND
DIGITAL
CAMERA
DATA
P. Delis*, M. Zacharek, D. Wierzbicki, A. Grochala
Department of Remote Sensing, Photogrammetry and Imagery Intelligence, Geodesy Institute, Faculty of Civil Engineering and Geodesy, Military University of Technology, Warsaw, Poland - (paulina.delis, magdalena.zacharek, damian.wierzbicki,
[email protected]); Commission II
KEYWORDS: dense image matching, 3D modelling, data integration, image sequence, HBIM, video frames selection
ABSTRACT:
The use of image sequences in the form of video frames recorded on data storage is very useful in especially when working with large and complex structures. Two cameras were used in this study: Sony NEX-5N (for the test object) and Sony NEX-VG10 E (for the historic building). In both cases, a Sony α f = 16 mm fixed focus wide-angle lens was used. Single frames with sufficient overlap were selected from the video sequence using an equation for automatic frame selection. In order to improve the quality of the generated point clouds, each video frame underwent histogram equalization and image sharpening. Point clouds were generated from the video frames using the SGM-like image matching algorithm. The accuracy assessment was based on two reference point clouds: the first from terrestrial laser scanning and the second generated based on images acquired using a high resolution camera, the NIKON D800. The performed research has shown, that highest accuracies are obtained for point clouds generated from video frames, for which a high pass filtration and histogram equalization had been performed. Studies have shown that to obtain a point cloud density comparable to TLS, an overlap between subsequent video frames must be 85% or more. Based on the point cloud generated from video data, a parametric 3D model can be generated. This type of the 3D model can be used in HBIM construction.
1. INTRODUCTION
Terrestrial Laser Scanning (TLS) data in the form of point clouds have become more commonly used in recent years for cultural heritage applications. Point clouds from Terrestrial Laser Scanning are being used as source data for the construction of HBIM (Historic Building Information Models) (Barazetti et al, 2015).
The advantages of TLS include, but are not limited to: high end product accuracy achieving values below 1cm and a high degree of automation of the scanning process. Unfortunately this technology is still quite expensive and can be extremely time consuming, especially when working with large and complex structures such as castles or palaces. For this reason, it is becoming more and more common to acquire data about an architectural structure by integrating a TLS point cloud with a point cloud generated from images obtained using a non-metric digital camera (Russo and Manferdini, 2014). The complexity of shapes, distinctive to architectural structures, forces the need to perform the image orientation process based on imagery acquired from multiple camera positions. The use of image sequences in the form of video frames recorded on data storage is very useful in such instances. Using a video camera to acquire the source data for the 3D structure modelling process, greatly reduces the amount of time needed for field work. This is greatly due to the fact, that subsequent digital camera (or scanner) positions do not need to be set up.
2. RELATEDWORKS
Multi image matching algorithms are used to generate a point cloud from images or a video sequence (Nex and Rinaudo, 2008), (Delis, 2016). This method has many advantages, such as the possibility of simultaneously processing any number of
images or the fact that a given point does not have to be visible on every single image, therefore allowing for temporary occlusions. This group of methods also reduces the problems occurring when there is more than one point of the image that meets the correlation conditions.
Simultaneous multi-image correlation methods include, among others, MPGC (Multiphoto Geometrically Constrained) method (Remondino et al., 2008) and the SGM (Semi Global Matching) method (Hirschmuller, 2008). The MPGC method combines the advantages of the ABM (Area Based Matching) and the FBM (Feature Based Matching) methods. MPM uses characteristic points and the edges of the object. As part of the MPM methods, three operations on each image pyramid are performed: searching and matching points and edges, the integration of these elements and generating an initial grid of triangles.
The SGM method works on images with known interior and exterior orientation elements. The SGM method consists of the two stages. In the first, for each image pixel along the epipolar line, the difference between the pixel intensity of the base image and the individual pixels of the matched image are determined. This difference is called the cost function. The cost is higher the greater the difference pixel intensity. Then, in order to increase the accuracy of image matching, a second condition had been added. Namely, the parallax map should be as smooth as possible.
lighting and atmospheric conditions, using the same equipment (one camera and one lens), ensuring an opaque surface, avoiding smooth or uniform textures, knowledge of the exterior and / or relative orientation of the images. In most publications, the use of video cameras for 3D modelling is paired with the use of a SFM algorithm, which indeed greatly automates the 3D modelling process, however the resulting 3D model is characterized by low accuracy. higher accuracies can only be obtained when acquiring data using an image-sequence mode instead of video (Pollefeys et al., 2004), (Mayer, 2006).
Due to the nature in which a video camera can acquire imagery data, i.e. by registering a sequence of images, using 3D digital video cameras to model architectural structures from terrestrial data comes down to obtaining the greatest possible level of automation of this process. The aim of the study was to evaluate the possibility and accuracy of generating point clouds based on a sequence of video frames.
3. RESEARCH METHODOLOGY
The process of generating point clouds from video frames consists of a number of steps. The process of generating point clouds should be preceded by calibrating the video camera's lens. By confirming the stability of the lens's interior orientation parameters, we prove that the given camera is suitable and can acquire good quality imagery data of the architectural structure. When acquiring video data, the distance between the camera and the filmed object, the angular exterior orientation parameters as well as the speed of the camera's movement should all remain constant. When this is achieved, it is possible to implement the following
where p = overlap between subsequent video frames Ps = image pixel size,
d = distance between video camera and object, f = focal length,
v = velocity of video camera,
LPH = number of pixels of the video camera matrix in the horizontal direction,
I = the number of video frames Q per second
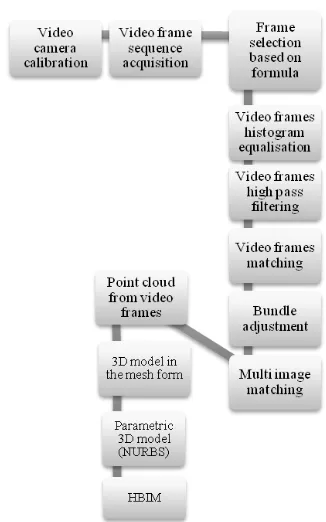
Figure 1. Proposed methodology of generating a HBIM from video frames
Two cameras were used in this study: Sony NEX-5N (for the test object) and Sony NEX-VG10E (for the historic building). In both cases, a Sony α f = 16 mm fixed focus wide-angle p2 0,000006 ±0,000020 0,000006 ±0,000010 pixel
size 10,8 μm 4,9 μm
Single frames with sufficient overlap were selected from the video sequence using an equation for automatic frame selection.
In order to improve the quality of the generated point clouds, each video frame underwent histogram equalization and image sharpening. Point clouds were generated from the video frames using the SGM-like image matching algorithm, available in Agisoft Photo Scan Software.
4.1 Generating a point cloud from video frames using different processing parmeters
In order to verify whether or not performing a series of operations on the video frames, such as high-pass filtration and histogram equalization, would have a positive effect on the quality of the final product, three different point clouds were generated from the 85% overlap video data: using unprocessed data, data which underwent histogram equalization and data which underwent both high pass filtration and histogram equalization.
a) b)
c)
Figure 2. A fragment of the point cloud generated from video frames on unprocessed data (a), (b) data which underwent histogram equalization and variant, (c) data which underwent
both high pass filtration and histogram equalization
An analysis of figure 3 shows that the point cloud generated from unprocessed data has the lowest quality. Visual analysis of the remaining two point clouds does not reveal any significant differences. The accuracy assessment of the point clouds shown above is described in section 5.
Compared to a point cloud generated from raw data (unprocessed video frames), the number of points making up the point cloud generated from video data which had been preprocessed using histogram equalization increased by 8.3%, whereas in the case of the data being preprocessed using both a high pass filtration and histogram equalization, this number rose by 3.7%.
4.2 Generating point clouds of the test object based on video frames with different amounts of overlap
In order to generate a point cloud of the test object from video frames with 60% overlap, 9 video frames were selected (Figure 2a). The created point cloud consisted of about 131
thousand points. In order to generate a point cloud of the test object from video frames with 85% overlap, 31 video frames were selected (Figure 2a). The created point cloud consisted of about 169 thousand points.
a)
b)
Figure 3. Test object point cloud generated from video frames a) with the 60% coverage, b) with the 85% coverage
When comparing these two point clouds it is evident, that the point cloud generated using the 85% overlap video frames is of much higher quality in comparison to the 60% overlap data. In contrast to the cloud generated from 9 video frames, the point cloud of the test object's facade generated using the 80% overlap video frames, is characterized by a much greater smoothness and has fewer geometric deformations. The edges and architectural details are well defined. Only a small amount of noise is visible around the barred windows.
4.3. Generating point clouds of the historic building based on video frames with different amounts of overlap
In order to generate a point cloud of a historic building from video frames with a 60% overlap, only 5 video frames were used (Figure 3a). The generated point cloud consists of about 72 thousand points. In order to generate a point cloud of a historic building from video frames with a 90% overlap, 22 video frames were used (Figure 3b). The number of points in this cloud is 2.5 greater than for the 9-frame-based cloud and is equal to about 183 thousand.
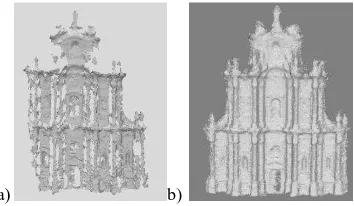
a) b)
Figure 4. Historic building point cloud generated from video frames a) with the 60% coverage, b) with the 90% coverage There are many void areas on the point of the facade of the Church of St. Joseph of the Visitationists in Warsaw generated from 60% overlap video frames. the point cloud doesn't fully cover the entire researched area. This is especially visible on the left edge of the structure and on the third storey. The point cloud of the Visitationists Church facade generated using 90% overlap video frames has a higher quality and covers the full extent of the structure. The only void areas in the point cloud can be seen on the doors, which were in motion during the measurements.
Figure 5. Model of the Visitationists Church in Warsaw in the form of a mesh
Above 3D model of the Visitationists in the form of a mesh (Figure 5) can be used to a parametric 3D model generation. There are a lot software to transform point cloud or mesh to the parametric form, for example Resurf (Rhinoceros), Polyworks, Mesh to Solid for Autocad.
Figure 6. Exampled NURBS planes generated based on 3D model in the form of a mesh of the test object
5. RESULTS AND DISCUSSION
The accuracy assessment was based on two reference point clouds: the first from terrestrial laser scanner Leica Scan Station 2 (Figure 7), with 3,5 million points in the cloud and the second generated based on images acquired using a high resolution camera, the NIKON D800 with a 24 mm focal length (Figure 8).
Figure 7. Reference point cloud of test object from Terrestrial Laser Scanner
Figure 8. Reference point cloud of the test object from the high resolution NIKON D800 camera
The accuracy assessment involved determining the distance between the reference cloud and the cloud generated from the video data. This analysis was conducted in CouldCompare software. In order to calculate distance from each point of the compared cloud to its nearest point in the reference cloud, in the CloudCompare software, the reference cloud is locally modelled by fitting a mathematical model on the nearest point and several of its neighbours. In this case the mathematical model a 2D1/2 Delaunay triangulation were used.
5.1. A study of the relationship between the video frames' processing parameters and the quality of the point cloud
The study of the relationship between the video frames' processing parameters was based on a comparison between
data processed in three different ways and TLS data using CloudCompare software. The figures below show the results of substracting point clouds created from video frames in three different processing variants from a TLS point cloud. The analyses were conducted on data on a point cloud generated from an image sequence consisting of every 24th frame with an overlap of 90%.
a)
b)
Figure 9. Accuracy assessment of a point cloud generated from raw video frames with reference to TLS data
a) in graphical form and b) as a plot
a)
b)
Figure 10. Accuracy assessment of a point cloud generated from video frames with histogram equalization with reference
to TLS data a) in graphical form and b) as a plot
a)
b)
Figure 11. Accuracy assessment of a point cloud generated from video frames with low-pass filtration and histogram equalization with reference to TLS data a) in graphical form and b) as a plot.
been processed using a high pass filter and histogram equalization has the highest accuracy. The greatest differences between the point cloud and the reference model, exceeding 7 cm, are located in the central part of the structure. Regarding the remaining two point clouds, the differences between them and the reference TLS data are slightly higher and occur on a greater area. The results shown in Table 2 confirm the above conclusions.
distance [cm]
σ[cm] max error [cm] average max.
raw video frames 3.3 20.1 6.0 7.1
video frames after histogram equalization
5.6 28.3 7.1 7.1
video frames after high pass filtering and histogram equalization
1.5 14.1 4.3 7.0
Table 2. Results of the accuracy assessment of point clouds generated from video data which had been processed in three
different ways
The average distance between points with relation to the TLS point cloud varies between 1.5 and 5.6 cm. The average error is smallest for the point cloud generated from video data which had been processed using a high pass filter and histogram equalization. The histogram equalization process conducted on the video frames before image matching, made it possible to eliminate coarse errors, minimizing the maximum error by half. The average error is equal to 4.3cm relative to the TLS data.
5.2. A study of the impact of the size of the overlap between subsequent video frames on the dense image matching outcome
The aim of the conducted experiment was to assess the accuracy of the point cloud generated from video frames with reference to the overlap between subsequent frames. As part of the experiment, analyses were performed on two point clouds generated from two different sets of video frames, one with an overlap of 60%, the other 85%.
a)
b)
Figure 12. Accuracy assessment of a point cloud generated from video frames with a 60% overlap, with reference to TLS
data a) in graphical form and b) as a plot
a)
b)
Figure 13. Accuracy assessment of a point cloud generated from video frames with a 85% overlap, with reference to TLS
data a) in graphical form and b) as a plot
The figures above unanimously suggest that the point cloud generated from video data which had been generated from 90% overlap video frames has the highest accuracy. For the point cloud generated from the 60% overlap data, the greatest differences can be seem mainly in the central part of the test structure.
coverage distance [cm] σ[cm] max error [cm] average max.
85% 1.5 14.1 4.3 7.0
60% 5.6 62.9 8.7 7.4
Table 3. Results of the accuracy assessment of point clouds generated based on video frames with varying overlap, with
reference to TLS data
Table 3 and the above images show a strong correlation between the amount of overlap between the input video frames and the accuracy and level of detail of the output point cloud. The greatest possible overlap is recommended. The accuracy of the point cloud generated from video data, with reference to TLS data is, at best, 4.3cm.
The analyses that followed were based on substracting two point clouds: one generated from video frames with a 90% overlap and the other obtained from NIKON D800 imagery with 60% overlap.
a)
b)
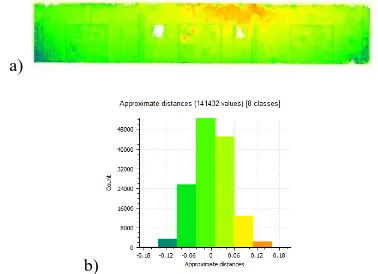
Figure 14. Accuracy assessment of a point cloud generated from video frames with a 90% overlap, with reference to a point cloud from NIKON D800 data a) in graphical form
The plot above shows that the error of the points from the point cloud generated from video data relative to the high resolution digital camera data, has a uniform distribution on the entire surface of the test object.
coverage
Table 4. Results of accuracy assessment of point clouds generated from video frames with a 90% overlap, with
reference to a point cloud from NIKON D800 data The errors of the point cloud generated from video data relative to the points derived from the high resolution digital camera are greater than those relative to TLS data and are over 6 cm. The increase in the error value relative to the NIKON data may be caused by the fact that these data themselves are less accurate compared to TLS data.
The next step in our research involved an accuracy assessment of a point cloud of the Visitationists Church generated from 90% overlap video data compared to TLS data.
a) b)
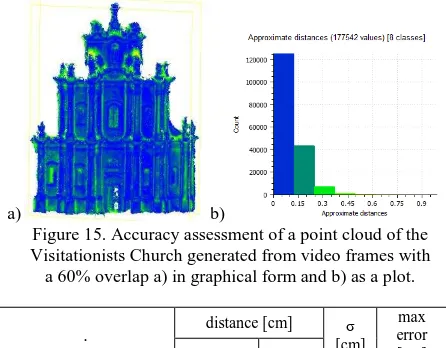
Figure 15. Accuracy assessment of a point cloud of the Visitationists Church generated from video frames with a 60% overlap a) in graphical form and b) as a plot.
Visitationists Church 7.5 1.1 12.3 12.4 Table 5. Results of accuracy assessment of point clouds of the Visitationists Church in Warsaw generated from video
frames with reference to TLS data
The error of the Visitationists Church point cloud, which had been generated from video data, with relation to TLS data is relatively large - over 12 cm. This is due to the large dimensions of the structure. In order to obtain smaller errors, the video data should be acquired not from the ground but, for example from a UAV (Wefelscheid et al, 2011).
6.CONCLUSION
The performed research has shown, that highest accuracies are obtained for point clouds generated from video frames, An accuracy of 4.3cm was achieved for the point cloud with reference to TLS data. However, when dealing with a tall structure (about 30 meters high), such as the Church of the Visitationists in Warsaw, this error may be 3 times greater. when performing photogrametric works of such tall structures, it is better to acquire data using a UAV.
Based on the point cloud generated from video data, the parametric 3D model had been generated. The parametric 3D model consist of NURBS and Bezier curves or NURBS and B-spline planes. This type of the 3D model can be used in HBIM construction. One of method of point cloud fitting into a parametric 3D model is the Constructive Solid Geometry (CSG) method.
The ratio between the number of points in a point cloud from video frames to that in a point cloud from TLS is only 4.2%. This is a very small value, which can however be a great advantage as a smaller number of points means less digital storage needed, which is extremely important when processing point clouds of a large area (GIS, 3D geoportals, 3D models of cities).
The study showed that the point cloud generated from video data can complement the data acquired using TLS technology when the TLS measurement is for some reason restricted on a section of the structure. Point clouds generated from video data could be used to create 3D models for many applications, such as: architecture, archeology, for conservations services, museology or even spatial planning and urban studies. 3D models of structures are also a very popular tool in the popularization of knowledge about cultural heritage objects.
ACKNOWLEDGEMENTS
This paper had been supported by the Military University of Technology, the Faculty of Civil Engineering and Geodesy, Department of Remote Sensing, Photogrammetry and Imagery Intelligence as a research project 933/2016.
REFERENCES
Barazzetti, L., Banfi, F., Brumana, R., Oreni, D., Previtali, M., & Roncoroni, F., 2015. HBIM and augmented information: towards a wider user community of image and range-based reconstructions. In: The International Archives of Photogrammetry, Remote Sensing and Spatial Information Sciences, Vol. 40(5), pp.35-42.
Delis, P., Wojtkowska, M., Nerc, P., Ewiak, I., Lada, A., 2016. Integration of geodata in documenting castle ruins. In: International Archives of the Photogrammetry, Remote Sensing and Spatial Information Sciences, Vol. 41(B3) pp. 345-349.
Mayer, H., 2007. 3D reconstruction and visualization of urban scenes from uncalibrated wide-baseline image sequences. In: Photogrammetrie Fernerkundung geoinformation, 2007(3), 167.
Nex, F., Rinaudo, F., 2008. Multi-image matching: An “Old And New” photogrammetric answer to lidar techniques. In: Proceedings of the International Archives of the Photogrammetry, Remote Sensing and Spatial Information Sciences, Vol. 37(5) pp. 3-11
Pollefeys, M., Van Gool L., Vergauwen M., Verbiest F., Cornelis K., Tops J. Koch R., 2004. Visual modeling with a hand-held camera, In: International Journal of Computer Vision, Vol. 59(3), pp. 207-232.
Remondino F., El-Hakim S. F., Gruen A., Zhang L., 2008. Turning images into 3-D models- development and performance analysis of image matching for detailed surface reconstruction of heritage objects. In: IEEE Signal Processing Magazine, vol. 25(4), pp. 55–65.