KNOWLEDGE AND VALORIZATION OF HISTORICAL SITES THROUGH 3D
DOCUMENTATION AND MODELING
E. Farella1, F. Menna2, E. Nocerino2, D. Morabito2, F. Remondino2*, M. Campi1
1 Dept. of Architecture, Federico II University, Naples, Italy
2 3D Optical Metrology (3DOM) unit, Bruno Kessler Foundation (FBK), Trento, Italy
(fmenna, nocerino, morabito, remondino)@fbk.eu, http://3dom.fbk.eu
Commission V, WG V/2
KEY WORDS: Cultural Heritage, Documentation, 3D Reconstruction, 3D Modeling, Visualization, Virtual Tour
ABSTRACT:
The paper presents the first results of an interdisciplinary project related to the 3D documentation, dissemination, valorization and digital access of archeological sites. Beside the mere 3D documentation aim, the project has two goals: (i) to easily explore and share via web references and results of the interdisciplinary work, including the interpretative process and the final reconstruction of the remains; (ii) to promote and valorize archaeological areas using reality-based 3D data and Virtual Reality devices. This method has been verified on the ruins of the archeological site of Pausilypon, a maritime villa of Roman period (Naples, Italy). Using Unity3D, the virtual tour of the heritage site was integrated and enriched with the surveyed 3D data, text documents, CAAD reconstruction hypotheses, drawings, photos, etc. In this way, starting from the actual appearance of the ruins (panoramic images), passing through the 3D digital surveying models and several other historical information, the user is able to access virtual contents and reconstructed scenarios, all in a single virtual, interactive and immersive environment. These contents and scenarios allow to derive documentation and geometrical information, understand the site, perform analyses, see interpretative processes, communicate historical information and valorize the heritage location.
a) b) c) d)
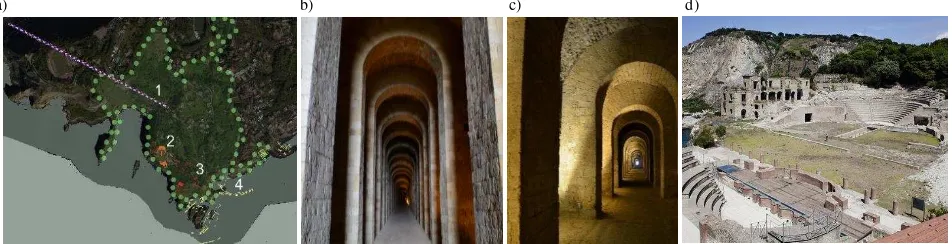
Figure 1: a) The archaeological site of Pausilypon (1: Grotta di Seiano; 2: Theatres area; 3: Other structures covered by vegetation; 4: Structures
partially or completely submerged); b-c) Grotta di Seiano; d) Theatres area.
1. INTRODUCTION
Digital innovation, in few years, has led to a deep changing in the field of representation and visualization, providing inedited scenarios for knowledge, documentation and preservation of Cultural Heritage. Nowadays the development of several instruments, procedures and techniques for 3D reality-based digital documentation and reconstruction allows a deeper comprehension of heritage sites and artifacts, through the accurate recording of shapes, geometries and colorimetric information. These data are very important in this particular field, if we consider some critical issues in historical artifacts documentation that require a large amount of information: archaeological material is often fragmented, fragile and
difficult to interpret. Documentation has to include all the colorimetric and geometrical information useful for understanding constructive phases, original shapes and functions of remains;
data acquisition has to be as much neutral and complete as possible. Traditional techniques of surveying often require a great level of simplification and selection of data to acquire.
* Corresponding author
The risk is to lose information about irregular shapes and features of ancient walls, that could highlight particular constructive choices in the interpretative phase;
historical investigations require multiple scales of representation, to underline relationship between artifacts and their context besides recording a lot of important details. 3D documentation of Cultural Heritage through the integration of several geomatics techniques (Galeazzi et al. 2014; Remondino and Campana, 2014; Remondino 2011) is getting more and more a common practice. 3D data are able to answer to these different archeological needs, passing through the limits of a traditional documentation.
Even though the use of innovative technologies and procedures for 3D heritage recording has become common, some issues are still open:
accessibility of 3D contents and derived data. 3D models obtained from reality based techniques are often difficult to manage because of the huge amount of data involved. At the same time, the visualization of these data is fundamental for validating theories, analyses and reconstructive hypothesis produced in this field;
how to collect and to interact with heterogeneous 2D and 3D documentation produced;
how to communicate investigation results in order to valorize cultural heritage and to promote its knowledge and preservation.
2. RELATED WORKS AND PROJECT AIMS
This paper presents the first results of an interdisciplinary project for the 3D documentation, dissemination, valorization and digital access the archaeological site of Pausilypon (Naples, Italy). Multi-techniques procedures were used to record different architectures and to obtain 3D digital reality-based models. Constructive solutions, morphological and spatial features of these artifacts were analyzed through 3D data acquired. 3D reconstruction is a traditional practice in the archaeological field, used for investigating the ancient aspect of these fragile and fragmented artefacts (Guidi et al., 2014).
The development of computer graphic and rendering techniques has allowed a real revolution in this discipline: from the first static and photo-realistic reconstructions of Virtual-Archaeology in the 90’s, until the actual interactive simulations of the past of the Cyber-Archaeologic era. The innovation of tools and procedures for 3D modelling has led also to a great advancement in the theoretical principles of archaeology (Forte, 2010). Today, everyone agrees that 3D digital models are essential for preserving our Cultural Heritage. At the same time, the access to digital resources, along with historical sources (publications, drawings, old pictures) used for analyses is still limited. The development of Virtual Reality applications (Cameron et al., 2007; Jimenez, Fernandez-Palacios et al., 2015) allows to access and to interact with archaeological information in different ways. The great advantage of these platforms for sharing products is their capability of supporting and managing different types of 2D and 3D data in a unique virtual environment.
Past works of documentation and dissemination of historical heritage have demonstrated that it is possible to digitally explore and interact with different archaeological data. In the Digital Hadrian’s Villa Project (Frischer et al. 2012; Taylor-Helms 2013, http://vwhl.soic.indiana.edu/villa/mission.php), besides the access to textual and iconographic information (surveying data and methods, historical sources used for the reconstructive modelling), different contents are available such as navigation into panoramic images of the site, access to 3D models of hypothetic reconstructions and other digital multimedia contents. Other similar projects offer different levels of navigation and interaction with 2D and 3D archeological data, as Aquae Patavinae Project (Fanini et al., 2013,
http://www.aquaepatavinae.it/portale/), MayaArch3D Project (von Schwerin, 2013, http://www.mayaarch3d.org ) or Giza 3D Project (Der Manuelian 2013, http://giza3d.3ds.com/#discover). The presented project follows the lines of other related projects and besides the mere 3D documentation and reconstruction of a large and complex site, it aims to (i) easily explore and share via web previous studies and new material, with a disseminative purpose and (ii) promote and valorize archaeological areas using Virtual Reality (VR) devices and reality-based 3D data. The enriched virtual tour developed for this project, using Unity 3D, allows to navigate into heterogeneous 3D and 2D data (3D digital surveyed models, 3D reconstructive models realized with CAAD methods, 2D text documents, historical photos and drawings) in a unique virtual interactive environment. The simultaneous visualization and the overlapping of various heterogeneous elements in the virtual scenes allows to easily understand the interpretative process followed for the final results.
The virtual tour realized for this project is based on two different types of users and respective levels of interaction:
1. Products shared via web, with disseminative purposes, are mainly for expert-users. In this tour scientists and scholars can easily access and interact with the complete archaeological digital documentation elaborated (surveyed 3D data, text documents, CAAD reconstruction hypothesis, drawing and photos).
2. A simplified virtual tour, with a promotional purpose, has been developed for Virtual Reality devices, allowing an immersive experience for promoting the knowledge of the site and its preservation.
3. THE PAUSILYPON SITE
The case study of this project is the archaeological site of Pausilypon (Naples, Italy), used for testing the entire process, from the 3D data acquisition to the final access of the merged heterogeneous contents. In Pausilypon are preserved the ruins of an amazing villa of Roman period (Viggiani 1993; Castronuovo, 2000; Varriale, 2011). The villa is one of the first examples of roman construction in harmony with landscape, with different structures organized on three-level terraces. Nowadays remains visible represent probably only 10% of the original ones, therefore it is difficult to identify and completely understand the early configuration of the entire site. This work is focused on two main areas. The first area (ca 1 ha), on the upper terrace, includes the ruins of a Theatre (47x22m, it could host up to 2000 people) and an Odeon (23x25 m) (Figure 1d). The Theatre is a unique example of roman theatre built according to Greek’s rules, above the natural slope of the hill and not carved into the rock. Different singular architectonic solutions temporally place this architecture in a transitional and experimental period. In front of the theatre, the Odeon was instead a smaller and originally covered structure, used for musical performances. On both sides, other public rooms are today partially collapsed into the underlying Trentaremi Bay. The second area of investigation hereafter presented is the monumental entrance to the villa, the so-called Grotta di Seiano (Figure 1b and c) (Soprintendenza Archeologica di Napoli e Caserta, 1999). Different strengthening elements (arches) are today visible inside this tunnel, about 800 m long, realized in the 19th century to reactivate the passage after several collapses.
4. REALITY-BASED 3D SURVEY
In order to produce a 3D reality-based model of the heritage site, multiple surveying techniques were employed, according to the different characteristics and conditions of the areas of interest.
4.1 The 3D survey of the theatres
The area of the theatres (ca 1 ha), in addition to the two main structures, preserves the remains of some other rooms and connective corridors and stairs not so wide. The survey of the theatres area was carried out with different techniques and procedures. Through 3D data integration, suitable information about the main features as well as geometric relationships between the different structures was obtained. These data are important for understanding the constructive rules of these artefacts, realized for wondering through perspectival tricks.
4.1.1 3D laser scanning survey: A Continuous Wave (CW) Faro Focus 3D S120 laser scanner, with a field of view of 360° x 305° and an integrated camera, was used for the range-based 3D survey of the theatres.
a) b)
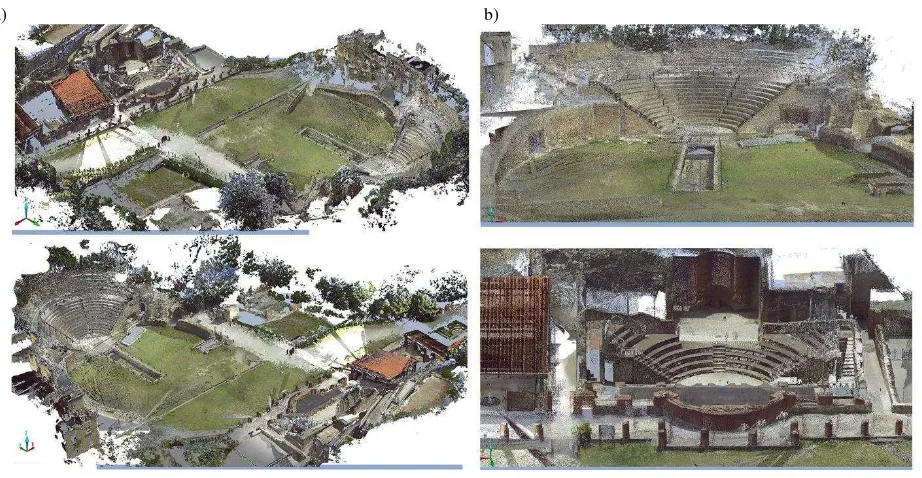
Figure 2: TLS point cloud. a) the entire theatres area (left); b) the Theatre and the Odeon (right). The range sensor uses a phase shift technology for measuring
distances, repeating the single point measurements up to 976,000 times per second. The Focus 3D S120 (Table 1) scanner has a range acquisition of 0.6/120 m and was considered suitable for recording not only the main structures but also the different passages and stairs connecting the rooms and the different areas.
FARO FOCUS 3D S120
Type Phase Shift
Wavelenght 905 nm
Beam divergence 0.16 mrad
Ranging error ± 2 mm @ 10 m and @25 m
Ranging noise 0.6 mm @ 10 m
0.95 @ 25 m
Table 1. TLS technical specification.
In the planning phase, we chose to scan at a medium resolution and quality, with a spatial resolution of 6 mm at 10 m: this was considered a sufficient sampling step for the site. The entire area was surveyed with 29 scans, using planar printed checkboards targets and spheres for the automatic alignment and registration procedure within the proprietary software Faro Scene. A final point cloud of about 370 million points was obtained (Figure 2).
4.1.2 The photogrammetric survey: A terrestrial photogrammetric survey was carried out to integrate the data missing in the laser scanning 3D survey and to obtain a better color information for the final texturing of the 3D digital models. Using a Nikon D7000 and a Zoom-Nikkor 18-55 lens set at 24 mm view, a mean GSD of less than 4 mm was planned maintaining an average distance of 25 m from the object. A mean overlap of about 70% was chosen, acquiring 137 images of the Theatre and adjacent structures. A radiometric pre-processing of the acquired raw images was necessary considering the highly variable lighting conditions during the survey. The images were automatically oriented in a state-of-the-art Structure from Motion (SfM) software application (Agisoft PhotoScan). The photogrammetric model was scaled using a known distance
measured in the field: no object deformations were noticed. A dense image matching was finally produced, choosing a dense image matching sampling step of 2 times the original GSD and obtaining a dense point cloud of about 30 million points (Figure 3).
Figure 3: Two different views of the photogrammetric point cloud.
4.1.2 Data integration: The alignment and integration of TLS and photogrammetric point clouds was carried out choosing the laser scanning coordinate system as reference (Figure 4) and applying a similarity transformation.
4.2 The survey of “Grotta di Seiano”
The Grotta di Seiano (about 800 m long) is an underground passage formerly used as monumental entrance to the roman villa and only recently reopened to the public for the access to the theatres area. The tunnel is poorly illuminated with artificial lighting, except for the entrances, naturally illuminated Due to the numerous strengthening masonry arches, the inner space of the tunnel is segmented in several small compartments that needed a careful planning of surveying operations as well as an accurate choice of appropriated instruments and procedures. The International Archives of the Photogrammetry, Remote Sensing and Spatial Information Sciences, Volume XLI-B5, 2016
a) b)
c)
Figure 4: An example of common points chosen in the TLS (a) and photogrammetric (b) point clouds; c) fused data after the registration
process.
The 3D digital documentation of Grotta di Seiano required different approaches and procedures with respect to the area of the theatres. The use of phase-shift laser scanning demonstrated to be suitable for some underground 3D structures (Rodriguez et al., 2015; Caputo et al., 2011).
Nevertheless, due to its length, straightness and complexity (narrow stretches and numerous arches), the tunnel would have required several days of scanning and a very high number of stations to obtain a complete 3D model. At the same time, due to the low ambient lightning conditions of the tunnel, a whole photogrammetric acquisition in a reasonable time was not considered a feasible solution.
Considering the budget and time constraints, a different technology was selected as possible alternative: the Zeb1 mobile mapping system (http://geoslam.com/). Despite the authors were aware of the possible ill-posed geometry of the tunnel with narrow and elongated (and sometimes featureless) sections, a test was conducted to stress the strength and limitations of the range sensor. Indeed, such instrument may be an innovative solution for 3D fast digitization but clear figures about its accuracy and reliability must be found.
4.2.1 The hand-held 3D mobile mapping system: The Zeb1 3D mobile mapping system (Zlot et al., 2013) is a handheld device for outdoor and indoor acquisitions, already tested also in similar conditions and in underground caves (Zlot et al., 2014) and mines. This device has a laser scanner profilometer and an inertial measurement unit (IMU) mounted on a spring. These elements are then connected to a micro-computer/battery unit which fits in a backpack. The laser scanner field of view is 270° with a maximum range of 30 m. The swinging of the device, using the passive linkage mechanism of the spring, increases the field of acquisition of the 2D laser scanner, giving back in this way three-dimensional information.
The very low size and weight of this technology allow to easily acquire measurements simply walking through environments, without using particular platforms. The average time suggested for data acquisition is around 20 minutes. Once the survey operation is finished, the device has to be put down and left still for some seconds so that the IMU can indicate the micro-computer to stop the acquisition.
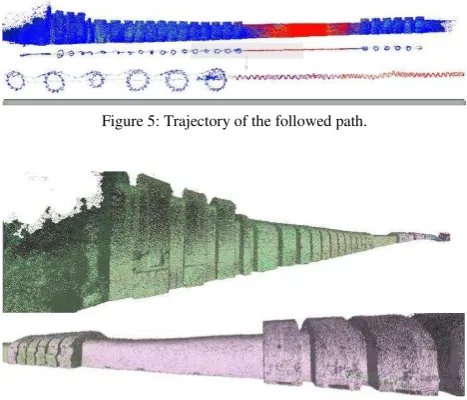
The Zeb1 device uses a Simultaneous Localization and Mapping (SLAM) algorithm to estimate 3D scanner positions and orientations and merge all the acquired data. In every swinging, the laser scanner acquires a local view of the captured scene with its surface elements (their positions and normal directions). The trajectory (Figure 5) is estimated through comparisons between the same surface geometries captured at different times. The 3D documentation of Grotta di Seiano (Figure 6 and 7) required eight separate scans for covering the entire length of the tunnel plus the area outside the two entrances. A single acquisition would have not been possible due to the suggested limit of 20 minutes per scan. The average path followed for every acquisition was about 150 m, covered turning back to the starting point in less than 20 minutes and with a mean speed of 0.9 Km/h. The whole tunnel was recorded in one day of work. White wooden circular targets of 30 cm diameter were specifically designed and placed on their own stand in several locations inside the tunnel – and surveyed also with a total station (Section 4.2.2). The circular targets were positioned in the overlapping area (about 40 m) between two consecutive scans. At least five targets were planned to be visible in each scanned section and two of them were recorded in consecutive scans in the overlapping area. By capturing the targets position in several sections, we could verify the reliability of obtained results in the following phases. For this purpose, the same targets where measured also with a total station by means of a topographic network of the entire underground passage.
Figure 5: Trajectory of the followed path.
Figure 6: The entire point cloud of the tunnel after merging the various acquisitions.
Figure 7: Plan and elevation of the final point cloud.
4.2.2 The topographic network: A TOPCN GPT 7001i total station (Table 2) was also employed to survey the Grotta. Constrained by the passage geometry, a combination of triangulation, trilateration and open traverse was used. The 750 measurements of angles and distances taken from 13 stations were adjusted using the open source software GAMA (Čepek, 2002). 3D coordinates of 25 circular targets were also obtained from this adjustment whose average coordinate precision in space from least square adjustment was σxyz <6 mm.
Topcon GPT7001i Range measurement accuracy (non-prism) ±5 mm
Range (non-prism) 1.5 to 250 m
Angle measurement accuracy (non-prism) 1”
Tilt correction Dual axis
Compensating range ±4”
Table 2. Main technical specifications of the total stations used for the geodetic survey of Grotta di Seiano.
4.2.3 Evaluation of 3D results: The various Zeb1 3D point cloud of the tunnel were processed in CloudCompare. First a manual transformation was applied to roughly align consecutive scans. Then a finer registration based on ICP method was performed considering the whole overlapping geometry. This process was used for all adjacent datasets, considering the previous registered point cloud as reference. The maximum final RMS Error of the registration between two successive sections was 0.14 m.
The final 3D point cloud, obtained with this procedure, contains approximately 24 mil points.
The aligned Zeb1 point cloud was then checked against the topographic surveying data. All the targets visible in the 3D point cloud were exported in PolyWorks in order to estimate for each of them the best-fit plane and then precisely measure the coordinates of their centres through a circular fitting on the plane (Figure 8). This work was necessary considering the quite noisy point clouds obtained with the Zeb1 sensor.
a) b)
c)
Figure 8: a-b) Selection of targets in the Zeb1 point cloud; c) Best fit circular plane and extraction of centres.
A rigid similarity transformation was carried out using two sets of coordinates (topographic and laser scanner) and choosing as reference the topographic network. The final RMSE of the alignment was of 9.44 m which was not acceptable for our project. The reasons of such value could be twofold: an error in identifying the centres of the targets (due to the low-res and noisy Zeb1 point clouds) and a block deformation of the acquired scans.
The same procedure was repeated verifying the RMSE for each separate scan, using for the alignment the coordinates of targets visible in each scan. This procedure allowed to highlight the point clouds with higher alignment error (Table 3).
DATASET RMSE (m) of single scan
RMSE (m) of segmented scans
1 3.266 0.072
2 0.607 0.637
3 0.042 0.050
4 5.824 0.082
5 2.027 0.109
6 0.041 0.089
7 0.023 0.034
8 0.862 0.051
Table 3: RMSE of the similarity transformation between the topographic points and the single Zeb1 acquisitions (central column)
and for each segmented point cloud (last column).
The registration results were further investigated: big errors were found for the point clouds containing long walls, with no geometrical elements (no strengthening masonry arches). The registration was then repeated following a new procedure: each single scan was segmented in correspondence of the circular targets and only the segments showing a low transformation error with respect to the topographic coordinates were retained. With this procedure much better RMSE were obtained (Table 3). The final mean RMS Error of the complete 3D point cloud registered with this procedure was then 0.13 m.
5. REALITY-BASED 3D MODELING
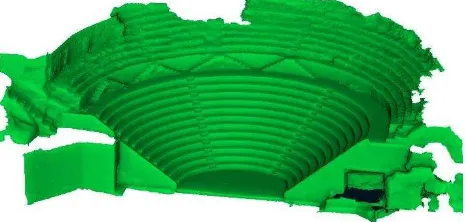
The following modeling phase was focused on the Theatre area, although the developed procedure can be conveniently adapted to the Grotta. The first step consisted in a manual cleaning of noise and vegetation. Considering the aims of communication, dissemination and valorization, the merged TLS and photogrammetric point cloud was decimated at 5 cm sampling step, providing a final point cloud about 16 million points. A polygonal mesh model was generated using the Poisson surface reconstruction algorithm implemented in CloudCompare (CloudCompare 2015). This tool allows to choose the mesh resolution through the octree level, based on the spatial resolution defined by users. A final mesh model of about 16 million of triangles was obtained (Figure 9).
Figure 9: Polygonal model generated with Poisson algorithm. Different topological errors, holes and missing parts characterized the model, mainly due to residual noise and non-uniform density of the point cloud. After editing the mesh model, the last step consisted in texture mapping (Figure 10), using the images acquired for the photogrammetric survey (Section 4.1.2). The International Archives of the Photogrammetry, Remote Sensing and Spatial Information Sciences, Volume XLI-B5, 2016
Figure 10: Textured 3D model of the Theatre.
6. 3D RECONSTRUCTIVE MODELING
6.1 Historical sources
Iconographic and descriptive sources (Fusco et al. 1842; Alvino 2001) illustrates the first relevant restoration work in the 19th century, when the construction of a house above some parts of the Theatre was commissioned. Other rooms and spaces were irreparably modified. Few years later, when Theodore Robert Gunther (Gunther, 1913) started the more complete documentation of the entire site, the aspect of the archaeological area was totally different from the original appearance. Consequently, it may be argued that the most relevant transformation of Pausilypon occurred in the early Nineties. When other restoration works started for allowing the public access to this site, a partial reconstruction of this area was carried out. Today ancient and contemporary constructive material are difficult to recognize. These interventions and few iconographical sources of previous conditions make difficult to reconfigure the original aspect of this area. Therefore the interpretative analysis of remains, text documents, photos and drawings was a fundamental step for producing a correct reconstructive hypothesis.
6.2 3D Reconstruction of the Theatre
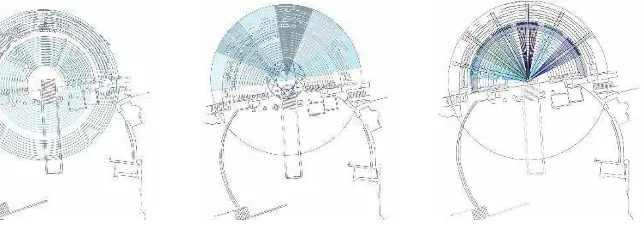
Geometrical features were extracted from the 3D mesh model of the Theatre using best fitting procedures. Proportions and geometrical relationships among the elements of these structures were analysed for acquiring information about the constructive rules adopted for its realization (Figure 11). Two-dimensional drawings and schemes, produced in the first phase, have been then compared with descriptions and previous surveys. This investigation has immediately revealed morphological anomalies and geometrical irregularities. By comparing the extracted
drawings with other Roman theatres of the same historical period, the Pausilypon Theatre appears not to respect standard constructive rules. A hypothetical virtual reconstruction of the Theatre is shown in Figure 12.
The final 3D reconstruction will display levels of reliability of the model proposed, based on the available historical documentation and through the use of appropriated different techniques of representation.
Figure 12: A first hypothetical reconstruction of the Theatre. 7. THE VIRTUAL TOUR OF PAUSILYPON
New research fields and perspective in archaeology are always more based on the level of interaction with information. Pushing by this trend, the last step of the project proposes the development of a new way to share, visualize and interact with archaeological documentation. Two different virtual applications were developed in Unity 3D (https://unity3d.com/), addressed to two typologies of user (researchers and non-experts) and characterised by two related levels of contents and interaction. Unity3D is one of the most popular Videogame Engines. It features powerful graphics and physics engines and simplifies the development of 2D and 3D interactive applications, three-dimensional environments and architectural views. We choose Unity 3D as developing tools for it great performances, ease of use and thanks to our previous positive experiences in development VR applications (Agugiaro et al., 2011; Richards-Rissetto et al., 2012).
The virtual tour shared via web contains all 2D and 3D data produced in the project, with a disseminative purpose. Researchers will be allowed to navigate and to visualize the entire available documentation, the interpretative process and relative results. The developed virtual application allows for an immersive visualization of the different contents, organised in a hierarchical level:
Figure 11: Extraction of main geometrical features.
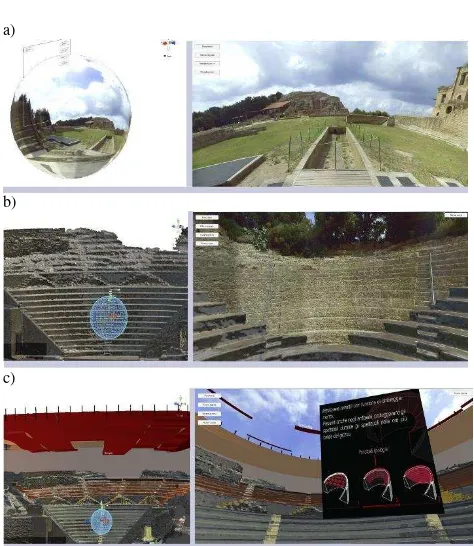
The first level of visualization includes the 360° equi-rectangular panoramic images acquired in different positions within the site. Images were acquired with a Nikon D7000 and a 18 mm lens, mounted above a panoramic head. Using a horizontal overlapping of about 50% and vertical of 40%, 48 images were acquired for each panorama, elaborated with PTGui software. The panoramic images are projected on spherical surfaces as textures and the camera for the gaming view was positioned in the center of each panoramic image. Consequently, the point of view of the user coincides with the center of the panoramic images. The virtual tourist is allowed, in this way, to explore the scene turning around in all directions and to visualize the actual condition of the site. (Figure 13a).
The second level of the scene includes panoramic images and 3D reality-based data. The visualization of the overlapped 2D and 3D data is obtained matching some coordinates of the panorama and the 3D model. User can evaluate geometrical and color information of the elaborated models. 2D information are overlapped onto the 3D model, describing the adopted methodologies and data acquired (Figure 13b). The third level represents the interpretative phase. Historical
documents and iconographic sources (drawings, photos, etc.) and a first geometrical 3D reconstruction enrich the virtual environment and describe the interpretation of the archeological remains. These elements are essential to verify the level of coherence and reliability of the virtual reconstruction (Figure 13c).
The last level of the scene presents the final 3D hypothetical reconstruction of the original aspect of the Theatre, overlapped to its actual appearance (panoramic images). This level will be enrich with textural information to simulate the original space of these architectures through their colors and materials.
a)
b)
c)
Figure 13: Unity 3D engine: scene and gaming view - 360° panoramic images (a); 3D reality-based data (b); 2D information overlapped onto
the 3D model (c).
The non-expert simplified scenario allows to navigate only through the real panoramas and hypothetical 3D reconstruction
of the Theatre, corresponding to the first and fourth levels of the complete virtual application. The development of a simplified tour for virtual devices (Figure 14) wants to promote historical heritage, generating curiosity and stimulating knowledge. Users of virtual visit are not a passive spectators but the main character that can interact with the environment and choose what should be visualize.
Figure 14: Visualization of the virtual tour through a VR device. 8. CONCLUSIONS
Nowadays the development of devices for visualization and interaction in virtual environments allows to overcome spatial and temporal boundaries. Traditional way of knowing the world through visual inputs is enriched today by new and powerful tools. The immersive visualization of distant or different realities has the extraordinary capability of simulating perspectives and real scales and proportions of architectures or landscapes. This paper presented the first results of an interdisciplinary project of knowledge, promotion and dissemination of historical heritage, carried out in the archeological site of Pausilypon in Naples (Italy). The proposed workflow for documenting, analyzing, visualizing results and valorizing an archaeological investigation could be now replicated in other historical locations.
ACKNOWLEDGMENTS
The authors are thankful to the Soprintentenza per i Beni Archeologici di Napoli and Mesa srl (www.mesasrl.it) for the support with the GeoSlam Zeb1 sensor.
REFERENCES
Agugiaro, G., Remondino, F., Girardi, G., Von Schwerin, J., Richards-Rissetto, H., De Amicis, R., 2011. A web-based interactive tool for multi-resolution 3D models of a Maya archaeological site. Int. Archives of Photogrammetry, Remote Sensing and Spatial Information Sciences, Vol. 38(5/W16).
Alvino, F., 2001. La collina di Posillipo. Napoli: Grimaldi & C. Editori.
Cameron, F., Kenderdine S., 2007. Theorizing Digital Cultural Heritage. A critical discourse. The MIT Press.
Čepek, A., 2002. The GNU Gama project-adjustment of geodetic networks. Acta Polytechnica, 42(3).
Caputo, P., Farella, E.M., Mauriello, F., 2011. La Crypta Romana di Cuma. Spazi e Culture del Mediterraneo. PRIN 2009-2011. La scuola di Pitagora editrice.
Castronuovo, S., Posillipo imperiale, Altra Stampa Edizioni, 2000.
CloudCompare, 2015. EDF R&D, Telecom ParisTech. http://www.cloudcompare.org/
Der Manuelian P., 2013. Report on Digital Heritage International Congress. “Giza 3D: Digital Archaeology and Scholarly Access to the Giza Pyramids: The Giza Project at Harvard University.” vol.2, pp.727-734.
Fanini, B., Demetrescu, E., Ferdani, D., Pescarin, S., 2013. Aquae Patavinae VR, dall’acquisizione 3D al progetto di realtà virtuale: una proposta per il museo del termalismo. In: Aquae Salutiferae. Il termalismo tra antico e contemporaneo. Padova unity press, pp.431-449.
Forte, M., 2010. Cyber-Archaeology. Archaeopress, pp. 9-13.
Frischer, B., Fillwalk, J., 2012. Report on Virtual Systems and Multimedia 18th International Conference. “The Digital Hadrian’s Villa Project Using Virtual Worlds to Control Suspected Solar Alignments”, pp-49-55.
Fusco, G.M., Fusco, V., Trojano Giampietri, A., 1842. Report on Bollettino Archeologico Vesuviano. “Giunta al commento critico sul frammento inedito di Fabio Giordano.” https://books.google.it/books/reader?id=MoUGLAiR_9oC&hl= it&printsec=frontcover&output=reader&pg=GBS.PA10
Galeazzi, F, Moyes, H & Aldenderfer, M 2014. 3D Documentation in Archaeology : Recording Las Cuevas Site, Chiquibul Reserve, Belize. In: Archaeology in the Digital Era
Volume II, Amsterdam University Press, Amsterdam, pp.
350-362.
Guidi, G., Russo, M., Angheleddu, D., 2014. 3D survey and virtual reconstruction of archaeological sites. Digital
Applications in Archeology and Cultural Heritage.
http://dx.doi.org/10.1016/j.daach.2014.01.001
Gunther, R.T., 1913. Pausilypon. The imperial villa near Neaples, wirh a description of the submerged foreshore and with observations on the tomb of Virgil and on other Roman
antiquities on Posilipo. Oxford: University Press.
https://archive.org/details/pausilyponimperi00gunt
Jiménez Fernández-Palacios, B., Nex, F., Rizzi, A., Remondino, F., 2015. ARCube - The Augmented Reality Cube for Archaeology. Archaeometry, DOI: 10.1111/arcm.12120
Nocerino, E., Menna, F., Remondino F., 2014. Accuracy of typical photogrammetric networks in cultural heritage 3D modeling projects. In: The International Archives of the Photogrammetry, Remote Sensing and Spatial Information Sciences, Volume XL-5, pp.465-472.
Remondino, F., Campana S., 2014. 3D Recording and Modelling in Archaeology and Cultural Heritage. Theories and best practices. Archaeopress.
Remondino, F., 2011. Heritage Recording and 3D Modelling with Photogrammetry and Laser Scanning. In: Remote Sensing, 3(6), pp. 1104-1138.
Richards-Rissetto, H., Remondino, F., Agugiaro, G., Robertsson, J., von-Schwerin, J., Girardi, G., 2012. Kinect and 3D GIS in archaeology. Proc. 18th IEEE Intern. Conference on Virtual Systems and MultiMedia (VSMM), pp. 331-338.
Rodrìguez-Gonzàlvez, P., Nocerino, E., Menna, F., Minto, S., Remondino, F., 2015. 3D Surveying & Modeling of Underground Passages in WWI fortification. In: The International Archives of the Photogrammetry, Remote Sensing and Spatial Information Sciences, Vol. XL-5/W4, pp.17-24.
Soprintendenza Archeologica di Napoli e Caserta, La grotta di Seiano e il Parco Archeologico del Pausilypon, Electa Napoli, 1999.
von Schwerin, J., Richards-Rissetto, H., Remondino, F., Agugiaro, G., Girardi, G., 2013. The MayaArch3D project: A 3D WebGIS for analyzing ancient architecture and landscapes. Literary and Linguistic Computing, doi: 10.1093/llc/fqt059
Taylor-Helms, L., Kvapil, L., Fillwalk, J., Frischer, B., 2013. Report on Computer Application to Archaeology. “Investigating the Effectiveness of Problem-Based Learning in 3D Worlds. A preliminary Report on the Hadrian’s Villa Project”.
Varriale, I., Posillipo, storia e mito, Valtrend Editore, 2011.
Viggiani, D., Posillipo Romana, Robert Gunther, Electa Napoli, 1993.
Zlot, R., Bosse, M., 2014. Report on the International Conference on Field and Service Robotics. “Efficient Large-Scale 3D Mobile Mapping and Surface Reconstruction of Underground Mines.”
Zlot, R., Bosse, M., 2014. Three-dimensional mobile mapping of caves. Journal of Cave and Karst Studies, v. 76, no. 3, p. 191– 206.
Zlot, R., Bosse, M., Greenop, K., Jarzab, Z., Juckes, E., Robert, J., 2013. Efficiently Capturing Large, Complex Cultural Heritage Sites with a Handheld 3D Mobile Laser Mapping System. In: Journal of Cultural Heritage.