GEOSPATIAL ANALYSIS OF NEAR-SURFACE SOIL MOISTURE
TIME SERIES DATA OVER INDIAN REGION
P. Berwal a, C. S. Murthy b, *, P.V. Raju b, M. V. R. Sesha Sai b,
a Haryana Space Application Centre (HARSAC), Hisar, Haryana -125004, India - [email protected] b National Remote Sensing Centre, Hyderabad - 500625, India - [email protected]
bNational Remote Sensing Centre, Hyderabad - 500625, India – [email protected]
b National Remote Sensing Centre, Hyderabad - 500625, India - [email protected]
Commission VII, WG VII/6
KEY WORDS: Geographic Information System (GIS) , Soil Moisture, Active and passive microwave remote sensing, Drought, Rainfall, Long term trend
ABSTRACT:
The present study has developed the time series database surface soil moisture over India, for June, July and August months for the period of 20 years from 1991 to 2010, using data products generated under Climate Change Initiative Programme of European Space Agency. These three months represent the crop sowing period in the prime cropping season in the country and the soil moisture data during this period is highly useful to detect the drought conditions and assess the drought impact. The time series soil moisture data which is in 0.25 degree spatial resolution was analyzed to generate different indicators. Rainfall data of same spatial resolution for the same period, generated by India Meteorological Department was also procured and analyzed. Geospatial analysis of soil moisture and rainfall derived indicators was carried out to study (1) inter annual variability of soil moisture and rainfall, (2) soil moisture deviations from normal during prominent drought years, (3) soil moisture and rainfall correlations and (4) drought exposure based on soil moisture and rainfall variability. The study has successfully demonstrated the potential of these soil moisture time series data sets for generating regional drought surveillance information products, drought hazard mapping, drought exposure analysis and detection of drought sensitive areas in the crop planting period.
1. INTRODUCTION
1.1 Overview
Hydrological and agricultural applications of soil moisture data are numerous. Agricultural drought is the most important phenomena to be directly influenced by soil moisture. Soil moisture determines the partitioning of precipitation in to runoff, infiltration and surface storage. Soil moisture is also an important physical data set playing vital role in environmental and climate system related research. It plays a key role in hydrology and land surface processes.
Most generally, soil moisture is defined as the volume fraction of water held in the soil and is an important part of hydrological cycle. Surface soil moisture is the water that is in the upper 10 cm of soil, whereas root zone soil moisture is the water that is available to plants, which is generally considered to be in the upper 200 cm of soil. However, the actual concept of this variable is elusive because specialists from various disciplines perceive soil moisture differently. For example, a farmer's concept of soil moisture is different from that of a water resource manager or a weather forecaster. Soil moisture is regarded to be a key state variable of the global energy, water and carbon cycles and is such of crosscutting importance for a wide range of applications, from climate monitoring and ecological applications to the quantification of bio-geophysical fluxes.
* Corresponding author
Soil moisture is a source of water for evapotranspiration over the continents, and is involved in both the water and the energy cycles. Soil moisture was recognised as an Essential Climate Variable (ECV) in 2010.
Soil moisture is arguably one of the most important parameters for the understanding of physical, chemical and biological land surface processes. Therefore, it is for many geoscientific applications essential to know how much water is stored in the soil, and how it varies in space and time.
1.3 Remote Sensing Techniques
New and improved methods of remote sensing have tremendously increased the understanding of land surface and its parameters. The mapping of soil moisture using the remotely sensed data has been done since a long time. The soil moisture is subject to rapidly change in time and shows significant variability with depth and space. Soil moisture mapping has been performed using optical, thermal infrared and microwave remote sensing. Microwave remote sensing provides soil moisture measurements in all weather conditions with a good physical basis. The penetration capability of microwave sensing is much higher than the visible and thermal remote sensing.
1.4 Blending of Passive and Active Microwave Data
combining both passive and active satellite based microwave sensors has the potential to offer improved estimates of surface soil moisture at global scale (Liu et al., 2011). The blended products have higher spatial and temporal resolutions. The enhancement of information by combining both passive and active microwave products helps in understanding land surface atmosphere interactions these regions (Liu et al., 2012). One of the approach used practically for combining soil moisture derive from active and passive microwave datasets is the blending approach. This technique has an added advantage of improved spatial and temporal soil moisture dataset as compared individually with passive or active soil moisture product.
With the availability of geospatial soil moisture products, a variety of applications like flood forecasting, drought monitoring and landslide susceptibility monitoring have been demonstrated. With increasing uncertainties in the rainfall affecting a large proportion of crop area, drought assessment in the early part of the cropping season remains to be challenging in India. Since physical indicators like soil moisture are more sensitive to agricultural drought than biological indicators like NDVI during the early part of the crop season, there is a need to evaluate the soil moisture datasets for near real-time agricultural drought surveillance for this part of the crop season.
1.5 Research Objective
The major aim of the research is to perform a detailed analysis of ECV soil moisture time series to bringout the soil moisture dynamics over Indian region through quantitative indicators. Geospatial analysis of soil moisture changes across space and time, understanding interrelations, detection of drought exposure patterns etc. constitute the scope of the study.
1.5.1 Objectives: 1. To build the database of soil moisture time series generated under ECV production system of ESA and to generate soil moisture index for spatio-temporal comparisons.
2. To study the changes in soil moisture in response to rainfall patterns.
3. To study the dynamics of soil moisture during crop seasons and to analyse the changes in soil moisture during drought and normal years.
4. To carry-out drought exposure analysis based on soil moisture and rainfall variations.
2. DATA SOURCES
2.1 Introduction
Microwave remote sensing measurements of bare soil surfaces are very sensitive to the water content in the surface layer due to the pronounced increase in the soil dielectric constant with increasing water content. This is the fundamental reason why any microwave technique, particularly in the low-frequency microwave region from 1 to 10 GHz, offers the opportunity to measure soil moisture in a relatively direct manner. For soil moisture studies the most important bands are: L-band (frequency f= 1-2 GHz, wavelength l = 30-15 cm), C-band (f = 4-8 GHz, l = 7.5-3.8 cm), and X-band (f =8-12 GHz, l = 3.8 – 2.5 cm).
The main objective of the soil moisture data production system is to produce the most complete and most consistent global Soil Moisture ECV Data Products based on the measurements (observations) made by imaging microwave instruments (sensors) flying on board of earth observation satellites. There are two principal types of remote sensing, corresponding to the following types of microwave instruments: (a) scatterometers and radars which measure the radar backscattering coefficient σ0 in physical units [dB] or [m2/m2], and (b) radiometers which measure the brightness temperature TB in physical unit [K]. The generation of the long-term (30+ years) soil moisture data set involves three step blending of active and passive soil moisture datasets.
3. STUDY AREA AND DATA USED
3.1 Study Area
The present research work has been carried out with all India coverage. India is situated north of the equator between 8°4' and 37°6' N latitude and 68°7' and 97°25' E longitude with the total area of 3,166,414 km2. India is geographically blessed with wide variety of climatic conditions ranging temperate and alpine in the Himalayan north to tropical in the south. The elevated regions like J & K or Himachal Pradesh receive sustained winter snowfall while other parts of the country being influenced by two seasons of rain southwest and north east. The south west monsoon season from June – September is considered the prime rainfall contributor, because 75% of annual rainfall is received during this short span of time.
India has diverse rainfall zones, crop growing environments and cropping pattern. The net cropped area is 140 m ha and about 60 percent of it is directly dependent on rainfall. Kharif is the principal crop season which corresponds to 4-5 months period starting from June. The country experiences localized drought in one part or other almost every year.
3.2 Soil Moisture Time Series Data
The ECV production system has three main components - (1) merging the original active microwave products (from 1991), (2) merging the original passive microwave products (from 1978) and (3) blending the two merged products. All the inputs are resampled to a common grid of 0.25 degree and scaled to the same dynamic range. Land surface model (GLDAS-Noah) estimates of soil moisture with global coverage have been used as reference to develop uniform dynamic range for different products.
3.3 Rainfall Data
Currently, these historical rainfall data are archived at the National Data Centre (NDC), India Meteorological Department (IMD), Pune. IMD’s efforts to make use of all the available quality rain gauge data over the country to prepare a high resolution daily rainfall dataset for various applications such as climate variability & climate change studies, validation of model rainfall at various scales, hydrological modelling, drought monitoring etc., development of a new daily gridded rainfall data set over India at a spatial resolution 0.25° X 0.25° for 110 years (1901-2010) have been discussed. The data set was prepared using the daily rainfall data from all the rain gauge stations over the country available in the IMD archive.
The International Soil Moisture Network (ISMN) is an international cooperation to establish and maintain a global in-situ soil moisture database. This database is an essential means of the geoscientific community for validating and improving global satellite observations and land surface models. The soil moisture product has been validated with in situ data from a ground station of International Soil Moisture Network (ISMN). The LPRM estimated soil moisture coincides quite well with the in-situ measurements and the correlation coefficient is 0.7909. In situ measurements are used to evaluate whether the temporal variations in the original six microwave soil moisture products are preserved in the final blended product.
4. METHODOLOGY
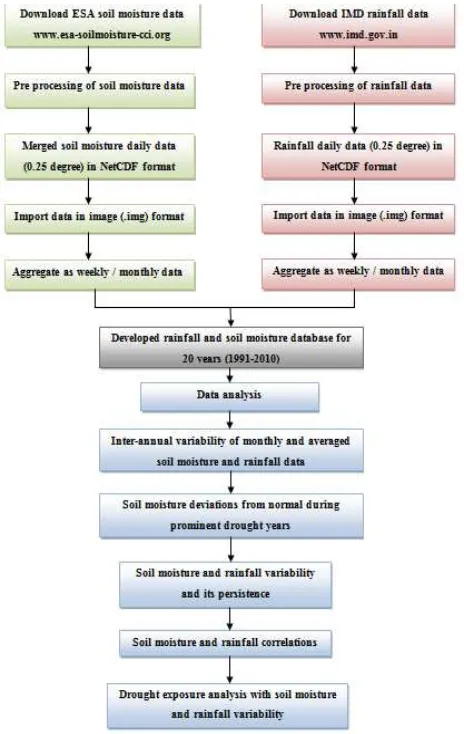
The present study has developed soil moisture database over India, for June, July and August months for period of 20 years 1991-2010, using ESA data products. Rainfall data of same spatial resolution i.e., 0.250 for the same period was also procured from IMD and analysed. Geospatial analysis of soil moisture and rainfall derived indicators was carried out to study spatio-temporal variability of the near surface soil moisture and drought occurrence. The methodology implied in this research work mainly focuses on spatio-temporal variability of the near surface soil moisture and drought occurrence analysis. There are five major components in the analysis – (1) inter annual variability of monthly and averaged soil moisture and rainfall data, (2) soil moisture deviations from normal during prominent drought years, (3) soil moisture and rainfall variability and its persistence during June and July, (4) soil moisture and rainfall correlations and (5) drought exposure analysis with soil moisture and rainfall variability. Figure 1 shows the flowchart depicting the methodology.
4.1 Data Acquisition
The data acquired is the soil moisture daily data for the time period January 1991 to December 2010 i.e., for a complete 20 year time span, from various sensors and sources. Soil moisture data in geospatial perspective is available from aircraft and satellite instruments involving passive and active microwave measurements. Scanning Multichannel Microwave Radiometer (SMRR 1978-1987), the Tropical Rainfall Measuring Mission (TRMM) Microwave Imager (TMI, since 1997) and Advanced Microwave Scanning Radiometer E for Earth Observing System (AMSR-E, 2002-2011) have successfully provided coarse resolution surface soil moisture products with global coverage.
4.2 Data Analysis
4.2.1 Coefficient of Variation: The coefficient of variation (CV) also known as “Relative Variability” equals the standard deviation divided by the mean. It can be expressed either as a fraction or a percent.
Coefficient of Variance (CV) =
Standard Deviation × 100
Mean
4.2.2 Correlation Coefficient: The correlation coefficient (r), called the linear correlation coefficient, measures the strength and the direction of a linear relationship between two variables.
∑[ � � − � ̅̅] �
�=
r =
√[(∑xi2 n
i=1
- nx ̅ ²) (∑ � − �̅
�
� =
²) ]
Where x = rainfall data
y = soil moisture data
n = number of pairs of data
̅ = 20 years mean of rainfall data
̅ = 20 years mean of soil moisture data
The value of r is such that -1 ≤ r ≤ +1. The + and – signs are used for positive correlations and negative linear correlations, respectively.
Figure 2: a) Global soil moisture data, and b) subset of data covering Indian region.
5. RESULTS AND DISCUSSION
The southwest summer monsoon, spreading from June to September, is a major period of rainfall in India as monsoonal torrents supply about 80% of India’s annual rainfall (Chang, 1967; Bagla, 2006). The monsoon reaches south India, generally by the end of May or first week of June, and progresses to northern parts by the end of June or first week of July. The withdrawal of the monsoon starts at the end of September. Rainfall during this season plays a vital role in economic development, disaster management and hydrological planning in the country. Time series rainfall data analysis of a region helps in better understanding its drought climatology. In addition to detection of changes in intensity, magnitude and duration of droughts, identification of frequently drought affected regions also plays an important role in drought management. Therefore, systematic understanding of drought climatology is indispensable for evolving efficient drought management strategies, particularly in tropical regions such as India.
5.1 Spatial and Temporal Variability of Soil Moisture
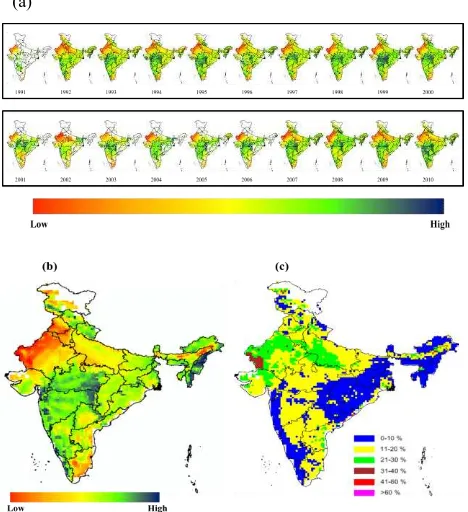
Monthly averaged soil moisture images for June and July from 1991 to 2010 i.e., for 20 years have been analysed to understand the spatio-temporal variations of surface soil moisture. In June (Fig. 3.a) years to year variability of soil moisture is quite significant. The 20-year mean soil moisture of June (Fig. 3.b) and its CV (Fig. 3.c), reveal interesting trends. In all the 20 years, soil moisture is low in the northern half of the country. Mean soil moisture is less with high CV in some of the states - Uttar Pradesh, East Rajasthan, Punjab, Haryana, Bihar, Gujarat and parts of Chhattisgarh and Jharkhand. Since the monsoon covers these regions only by the end of June, the soil moisture values tend to be on lower side in majority days of the month. East India shows higher soil moisture with lesser CV mainly because of higher rainfall incidence. The data gaps reduced the time series length and
affecting the reliability of mean and CV values in some parts of the country.
Figure 3: a) June month’s mean soil moisture images for 20 years, 1991-2000, b) 20-year mean soil moisture of June, and
c) Inter-annual variability of soil moisture of June (Coefficient of Variation).
In July, soil moisture status has improved over many parts of the country in different years (Fig.4.a). Data gaps are evident in the pixels of northern states, reducing the number of years data is available. The 20-year mean soil moisture and CV of soil moisture show higher soil moisture level with less CV values over many parts of the country.
Figure 4: a) July month’s mean soil moisture images for 20 (a)
(b)
(a)
years, 1991-2000, b) 20-year mean soil moisture of July, and c) Inter-annual variability of soil moisture of July
(Coefficient of Variation).
Drought frequency maps were generated for June and July months separately based on the number of years with less than 90% of normal soil moisture. Normal soil moisture was generated from the mean of 20 years soil moisture of respective month. (Fig. 5). Only those pixels that have the data for all the 20 years have been considered. Most of the pixels show 1-3 years of drought frequency in June and July months during the 20-year period. The pixels with 4-6 years of drought constitute 32% in June and 25% in July. These pixels are located in the north and east parts of the country. Drought frequency in July is more reliable because of the complete monsoon coverage. In this month, pixels with higher frequency are about 25% of the total pixels and these are scattered all over the country, mostly in the drought vulnerable areas.
Figure 5:Drought frequency maps for June and July.
5.2 Persistency of Soil Moisture Variability
Inter annual variability of soil moisture expressed as CV, was classified in to five classes and month wise images of CV for June, July and August were generated. Changes in CV classes from to June to July and August months were mapped to study the drought persistency. High CV values in all the three months indicate persistent soil moisture reduction. The analysis has shown that soil moisture variability is not persistent over the three months of crop sowing period in majority pixels.
5.3 Rainfall Variability Analysis
Inter-annual variability of rainfall is very high in the month of June with sharp decrease subsequently in July and August months. Rainfall variability in July, the most critical period for crop sowing, follows a typical pattern with high variability in the western half of the country, representing drought prone areas. August variability also shows such typical pattern. The rainfall variability compares well with the drought prone areas map of Venkateswarlu et al. 2014.
June to July variability in the CV classes of rainfall was analysed to study the persistency of rainfall status. For example, there are four CV classes of rainfall in June i.e., (0-20%, 21-40%, 41-60% and >60%). The transformation of these four classes in to the four classes of July rainfall CV was analysed through agreement analysis.
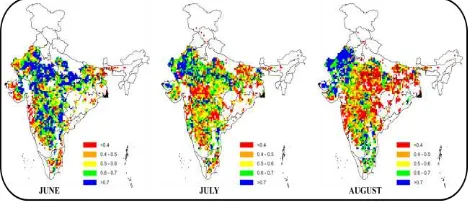
July to August transformation of CV classes of rainfall has also indicated the rainfall variability as shown in figure 6.
Figure 6: CV of rainfall in June, July and August months. (Higher CV could also be caused by data gaps in the time
series)
5.4 Correlation between Rainfall and Soil Moisture
Rainfall is a cause and its effect is on soil moisture. The linkage between cause (rainfall) and affect (soil moisture) examined in the section is useful for multiple purposes – drought, hydrology, environment etc. Drought occurrence patterns are directly derived from rainfall and soil moisture relations.
In this section, time series (1990-2010) images of monthly averaged soil moisture and rainfall over India were used to generate correlation images. Correlation was computed separately for June, July and August months. Since the data for all the pixels is not available uniformly for all the 20 years, those pixels that have atleast 10 years of soil moisture were considered for analysis. Thus, the length of time series ranges from 10-20 years for different pixels. The correlation images for June, July and August months are shown in figures.
During June, most of the pixels showed significant correlation between rainfall and soil moisture. Only 23 percent of pixels have less than 0.5 correlation. Higher correlation pixels are located in the western, central and southern parts of the country. Southern UP and Bihar also show good correlation. Large parts of AP, Telangana, Maharashtra and MP where the monsoon covers by June, the correlation between rainfall and soil moisture is high.
During July, the correlation is high in majority of pixels. The pattern is close to that of June month except in parts of eastern MP, where the correlation has decreased. Rajasthan shows typically higher correlation establishing its sensitivity to rainfall.
Figure 7: Correlation between soil moisture and rainfall.
vegetation cover, maintains higher correlation in August month also.
The June and July months represents typical crop sowing period in the country. High proportion of pixels exhibit significant correlation between rainfall and soil moisture. Irrigated areas – particularly in UP, MP, Bihar, Chhattisgarh, Telangana, AP show reduced correlation, because soil moisture is also determined by irrigation supplies. Rainfed areas in all states show good correlation. The correlation images of these two months shows typical drought occurrence patterns.
Correlation analysis reveals drought sensitive areas throughout the country. The correlation pattern compares well with the using rainfall and soil moisture variability. The inter-annual variability of rainfall and soil moisture, as represented by respective values of CV were combined using decision rules in Table 1. Since the dynamic range of soil moisture is less, its CV classes represent narrow intervals compared to the rainfall.
CV of Soil moisture
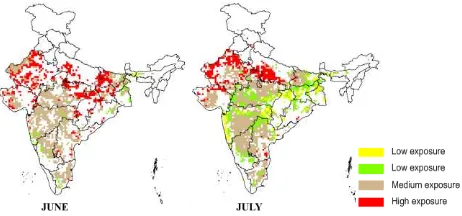
Pixels having at least 10 years of data were only involved in the study. The decision rules based on rainfall and soil moisture CV classes are linear in nature. High variability of soil moisture and rainfall lead to higher exposure compared to the low variability situation. The resulting exposure maps of June and July as shown in Fig. 8.
Figure 8: Exposure maps having at least 10 years of data.
In June, drought exposure is moderate to high in most of the pixels involved in the analysis. High exposure areas are located in parts of Rajasthan, Uttar Pradesh, Madhya Pradesh and Bihar, due to non-arrival of monsoon in these regions.
In July, large numbers of pixels continue to show medium level of exposure. Improvement to lower exposure is evident in high rainfall areas – such as west coast, parts of Maharashtra, Chhattisgarh, Odisha, West Bengal, Bihar etc. 70% of pixels exhibit medium to high exposure in the month.
5.6 Discussion
Spatial and temporal variability of soil moisture during June, July and August months indicated the progression of soil moisture through the crop season. Soil moisture changes in the country showed general agreement with monsoon progression and rainfall status. Prominent drought years and normal years exhibited considerable differences in the soil moisture status and its variability. The 20-year mean soil moisture in June and July brought out spatial differences very effectively. Soil moisture was significantly less than normal (deviations less than -20%) in most of the areas in drought affected years, whereas in normal years, most of the pixels showed close to normal soil moisture. July is a critical month for crop sowing activity and the soil moisture show reduced levels in all the drought years. Drought frequency analysis was performed by counting the number of years with less than normal moisture in June and July months. Parts of Rajasthan, MP, Maharashtra, Karnataka and AP showed higher frequency. Rainfall variability in July, the most critical period for crop sowing, follows a typical pattern with high variability in the western half of the country, representing drought prone areas.
The linkage between rainfall (cause) and soil moisture (affect) was examined through correlation analysis. Correlation images between monthly averaged soil moisture and rainfall, for all the pixels having a minimum of 10 years of data was generated, for June, July and August months separately. During June and July correlation between rainfall and soil moisture was significant in majority pixels. Prominent rainfed areas are showing higher correlation values. A lower correlation in August was due to increased vegetation cover thereby decreasing the reliability of soil moisture data. Correlation analysis reveals drought sensitive areas throughout the country which are comparable to the drought vulnerability map of India generated by Murthy et al. 2010.
Drought exposure analysis was performed by using rainfall and soil moisture variability. The inter-annual variability of rainfall and soil moisture, as represented by respective values of CV were combined using the decision rules. The drought exposure maps of June and July have effectively captured the changes in drought response and the rainfed areas of the country have been found to be with higher exposure. From June to July, drought exposure has reduced significantly largely due to complete coverage of south west monsoon over the entire country. Areas with persistent exposure in the two months are mostly located in west Rajasthan, parts of MP, Maharashtra, Karnataka and Andhra Pradesh and these areas represent hotspots for drought. The drought exposure map of the current study and the climatic classification map generated by Raju et al. (2013) and the drought prone area map of Venkateswarlu et al. (2013), based on precipitation and potential evapotranspiration have some interesting commonality and class agreements.
6.1 Conclusion
In the present study geospatial analysis of soil moisture and rainfall derived indicators was carried out to study the spatio-temporal variability and drought occurrence patterns over Indian regions for period of 20 years 1991-2010, using ESA data products.
The study has successfully demonstrated the potential of ESA surface soil moisture time series data sets for undertaking a variety of drought studies – regional drought surveillance, drought hazard analysis, detection of sensitive areas in the crop sowing period etc. The information products resulting from such studies are very useful to support drought management planning at regional scales, climate change/variability assessments etc.
6.2 Recommendations
1. Integration of time series soil moisture with land use/cover data, crop layers and weather layers brings more effective information products for multiple uses.
2. Downscaling of soil moisture products to moderate resolutions would enhance the end-use.
3. One of the highlights for future analysis is to reduce the effect of radio frequency interference (RFI) in the soil moisture retrieval which is observed in Indian subcontinent.
4. Filling the gaps in the satellite based soil moisture products is one of the challenges to build longer time series data.
5. More dense ground soil moisture data points are re-commended for satellite data validation and improvements.
6. Higher accuracy and improved soil moisture products are expected from the future missions.
ACKNOWLEDGEMENT
Sincere thanks are due to Dr. V.K. Dadhwal, Director, National Remote Sensing Centre (NRSC) for his constant encouragement. Guidance and suggestions provided by Dr. P.G. Diwakar, Deputy Director (Remote Sensing Applications), NRSC are acknowledged.
REFERENCES
Bagla P. 2006. Controversial rivers project aims to turn India’s fierce monsoon into a friend. Science, 313, 1036–1037.
Chakraborty, A., Sesha Sai, M. V. R., Murthy, C. S., Roy, P. S., and Behera, G., 2012. Assessment of area favourable for crop sowing using AMSR-E derived Soil Moisture Index. Int. J. Appl. Earth Observ, Geoinformation, 18, 537-547.
Chang JH. 1967. The Indian summer monsoon. Geographical Review 57, 373–396.
Krishnamurthy V., and Shukla J., 2000. Intra-seasonal and Inter-annual variability of rainfall over India. J. Climate, 13, 4366-4377.
Krishnamurthy V., and Shukla J., 2007. Intra-seasonal and Seasonally Persisting Patterns of Indian Monsoon Rainfall. J. Climate, pp. 20, 3–20.
Liu, Y.Y., Dorigo, W.A., Parinussa, R.M., de Jeu, R.A.M., Wagner, W., McCabe, M.F., Evans, J.P., van Dijk, A.I.J.M., 2012. Trend-preserving blending of passive and active microwave soil moisture retrievals. Remote Sensing of Environment, 123, pp. 280–297.
Liu, Y.Y., Parinussa, R.M., Dorigo, W.A., De Jeu, R.A.M., Wagner, W., van Dijk, A.I.J.M., McCabe, M.F., Evans, J.P., 2011. Developing an improved soil moisture dataset by blending passive and active microwave satellite-based retrievals. Hydrology and Earth System Sciences, 15, pp. 425– 436.
McCabe Liu, Y.Y., Parinussa, R.M., Dorigo, W.A., De Jeu, R.A.M., Wagner, W., van Dijk, A.I.J.M., , M.F., Evans, J.P., 2011. Developing an improved soil moisture dataset by blending passive and active microwave satellite-based retrievals. Hydrology and Earth System Sciences, 15, pp. 425– 436.
Murthy, C.S., SeshaSai, M.V.R., Prabir K. D., Naresh Kumar, M., Abhishek, C., & Dwivedi, R.S., 2010. Assessing agricultural drought vulnerability using time series rainfall and NDVI. NNRMS Bulletin, pp. 63–72.
Rajeevan M., Bhate J., Kale J. D. and Lal B., 2006. High resolution daily gridded rainfall data for the Indian region: Analysis of break and active monsoon spells. Current Science, 91, 3, pp. 296–306.
Rajeevan, M. and Bhate, J., 2009. A high resolution daily gridded rainfall data set for mesoscale meteorological studies. Current Science, 96, 4, pp. 558 – 562.
Rajeevan, M., Bhate J. and Jaswal A. K., 2008. Correction to ‘‘Analysis of variability and trends of extreme rainfall events over India using 104 years of gridded daily rainfall data. Geophys. Res. Lett. , 35, L23701.