A NEW PROMPT FOR BUILDING EXTRACTION IN HIGH RESOLUTION REMOTELY
SENSED IMAGERY
A.H. Souri a, *, A. Mohammadi b, M.A. Sharifi a
a Department of Surveying and Geomatics Engineering, College of Engineering, University of Tehran, Tehran, Iran,
P.O. Box 11365-4563- (souri_rs,sharifi)@ut.ac.ir
b Department of RS & GIS, College Geography, University of Tehran, Tehran, Iran, P.O. Box 14155-6465-
KEY WORDS: Building extraction, SRM segmentation, Shape-factors, Clustering, Remote sensing.
ABSTRACT:
Remote sensing technology has proved a magnificent role in urban development. High resolution remotely sensed imagery provides remote sensing mapping, GIS data acquisition and automatic updates, and also supports for extraction train features such as building. In this work, a new approach for building extraction in colored high resolution remotely sensed imagery is proposed. The approach includes Statistical Region Merging (SRM) segmentation, boundary tracing and clustering based on new shape-factors. After performing SRM, the boundary tracing algorithm is carried out. Moore neighbour contour tracing algorithm is used for this purpose. New shape factors are proposed based on geometry of buildings and other terrain features. The correlation of shape factors between buildings and road features is significantly low. The shape factors are based on circularity, elongation and compactness. Afterwards K-means classifier is utilized in order to discriminate between buildings and other objects. In this step squared Euclidean distance has been opted. Two clusters have been set for separating buildings from roads and complex features. In order to evaluate the capability of this method, two images of Worldview2 sensor has been used. The fine result demonstrates the proficiency of shape factors and remarkable and satisfactory performance of the new prompt.
* Corresponding author.
1. INTRODUCTION
Detecting buildings in aerial and satellite images (A. Katartzis and H. Sahli, 2008) (F. Lafarge et al., 2009) (B. Sirmacek and C. Unsalan, 2008) is a key issue in several remote sensing applications, among others in cartography, GIS data management and updating, disaster recovery or illegal built-up region detection. In lack of stereo based height information (F. Lafarge et al., 2009), building identification becomes a hard monocular object recognition task.
Building extraction tasks may differ depending on the use of geometrical representation with rectangular models (Weidner and Frostner, 1995), use of multiple images (Ballard and Zisserman, 2000), and polyhedral shapes (Scholtze et al., 2002), the use of lines, points and regions to describe building outlines (Fisher et al., 1997). The existing automated building extraction techniques are still performing at elementary level caused by image variation in terms of type, scale, and required level of detail (Wang and Tseng, 2003). Numerous methods in the bibliography address building extraction at a single time. It is common to use multiview inputs (S. Noronha and R. Nevatia, 2001), (F. Bignone et al., 1998) to exploit 3-D information in building modeling. Detection in densely populated areas can be
efficient by working on stereo- or lidar-based Digital Elevation/Surface Models (DEM/DSM), where the silhouettes of the building footprints can be separated from the ground planes by the estimated height data (M. Ortner et al., 2008), (N. Champion, 2008), (K. Karantzalos and N.
Paragios, 2010). Other benefits are provided by multiple sensor inputs such as fusion of aerial images with color infrared (CIR) (F. Rottensteiner et al., 2007), or laser data (J. Jaw and C. Cheng, 2010).
The aim of this paper is to improve the traditional building extraction methods in high resolution images based on segmentation, boundary tracing algorithm and clustering effective shape-factors. Afterwards tracing boundary have carried on regions by Moore algorithm then tiny objects have been eliminated by adaptive thresholding before clustering and holes have been filled by flood-fill method; finally, the relevant shape-factors are introduced where the correlation between roads and complex buildings is significantly decreased.
2. METHODOLOGY AND USED DATA
Studies mainly focused on edge detection method and characteristics of edges; however we emphasize on extraction and clustering of regions that are more discernable in high resolution RS images.
2.1. Pre-processing
Image enhancement is among the simplest and most appealing areas of digital image processing. Basically, the idea behind enhancement techniques is to bring out detail that is obscured, or simply to highlight certain features of interest in an image. In first step, we applied histogram equalization on RGB images. This procedure can done by transforming RGB to HSV color and then, exerting histogram equalization merely on V parameter. Afterwards, the enhanced HSV can be transformed
International Archives of the Photogrammetry, Remote Sensing and Spatial Information Sciences, Volume XL-1/W3, 2013 SMPR 2013, 5 – 8 October 2013, Tehran, Iran
back to RGB domain. This step has been done in order to make visions of building objects differ from background.
2.2. Statistical Region Merging
In this paper we use statistical region merging technique for image segmentation proposed by (Nock, R. and Nielsen, 2004)]. Statistical region merging is a linear-time fast and simple region growing segmentation algorithm based on an adaptive statistical threshold merging predicate on color channels that does not require maintaining dynamically the region adjacency graph.
Let I be the input color image with
l
pixels, each containingthe Red, Green and Blue values, each of the three belonging to the set {1, 2, 3,…g}. Let l* denote the perfect scene (theoretical image) of I. In I*, the true or statistical regions represent theoretical objects sharing a common homogeneity property: Inside any statistical region and given any color channel { , , }R G B the statistical pixels have the same expectation for this color channel. The expectations of adjacent statistical regions are different for at least one color channel{ , , }R G B . The image I is obtained from I* by sampling each statistical pixel for observed RGB values. In each pixel of I*, each color channel is replaced by a set of exactly Q independent random variables, taking positive values on domains bounded by g/Q, such that any possible sum of outcomes of these Q random variables belongs to {1, 2, 3,…g}. The parameter Q allows to quantify the statistical complexity of I*, the generality of the model and the statistical hardness of the task. The segmentation scheme is basically depends on merging predicate and an order to test region merging. The merging predicate for the RGB setting is given by:
, ,
, '
( ')where,
R
a enotes to observed average for color channel a in the region R and b(R) is given by:couples of adjacent pixels. Let SI be the set of these couples and
f(p,p’) be the real valued function, with p and p’ pixels of I purpose. Moore Neighbourhood of a pixel is the set of 8 pixels which share a vertex or an edge with that pixel. The basic idea is: When the current pixel p is white, the Moore neighbourhood of p is examined in clockwise direction starting with the pixel from which p was entered and advancing pixel by pixel until a
new white pixel is encountered. The algorithm terminates when the start pixel is visited for second time. The main weakness of Moore Neighbour tracing lies in the choice of stopping criteria i.e. visiting the start pixel for second time. If the algorithm depends on this criterion all the time it fails to trace contour of
large family of patterns. So mostly it uses Jacob’s stopping
criterion.
2.4. Clustering based on shape-factor
Until this step, we retrieved many regions that merely few of them belong to buildings. To extract the buildings regions we shall define features that exclusively discriminate between buildings regions and others. The less correlation become between features of buildings and other terrain objects, the more precise the clustering will be; therefore buildings will readily be separated.
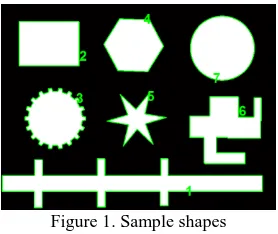
Figure 1 represents some sample shapes to introduce shape-factors more comprehensively.
Figure 1. Sample shapes They are four shape-factors proposed in this research:
R factor: The first feature based on circularity is R. we calculated a shape centroid, and measured all the Euclidean distances from the centroid to each boundary pixel. With this set of distances, the media (μ) and the variance (σ2) were calculated. These statistical parameters are used on a ratio that calculates the circularity, R, of a shape. This circularity measure is given by:
2
R
(4)The feature is evaluated for the shapes presented in table1:
Region # 1 2 3 4 5 6 7 border. This factor is given by:
1 evaluated for the shapes presented in table2:
Region # 1 2 3 4 5 6 7 H factor 24.44 2.04 1.08 1.19 2.3 3.78 1.06
Table2. H values for samples
International Archives of the Photogrammetry, Remote Sensing and Spatial Information Sciences, Volume XL-1/W3, 2013 SMPR 2013, 5 – 8 October 2013, Tehran, Iran
Q-factor: Q shape factor is another compactness value of a shape. This factor is defined by a ratio between the area of region and the square of maximum farthest distance from border.
Then Q factor is defined by:
2 1 2
[max( ,
,
,
N)]
A
H
x x
x
(6)where xi is the value generated by the discrete distance transform, N is the number of region pixels and A is area of corresponding region.
Q feature is evaluated for the shapes presented in table3:
Region# 1 2 3 4 5 6 7 Q factor 58.31 5.34 3.48 3.
5 8.
8
11.8 3.1
Table3. Q values for samples
C-factor: The last feature is the old ratio of shape compactness which is formulated by:
2
4
P
C
A
(7)where A is the shape area and P is the shape perimeter. C feature is evaluated for the shapes presented in table4:
Region # 1 2 3 4 5 6 7 C factor 8.74 1.28 2.47 1.
2 6.
5
3.78 1.0
Table4. C values for samples
2.5. K-means clustering
In this important step we shall use of an unsupervised clustering method in order to classify the regions into building and other regions based on mentioned shape-factors. We make use of K-means clustering in order to achieve this goal. K-K-means uses an iterative algorithm that minimizes the sum of distances from each object to its cluster centroid, over all clusters. This algorithm moves objects between clusters until the sum cannot be decreased further. The result is a set of clusters that are as compact and well-separated as possible. K-means computes centroid clusters differently for the different supported distance measures. In this step squared Euclidean distance has been opted. Two clusters have been set for separating buildings from other terrain features. Like many other types of numerical minimizations, the solution that k-means reaches often depends on the starting points. It is possible for k-means to reach a local minimum, where reassigning any one point to a new cluster would increase the total sum of point-to-centroid distances, we set 10 times to repeat the clustering, each with a new set of initial cluster centroid positions and them it returns the solution with the lowest value for sum of distances.
2.6. Used data
In order to evaluate the capability of this method, RGB images of Worldview2 sensor has been tested. WorldView-2 provides 46 cm resolution images in panchromatic mode and 1.84m for other eight bands.
3. EXPERIMENT
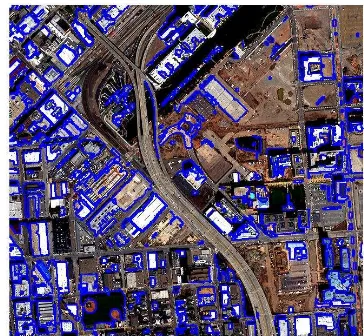
Two images have been exploited in order to evaluate the capability of the approach. Figure1 and 2 show example detection results. It can be seen that many buildings have been detected.
By using K-means for clustering regions into buildings and others, the result showed that shape-factors could even discriminate complex or elongated road features from the buildings. However, some building boundaries were not delineated correctly. When the overall detections were considered, the following source of error was identified. Most of the error was caused by the over-merging of regions in different building appearances. Accordingly the SRM method should be optimized in order to have better result in field of building extraction.
Figure 2. The resultant building detection in a WorldView2 image.
Figure 3. The resultant building detection in a WorldView2 image.
4. CONCLUSION
This study has proposed a method of building extraction on high resolution image. We have focused on introducing and creating new shape factors that are the most important factors in detection of buildings. The fine result demonstrates the proficiency of shape factors and the method. As for future work, we will develop this methodology for urban areas by adding more features (e.g. DEM, texture) in order to extract buildings as well as roads. The merging predicate in SRM should also be optimized for remote sensing imageries in order to overcome with over-merging phenomenon.
International Archives of the Photogrammetry, Remote Sensing and Spatial Information Sciences, Volume XL-1/W3, 2013 SMPR 2013, 5 – 8 October 2013, Tehran, Iran
REFERENCES
A. Katartzis and H. Sahli. 2008. A stochastic framework for the
identification of building rooftops using a single remote sensing
image. IEEE Trans. GRS, 46(1), pp.259–271.
B. Sirmac¸ek and C. Unsalan. 2008. Building detection from aerial imagery using invariant color features and shadow
information,” in Int. Symp. On Computer and Information Sciences (ISCIS), Istanbul, Turkey.
B. Sirmacek and C. Unsalan. 2008. Building detection from aerial imagery using invariant color features and shadow information. In ISCIS, Istanbul, Turkey.
Ballard, C. and Zisserman, A. 2000. A Plane-sweep Strategy for the 3D Reconstruction of Buildings from Multiple Images. IASPRS, Vol. XXXIII, Part B2, pp. 56-62.
F. Bignone, O. Henricsson, P. Fua, and M. Stricker. 1996. Automatic extraction of generic house roofs from high resolution aerial imagery. In European Conf. on Computer Vision, Cambridge, UK. pp. 83–96.
F. Lafarge, X. Descombes, J. Zerubia, and M. Pierrot Deseilligny. 2009. Structural approach for building reconstruction from a single DSM. IEEE Trans. PAMI, 32(1), pp.135–147.
F. Rottensteiner, J. Trinder, S. Clode, and K. Kubik. 2007. Building detection by fusion of airborne laser scanner data and multi-spectral images: Performance evaluation and sensitivity
analysis,” ISPRS Journal for Photogrammetry and Remote Sensing, vol. 62, no. 2, pp. 135–149.
Fisher, A., Kolbe, T. H. and Lang, F. 1997. Integration of 2D and 3D Reasoning for Building Reconstruction Using a Generic Hierarchical Model, In Proceedings of the Workshop on Semantic Modeling for the Acquisition of Topographic Information from Images and Maps SMATI'97, pp. 159-180.
J. Jaw and C. Cheng. 2008. Building roof reconstruction by
fusing laser range data and aerial images,” in Proc. ISPRS
Congress, Beijing, China, pp. 707–712.
K. Karantzalos and N. Paragios. 2010. Large-scale building reconstruction through information fusion and 3D priors. IEEE Trans. Geosc. Remote Sens., vol. 48, no. 5, pp. 2283–2296.
M. Ortner, X. Descombes, and J. Zerubia. 2008. A marked point process of rectangles and segments for automatic analysis of digital elevation models. IEEE Trans. Pattern Anal. Mach. Intell., vol. 30, no. 1, pp. 105–119.
N. Champion. 2007. 2D building change detection from high resolution aerial images and correlation digital surface models. In International Archives of Photogrammetry, Remote Sensing and Spatial Information Sciences, pp. 197–202.
Nock, R. and Nielsen, F. 2004. Statistical Region Merging. IEEE Trans. Pattern Anal. Machine Intelligence, 26(11). pp. 1452-1458.
S. Noronha and R. Nevatia. 2001. Detection and modeling of buildings from multiple aerial images. IEEE Trans. Pattern Anal. Mach. Intell., vol. 23, no. 5, pp. 501–518.
Scholze S., T., Moons, T. and Gool, V. 2002. A Probabilistic Approach to Roof Extraction and Reconstruction. IASPRS, Commission III, pp. 231-237.
Wang, S. and Tseng, Y.H. 2003. Semi-automated Building Extraction Based on CSG Model-Image Fitting. Photogrammetry Engineering & Remote Sensing Vol. 69, No. 2: pp. 171-180.
Weidner, U. and Forstner, W. 1995. Towards Automatic Building Extraction from High Resolution Digital Elevation Models. International Society of Photogrammetry and Remote Sensing, Vol. 50 No. 4, pp 38-49.
International Archives of the Photogrammetry, Remote Sensing and Spatial Information Sciences, Volume XL-1/W3, 2013 SMPR 2013, 5 – 8 October 2013, Tehran, Iran