KEY WORDS:Urban, high resolution, SAR, persistent scatterer, TerraSAR-X, simulation
ABSTRACT:
Thanks to the high resolution of modern SAR satellites many persistent scatterers (PS) appear at single buildings, approximately half of them representing building facades. These groups of points often show regular patterns in the SAR images that can be related to repeating structure elements on the facades. Hence, individual buildings can now be monitored over time, either based on amplitude (for change detection) and phase information (using interferometric methods). However, patterns of point signatures are often disrupted or disappear when the imaging geometry is slightly changed. The investigation at hand provides a detailed analysis of PS patterns based on reference data obtained from a photogrammetric survey. The processing of the optical images allows to create a detailed 3D model of the respective facade, which represents the geometrical object information for SAR simulation. From the simulation results the appearance of the point patterns of natural PS in high resolution SAR data can be better understood. The approach and findings for a case study in Munich is described in detail in this paper.
1 MANUSCRIPT
1.1 Introduction
The benefit of meter resolution SAR data of urban areas for Per-sistent Scatterer Interferometry (PSI) (Ferretti et al., 2001), (Adam et al., 2004), (Hooper, 2007) already has been demonstrated in the past years (Adam et al., 2008), (Gernhardt et al., 2010), (Gern-hardt and Bamler, 2012). Due to the high resolution of up to approximately one meter and the side looking geometry of the SAR sensors, many persistent scatterers (PS) appear at building facades. These signatures very often show regular patterns be-cause of repeating structures at the facade of modern buildings, like windows or balconies with metal or concrete borders. How-ever, the analysis of PSI results from different orbital positions has revealed disappearing or disrupted PS patterns for specific urban scenes.
The origin of the point signatures and changes within the PS patterns due to varying acquisition geometries can only be inter-preted and determined precisely by SAR simulation. To this end, 3D models of the buildings are required that include sufficient structural details. For the analysis at hand, a building facade is selected based on the appearance of unexpected phenomena - in the image data or in the PSI results - and is recorded by a dig-ital photogrammetric camera. The goal of this procedure is the derivation of geometric object information (3D coordinates) of the facade. This data is used in a subsequent step for generating a detailed 3D model representing the geometry of facade structures such as balconies or window corners as well as the facade topol-ogy (structure regularities).
The digital images are first evaluated in a photogrammetric soft-ware environment (ERDAS imagine) wherein several coordinates of distinct facade features are extracted. Thereafter, this data and the additional measurements are used for creating a 3D model of each facade. In this regard, the focus is set on the detailed mod-eling of individual parts which regularly cover the facades. Af-terward, the 3D models are imported and simulated in RaySAR, a SAR simulator developed at TUM (Auer et al., 2010). This software based on ray tracing techniques is capable of 3D SAR
simulation with focus on the geometric correctness of simulated images and signal coordinates. The results include the 3D co-ordinates of signal phase centers (azimuth, range, elevation) and simulated images where different reflection levels are separable (single, double, triple bounce, etc.). Finally, the comparison of the simulated image with the real SAR image reveals the reason for unexpected phenomena within the PS patterns. In this context, the interpretation is further supported by linking the simulated 3D phase centers with the facade geometry.
The paper at hand is divided into two main sections. The first sec-tion in the following provides informasec-tion on the photogrammet-ric survey, on the 3D modeling and on the simulation procedure, whereas the second one deals with the analysis of the simulation results in comparison to PS on real SAR image data.
1.2 3D Facade Model Generation
1.2.1 Data Acquisition: The test site was selected based on the fulfillment of several prerequisites. The facade should include repeating structural elements in order to simplify the photogram-metric assessment and 3D modeling procedure. In this case one element can be modeled in detail and can be repetitively copied according to the respective position of recurrence measured from the images. In addition, a pattern of signatures should be present at the facade location in the SAR data and PS results, respectively, that disrupt/disappear with varying incidence angles. From recent studies PSI results of two descending tracks are available that are suitable for this investigation. The SAR data was acquired by the TerraSAR-X satellite in high resolution spotlight mode, from orbit 78, beam 19, and from orbit 2, beam 50, with (mid scene) incidence angles of 25.2◦and 39.4◦, respectively. The
Y
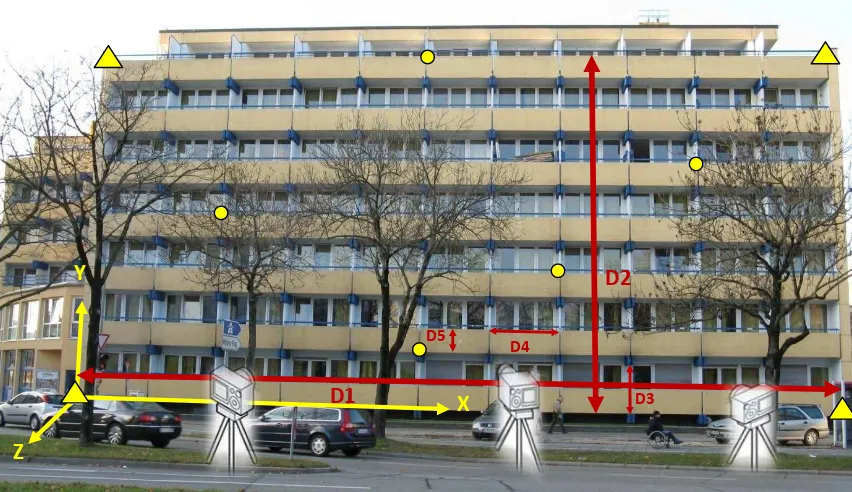
Figure 1: overview image of the facade with coordinate system, measured distances, control points (triangles: full CP, circles: height CP) and camera directions (schematically). Additional measurements: total length of facade (D1), total height of facade (D2), distance between two balcony carriers (D3), width of balcony parapet wall (D4) and height of balcony parapet wall (D5).
was defined based on the assumption that the facade can be fit-ted to a main plane and the building primitives are rectangular to each other. Control points (CPs) are necessary for referencing the images (determination of the exterior orientation) within this sys-tem. In total 4 full control points (x, y, and z coordinate is given) and 5 height control points (only z coordinate is given) have been determined by distance measurements with a laser range finder (Leica DISTO). Figure 1 shows an overview image of the facade with the local coordinate system, the distance measurements, and the control points. Furthermore, some small scale elements (like the width and depth of the metal balcony railing) are measured with a yard stick as they cannot be recorded during the pho-togrammetric assessment due to expected imprecision.
The images were taken with a NIKON D3 Camera which has been calibrated before. In order to avoid occlusions by cars and pedestrians, the images were shot from a stepladder about 3 m above ground level. Two types of images have been acquired:
• Stereoscopic overview images (distance to facade 30 m) served as overall information source for the identification of control points, distance measurements, and the locations of repeat-ing facade elements.
• Detail images (distance to facade about 12 m, baseline about 10 m). 3 images per station: perpendicular, tilted left, tilted right (about 50% overlap)
1.2.2 Photogrammetric Assessment: The photogrammetric processing comprised two steps in order to extract all necessary information for the 3D modeling.
Step 1: set up of a bundle block of the facade with a manual mea-surement of control and tie points (70 in total) within all relevant images (minimum 3 rays per point). The bundle block adjust-ment supplies the exterior orientation parameters of each image and the three dimensional coordinates of the tie points. These points served as anchor points for fitting the facade elements (cf. step 2). Table 1 shows the results of the bundle block adjustment.
The mean residuals at the control points are between 1.0 cm to 2.6 cm.
Step 2: the perpendicular images served as stereoscopic models for stereo restitution with the software Stereo Analyst of ERDAS imagine. Within these stereo models 3D coordinates of all rel-evant features have been recorded and stored as 3D shape files. The accuracy (root mean square error, rsme) of the object points is below 3 cm in all directions (see Table 1). During data ac-quisition advantage was taken from the fact, that facade elements are repeating in a regular way. The coordinates of these elements have been recorded once including all relevant details. All (as-sumed) identical facade elements are created during the modeling by cloning this template at the respective positions. The resulting model is exported in DXF format for the adjacent 3D modeling procedure.
Table 1: Results of the bundle block adjustment for the facade ”Marsstrasse”.
1.2.3 3D Modelling: The 3D model of the facade is created in Sketchup, a 3D modeling software of Trimble (formerly dis-tributed by Google). This software facilitates a straightforward construction of buildings with a manageable amount of tools and basic shapes. Especially the rectangular shapes and linear struc-tures at the building at hand accelerate the modeling procedure, as the software is designed for objects assembled from these ba-sic elements.
as-Figure 2: Facade mapping taking benefit of repeating features, fitted with anchor points.
sessment are imported into the software. The recorded points are used to model one facade element, special particular structural el-ements (e.g., the uppermost floor and roof) and the basic shape of the facade. During this step additional measurements of some ob-ject details are used that have been acquired on site, as mentioned in section 1.2.1. The structural details of the facade element are created using the basic tools of push/pull planes, parallel offset of polygons and the translation functionality. The completed el-ement is duplicated at all appropriate positions, whereas the an-chor points are used for precise positioning. Figure 2 shows the basic idea how a facade pattern is copied and fitted to another floor during modeling based on anchor points. Finally, all planes corresponding to glass panels are grouped in one layer in order to be able to differentiate metal/concrete from glass in the subse-quent simulation.
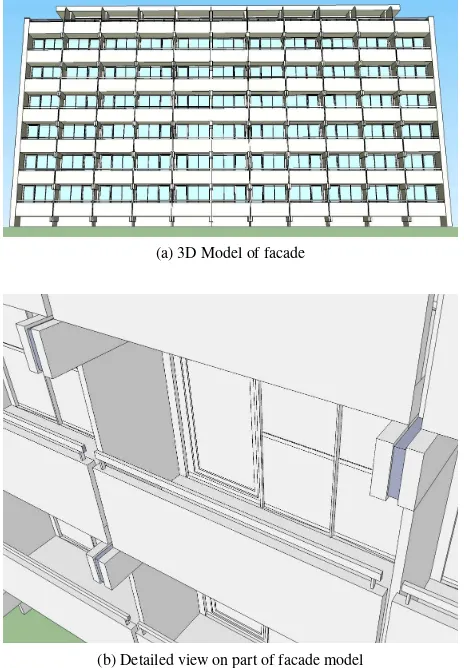
The result of the 3D modeling is shown in Figure 3. From the detailed view the incorporated details become evident, i.e., the concrete bearing sticking out (in perpendicular) of the facade, the balcony railing and the peculiarities of the balcony door and win-dows with intermediate elements. The orientation and location of the facade in the world coordinate system (WGS84) is derived from reference data provided by Landesamt f¨ur Vermessung und Geoinformation, Munich. The overall accuracy of the model can be assumed to be in the order of 2-3 cm in all 3 coordinate axes, due to the limited accuracy of the object points measured from the stereo restitution. However, this precision is sufficient for the in-vestigation at hand and within expectation for facade reconstruc-tions using the presented methodology. Further improvements can only be achieved either by different measurement techniques (more time consuming) or incorporating, e.g., a UAV with a cam-era in order to avoid oblique viewing especially at the upper parts of the facade.
1.2.4 SAR Simulation: The simulation part is conducted us-ing RaySAR (Auer et al., 2010) (Auer, 2011), a 3D SAR sim-ulator based on an enhancement of the open-source ray tracer Pov-RAY. The preface 3D relates to the simulation of radar sig-nals in azimuth, range, and elevation. The concept of RaySAR corresponds to the implicit assumption of standard SAR process-ing that the direct backscatterprocess-ing of signals is dominant (Born approximation). Accordingly, the simulation results can be used as a reference which is comparable with real SAR images (ap-pearance and position of signatures in azimuth-range plane) and results from interferometric algorithms (location of signal phase
(b) Detailed view on part of facade model
Figure 3: Overview on the 3D model of the facade located at Marsstrasse (top). Several constructional details are included that can be seen from a slight side view (bottom).
centers in 3D). The basic steps of the simulation procedure are detailed below.
As a first step, the building geometry, originally defined in CAD software, is transferred to the POV-Ray environment. Therein, the geometric and radiometric scene settings are adapted to SAR imaging. The geometric part considers the following parameters: signal incidence angle, building orientation with respect to the sensor’s line-of-sight, and pixel spacing. The signal incidence angle is assumed to be locally constant as the building facade is located in the far field of the radar antenna (flat wave front). Fol-lowing this assumption, the simulation of signals is directly con-ducted in three dimensions without raw data processing. When generating the SAR image, the pixel spacing in azimuth and range is adapted to the real SAR case, i.e., TerraSAR-X high resolution spotlight mode as shown in the case study below. The building geometry remains unchanged as the facade model is defined in absolute coordinates. Finally, the number of rays in the azimuth-elevation plane is defined, representing a discrete form of the sig-nal wave front. For the case study at hand, the density is adapted to the size of relevant corners, e.g., smaller than 5 cm.
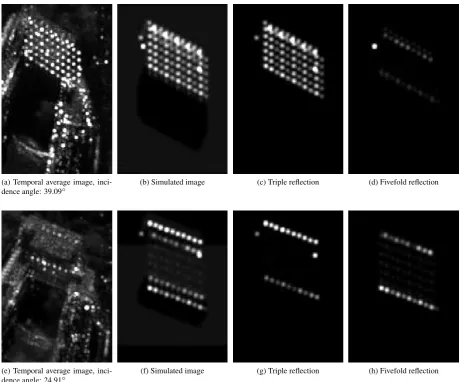
(a) Temporal average image,
inci-dence angle: 39.09◦
(b) Simulated image (c) Triple reflection (d) Fivefold reflection
(e) Temporal average image,
inci-dence angle: 24.91◦
(f) Simulated image (g) Triple reflection (h) Fivefold reflection
Figure 4: Comparison of TerraSAR-X temporal average images with simulated images and relevant image layers related to different reflection levels. Azimuth: left to right. Range: top-down.
That is, for the sake of simplicity signals entering the building are not expected to return. For creating the SAR image, signal con-tributions are summed coherently within the resolution cells. The image resolution is adapted to TerraSAR-X high resolution spot-light mode (impulse response imposed by hamming window for suppressing signal sidelobes).
Based on the geometric and radiometric parameters, the follow-ing simulation results are provided usfollow-ing RaySAR:
• Images in SAR geometry: Besides a reflectivity map mark-ing the distribution of signals in the azimuth-range plane, a SAR image is simulated for direct comparison with the real SAR image. Moreover, separate image layers are gen-erated for different reflection levels, e.g., triple and fivefold bounce.
• 3D coordinates of simulated signal phase centers: The dis-crete positions of signal contributions are written to a CAD file representing signal phase centers. Focusing on specu-lar reflections - marked by a flag in RaySAR during the ray tracing procedure - the positions of dominant signals can be analyzed in detail, for instance, by mapping them into the detailed facade model.
1.3 Facade Analysis
As introduced in Section 1.2.1, the simulation case study ”Mars-strasse” is related to the unexpected disappearing of PS candi-dates for different signal incidence angles. In order to explain this phenomenon, the simulation results are analyzed in detail in this section. In this context, simulated images are compared to the real SAR image (analysis in 2D). Moreover, the simulated phase centers are mapped into the facade model in order to check the correspondence between the localized signal and the facade structure.
1.3.1 Analysis in 2D: As the focus is on deterministic im-age components, it is reasonable to use temporal averim-age imim-ages of the given SAR data stacks for comparison, where the speckle effect is suppressed significantly without loss of resolution. Fig-ures 4e and 4a show the temporal average images of the urban scene ”Marsstrasse” for incidence angles of 24.91◦and 39.09◦
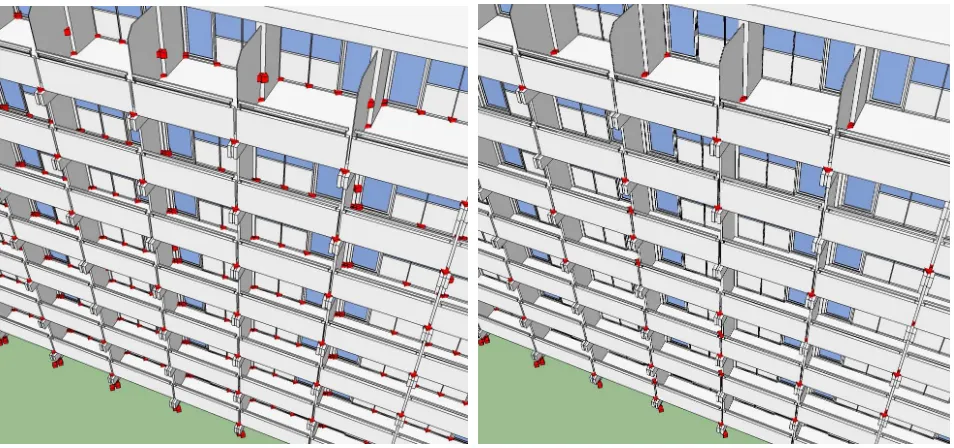
(a) Simulated phase centers for signal incidence angle of 39.09◦. Corner reflections appear in the balcony interior (dominant) and on the balcony railing (negligible).
(b) Simulated phase centers for signal incidence angle of 24.91◦. Corner
reflections in the balcony interior are disabled with except for the upper-most floor.
Figure 5: Simulated phase centers related to reflection level 3 marked in facade model (red cubes). The change of the signal incidence angle leads to a loss of corner reflections at the balcony interior.
ideal result in the azimuth-range plane where the appearance of signatures is mainly related to the building and imaging geome-try. Accordingly, it is possible to look out for the expected sig-nature positions in the real SAR images and to explain effects related to the variation of the signal incidence angle. In that re-gard, the analysis can be further concentrated on specific image signatures, as separate image layers are simulated for different re-flection levels. As a general remark, the simulated images reveal for both signal incidence angles that the dominant signal contri-butions of the scene ”Marsstrasse” are related to reflection levels 3 and 5. In contrast, reflection levels 1, 2, and 4 are negligible as the strength of the respective signals is close to zero. A detailed comparison with the real SAR images is given next.
In case of an incidence angle of 39.09◦, triple reflections
dom-inate whereas fivefold reflections are expected to be weak (see Fig. 4b-4d). This is mainly related to corners formed by the facade and the balcony structure. Hence, the simulation gives strong hints that the dominant signature pattern in the TerraSAR-X image, selected as persistent scatterers in the stack, are appar-ently related to reflection level 3. In contrast, fivefold reflections are negligible or not present in the SAR image. For an signal incidence angle of 24.91◦(see Fig. 4e), the building is only
rep-resented by two dominant signature rows in the TerraSAR-X im-age and areas of low gray value. The upper row of dominant point signatures is confirmed by the simulation and is related to triple reflection (see dominant signature row in Fig. 4g). In contrast, the lower row of signatures is related to corners on the rear part of the building roof which are not represented by the building model. Accordingly, the signature row does not occur in the sim-ulated image. The invisibility of the facade is confirmed by the simulated image. The reason is that the corners in the balcony interior are hidden by the balcony railing and, hence, are not in the line-of-sight of the sensor. Instead, radar signals have to fol-low five specular reflections at the balcony structure in order to return to the SAR sensor (see simulated layer in Fig. 4h). To this end, all balcony surfaces have to be characterized by strong reflectance avoiding the loss of signal strength, what is obviously not the case for the ”Marstrasse” building. Finally, the
simula-tion reveals signature rows located at the lower end of the facade layover (triple reflections) and in the shadow area (fivefold re-flections). Both effects are not present in the real SAR image as the ground next to the facade is mainly covered by grass, where specular reflections are disabled.
As a conclusion, the simulation case study ”Marsstrasse” gives an example where the constellation of balcony geometry and sen-sor’s line-of-sight is responsible for the disappearance of persis-tent scatterers. Moreover, the roughness of the ground below the building deactivates a high number of expected reflections. Be-sides the interest in the context of interferometric methods, the results of the case study are also interesting for change detection applications. Facades may fully disappear in case of a change of the incidence angle while signature rows in the building layover may be mistakenly interpreted as facade structures.
1.3.2 Simulated 3D phase centers: The simulated image lay-ers indicate that the dominant signal contributions in both SAR images are related to triple reflections. As RaySAR also covers the elevation direction, the simulated phase centers can be also compared with the results of interferometric algorithms. Hence, as a next step in the course of the ”Marsstrasse” case study, the correspondence of the signal phase centers and the facade geom-etry is checked visually. To this end, the phase centers are pro-jected into the building model based on the known imaging ge-ometry (sensor position, signal incidence angle, aspect angle with respect to the facade) and the 3D coordinates (azimuth, range, el-evation). The merged scenes are visualized in Figure 5 where triple reflections of specular type are represented by red cubes. In case of an incidence angle of 39.09◦, the signal phase centers are
different signal incidence angles and B.) providing a reference for evaluating the localization capability of PSI for high resolu-tion TerraSAR-X data stacks. To this end, a very detailed facade model has been created based on photogrammetric survey and has been simulated using RaySAR, a software based on ray trac-ing techniques. The simulation reveals that the unexpected in-visibility of a selected facade is related to a specific constellation between the facade and imaging geometry. Moreover, simulated 3D phase centers have been related to physical balcony corners of the facade model. Future work will be concerned with com-paring the position of localized, geocoded PS with the simulated reference.
1.5 Acknowledgement
The work presented in the paper is partly funded by the Deutsche Forschungsgemeinschaft (DFG), project VHR-SAR (BA 2033/3-1).
REFERENCES
Adam, N., Eineder, M., Yague-Martinez, N. and Bamler, R., 2008. High resolution interferometric stacking with TerraSAR-X. In: IEEE Transactions on Geoscience and Remote Sensing, Vol. 2, pp. 117–120.
Adam, N., Kampes, B. and Eineder, M., 2004. Developement of a scientific permanent scatterer system: Modifications for mixed ERS/ENVISAT time series. In: In: Proceedings of Envisat & ERS Symposium, Salzburg, Austria, on CD-ROM.
Auer, S., 2011. 3D Synthetic Aperture Radar Simulation for Interpreting Complex Urban Reflection Scenarios. PhD thesis, Deutsche Geodtische Kommission, Reihe C, Nr. 660, Verlag der Bayerischen Akademie der Wissenschaften, ISBN 978-3-7696-5072-3, 126 p., http://dgk.badw.de/fileadmin/docs/c-660.pdf.
Auer, S., Hinz, S. and Bamler, R., 2010. Ray-tracing simulation techniques for understanding high-resolution SAR images. 48(3), pp. 1445–1456.
Ferretti, A., Prati, C. and Rocca, F., 2001. Permanent scatterers in SAR interferometry. 39(1), pp. 8–20.
Franceschetti, G., Iodice, A. and Riccio, D., 2001. Fractal Models for Scattering from Natural Surfaces. Academic Press, chapter 1.6.5, pp. 467–485.
Gernhardt, S., Adam, N., Eineder, M. and Bamler, R., 2010. Po-tential of very high resolution SAR for persistent scatterer inter-ferometry in urban areas. Annals of GIS 16(2), pp. 103–111.