*Corresponding author. Tel: +1 347 707 0410; Email Address: [email protected] (L. Huang)
PAN-INFORMATION LOCATION MAP
X.Y. Zhu a, b, W. Guo a, L. Huang a,*, T. Hu a, W.X. Gao a
a
State Key Laboratory of Information Engineering in Surveying, Mapping and Remote Sensing, Wuhan University, Wuhan 430079, China
b
Key Laboratory of Aerospace Information Security and Trusted Computing of the Ministry of Education, Wuhan University, Wuhan 430079, China
Commission/WG
KEY WORDS: Pan-information Location Map (PILM), big data, Semantic Location, Ubiquitous information, 4D Map
ABSTRACT:
A huge amount of information, including geographic, environmental, socio-economic, personal and social network information, has been generated from diverse sources. Most of this information exists separately and is disorderly even if some of it is about the same person, feature, phenomenon or event. Users generally need to collect related information from different sources and then utilize them in applications. An automatic mechanism, therefore, for establishing a connection between potentially-related information will profoundly expand the usefulness of this huge body of information. A connection tie is semantic location describing semantically concepts and attributes of locations as well as relationships between locations, since 80% of information contains some kind of geographic reference but not all of geographic reference has explicit geographic coordinates. Semantic location is an orthogonal form of location representation which can be represented as domain ontology or UML format. Semantic location associates various
kinds of information about a same object to provide timely information services according to users’ demands, habits, preferences and
applications. Based on this idea, a Pan-Information Location Map (PILM) is proposed as a new-style 4D map to associates semantic location-based information dynamically to organize and consolidate the locality and characteristics of corresponding features and events, and delivers on-demand information with a User-Adaptive Smart Display (UASD).
1. INTRODUCTION
Maps have been considered as communication tools. That is because of the limitation of the human capability to perceive the objective world; human beings have to spend on certain communication tools to understand the objective world. Numerous maps, such as Cyber-map (Jiang and Ferjan, 1997), Cybercartography (Taylor and Lauriault, 2005), Google Maps, are being produced in order to understand and perceive objective world from different perspectives and for a variety of purposes.
Nowadays, as “big data” era emerges, large volumes and varieties of data exist everywhere. According to the International Data Corporation (IDC), it is estimated that worldwide data, approximated at 0.8 ZB (a trillion GB) in 2009, will increase to 40 ZB by 2020 (Aisling and Roy, 2013). In light of this, solutions such as mapping “big data” into map should be given. The volume is so large that it is necessary to compress data by selecting suitable information which is to be represented on the map. What is suitable information? It depends on the demands of users. Suitable information emphasizes the association between data and the end-users, also between data and data. Thus, there comes the key problem that how to associate “big data” to satisfy users’ requirements.
Additionally, Michael F. Goodchild gave a report named
“Looking Forward: Five Thoughts on the Future of GIS”
(Goodchild, 2011). The five thoughts include “The 13 Percent Technology” which emphasizes the integration of indoors and outdoors, “Knowing Where Everything Is” which emphasizes the understanding of various location descriptions ranging from the formal coordinates of GIS to the informal expressions, “An
Internet of Things” which emphasizes knowing where everything is, and where it has been, “Real-Time GIS” which shifting GIS from the relatively leisurely process of analysing static data to a far more dynamic process of real-time monitoring and decision making, and “Multiple Views of the World” which means presenting GIS in multiple points of view of individuals and groups. In summary of the report, “indoors and outdoors integration”, “locations understanding”, “dynamic information representation” and “user-oriented demand” are the major problems of GIS in the future.
In 1987, Robert E. Williams proposed that “It has been estimated that approximately 80% of the informational needs of a local government policymaker is related to a geographical location” (Williams, 1987). In other words, it can be concluded that 80% of data has location element. Why don’t we use location-based information to associate various related data? If this works, any location related description from the formal coordinates of GIS to the informal can be understood and various types of big data can be associated, ranging from the outdoors to indoors. It gives good solution to “the five thoughts on the future of GIS” presented by Goodchild. Accordingly, in this paper, we do research on extended Semantic Location Model, based on which spatial-temporal association model is established to associate related information.
Furthermore, data are associated, but how to represent the associated data. It has been shown that dynamic 3D visualisations can potentially have considerable advantages versus 2D approaches in effectively conveying spatial content (Enginet, 2009; Jobst, 2007). Four dimensional maps (4D maps) are a useful method for visualizing dynamic environmental processes in an intuitive manner (Bernd et al, 2013). A 4D map
not only shows the 3D spatial information, but also represents the dynamics of the information as time changes; it not only represents outdoor/ground 3D space, but also indoor/underground 3D space.
Concluding the problems above, this paper gives a solution, proposing a new-style map named “Pan-information Location Map”. It is defined as “a 4D map, which associates dynamically various information based on locations, illustrates locality and various corresponding characteristics of features and events, and delivers on-demand information with user-adaptive smart display (UASD)”.
2. WHY PAN-INFORMATION LOCATION MAP
Why do we need a new term? A major reason is to conform to the mainstream of big data and reassert the importance of maps and deep learning associated information to satisfy users’ demand. Nowadays, more and more electronic map, dynamic map and cyber-map emerge. “Cybercartography” coined by Taylor is a map defined as “The organization, presentation, analysis and communication of spatially referenced information on a wide variety of topics of interest to society in an interactive, dynamic, multisensory format with the use of multimedia and
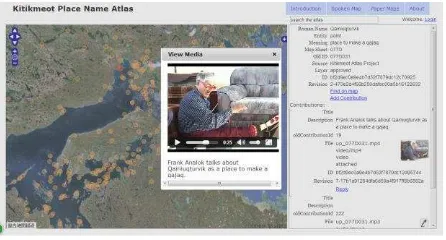
multimodal interfaces” (Taylor and Lauriault, 2005). Figure 1 is
an example of Cybercartography, which include several types of data representation, including video, image and text.
Figure 1. An Example of Cybercartography
However, Cybercartography cannot satisfy the requirement of big data era and the future of GIS. They are limited in some aspects, so we compare the differences between cyber-cartography and our proposed Pan-information Map.
(1) The way of data collection. Cybercartography is multisensory using vision, hearing, touch and eventually, smell and taste. However, as new technology develops, such as communication technology, sensor technology, data comes from everywhere, ranging from human made to machine generated, from underground to space, and from indoors to outdoors. Therefore, the volume and variety of data becomes larger and larger.
(2) The way of data association. Cybercartography considers less about how to associate data, but about the limited types of data, such as image, video, sound and etc. However, in Pan-information location map, we demonstrate the importance of location, based on which we establish semantic location model and location association model to associate location related information.
(3) The way of map representation. Cybercartography represents information on the map using multimedia format. However, in PLMP, it expresses information in various ways, including indoor and outdoor (ground/underground) 3D model, outdoor streetscape and indoor panorama. The key point is that PLMP can represent dynamics, which means that as time changes, the corresponding information on the map will be changed and even the expression of map will be changed.
In conclusion, owing to the emergence of big data era, everything related will be changed, including the way we capture data, the way we process data and the way we represent data. Thus, we propose a new-style map named “ Pan-information Location Map”.
3. PAN-INFORMATION LOCATION MAP (PILM)
3.1 Compositions of PILM
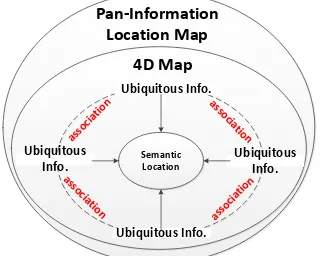
The definition of Pan-information Location Map (PILM) is described in Section 1 and Figure 1 shows the representation of PILM. When a user stays at a place, the information which is related to the user or is interesting to the user will be pushed according to locations association. Information is collected from various kinds of resources, such as the Internet, industries and sensors. For the integrity and diversity of data visualization, we squeeze all sorts of four-dimensional data onto maps (4D map) to show indoors and outdoors, ground and underground of the objective world. Furthermore, dynamics can also be represented, such as real-time traffic flow, the historical trajectory of the target, and etc. Meanwhile, eight major characteristics of PILM are outlined in this paper:
Figure 1. The representation of Pan-information Location Map
PILM accepts data timely from earth observation systems, environmental monitoring, statistics, the internet, the internet of things, mobile communication networks, and sensor webs.
PILM deploys semantic location to associate and interpret various kinds of information according to domain knowledge, application requirements, users’ demands and preferences.
PILM generates 4D maps with cross-disciplinary knowledge and technologies to provide information services to individuals, government, civil society and the private sector.
PILM illustrates indoor and outdoor scenarios, as well as surface and underground spaces, in a uniformed data structure and organization.
PILM is highly adaptive to user requirements and devices
in flexible interactive ways. Users’ inputs and preferences
are maintained and assist to determine what kind of information should be delivered and what kind of portrayal style should be used to display the information. PILM can be applied to a wide range of domains such as
indoor and outdoor navigation or tracking, information query based on natural language, emergency rescue, and security monitoring.
In order to simplify the understanding of PILM, we decompose PILM into three key elements which are closely related to each other and Figure 2 shows the components structure. Ubiquitous information is captured by various means, such as the Internet, sensor network, and etc. In order to simplify the data management, we associate ubiquitous information based on semantic locations which will be described in detail in the next section. Furthermore, 4D map is established to represent the ubiquitous information, which shows not only 3D space, but also data changes as time changes. Therefore, “Ubiquitous Information”, “Semantic Location” and
“4D Map”, three key elements compose “Pan-information Location Map”. In the next part, the detailed description of each component is given.
Figure 2. Composition of Pan-Information Location Map
3.2 Ubiquitous Information
“A DAY IN THE INTERNET” (Digialbuzz Blog, 2013) demonstrates that 2 million blog posts are written; 250 Million photos are uploaded to Facebook; 864,000 hours of video are uploaded to YouTube. The International Data Corporation (IDC) estimated that data in 2009 was 0.8ZB, it was 1.82ZB in 2011
and it will be 40ZB till 2020. Therefore, data is everywhere and comes from various kinds of resources. Another example takes place around us is that there will be 250 thousand of surveillance cameras fixed in important public places, crossings, bridges, financial institutions, and etc. Then, huge amount of data will be generated every hour, and every day.
As it is shown in Figure 1, ubiquitous information can be captured from the Internet, industrial network, and sensor network. The Internet resources include the social network (such as Facebook, micro-blog, and etc.), positions of interest (POI), Volunteered Geographic Information (VGI), and etc. The industrial resources contain weather, transportation, public security, surveying and mapping, and etc. The sensor network resources are mainly collected from various kinds of sensors, such as traffic sensor, RFID positioning sensor, temperature sensor, humidity sensor, and etc.
For the Internet, there are many types of web crawler for grabbing data and the Apache Nutch (http://nutch.apache.org/) is an effective one. Also, some of the social network provide interface to access and download data. For example, Sina Weibo (http://weibo.com/) is a Chinese micro-blog website which provide API and SDK for various programming language (such as JAVA, PHP, Flash, and etc.). The API is able to get various information, including user information, comments, relationships, favourites, and etc. For the industrial information, some of them are publicly accessible through Web services
(http://www.36wu.com/Service.aspx), such as weather report,
ID query, train schedule query, and etc. However, some of them are limited for the consideration of security. If you really need data, communications with the department are necessary. For Sensor Network, similar with the industrial data, some of information can be collected by us, but some of them are limited, except that they are allowed being accessed by the specific department.
When ubiquitous information is collected in large quantities and in diversity, what shall we do to associate each other? Robert E. Williams concluded that 80% of data has location element. According to the hint, we classify the data type into location description data and location-based data. In detail, location description data are summarized, including place name, address, IP, POI (Position of Interest), zip code and etc. Meanwhile, location-based data includes social data, traffic data, and user preferences data and etc. Table 1 represents the types of locations and corresponding examples.
Examples Type of Entity Location
“Wuhan University” Place Name
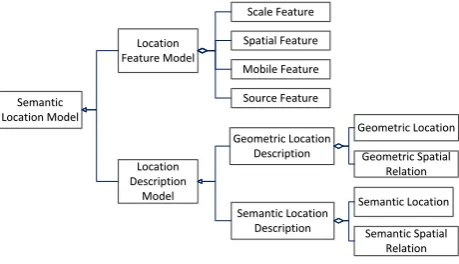
3.3 Semantic Location Model
Semantic location model (SLM) is a fundamental component of Pan-Information Location Map. It defines locations and trajectories of static and dynamic objects and the corresponding spatial semantic, scale semantic, property semantic, source semantic and mobile semantic. SLM consists of location description model and location feature model as shown in Figure 3. Location description model describes indoor and outdoor location, enabling PILM to integrate and parse location information with different spatial references, representations and semantics. Location feature model depicts semantic features of a location in different levels, supporting PILM to implement location calculation and location-related information analysis based on semantic characteristics.
Location descriptions consist of three elements, the reference location, the primary location (PL) and the location relation. A location can be the reference location acting as an indicator to determine a position for a locality regarded as the primary location. The location relation explicitly depicts spatial relations between the primary location and the reference location. For
example, in the description “China adjoins Mongolia”,
Mongolia acts as the reference location to locate China as the primary location. The location relation between them is adjacency. Sometimes the primary location might be not
explicitly expressed, such as the description “next to Wuhan University”.
Location description is categorized into geometric location description and semantic location description. Geometric location description precisely describes location information based on a reference coordinate system. A typical example is (114.12°, 30.21°) in geodetic coordinate system. Geometric location description consists of two elements, geometric location and geometric spatial relation. The former acted as the reference location described with either raster coordinates (e.g. raster cell A (1, 1)) or vector coordinates (e.g. vector point B (112.32°, 32.42°)). The latter describes geometric offsets between the reference location and the primary location. A geometric offset can be a distance offset (e.g. 500m) and a directional offset (N2E15°). Distance offset represents the quantitative distance from the reference location to the primary location. Direction offset depicts the angle between a reference direction and the direction line from the reference location to the primary location. The reference direction is generally the north of the reference location. A combination of distance and direction offset is more often used
to refine the position of a location. An example is Location = (114.2323°E, 32.2341°, 5km, N2E 20°).
Geometric location description has been widely used because of the convenience for the storage and computation in computers. It is not friendly for human beings, however, to cognize and comprehend the real features and events represented by them. Thus, semantic location description is identified to represent a semantic location with qualitative descriptions expressed in nature language. As described earlier, semantic location is a meaningful locality for humans. It can be place name, postal address, zip code, named entity, URL, IP address, telephone number, indoor location, velocity, occurrence of geo-event, etc. The relations between them, called semantic spatial relation, are described with spatial terms. There are three binary relations mostly used, including qualitative distance relations, qualitative directional relations and topological relations. Qualitative distance relations describe qualitatively how far the distance is between semantic locations, such as “near” and “far”. However the spatial term “far” is rarely used. Qualitative directional relations represent space cognition results of sorting of semantic locations. This sorting can be described as an absolute direction (such as North, East, South and West) or a relative direction (such as left, right, front and back). Topological relations represent containment, adjacency and intersection relations of semantic locations, such
as “locate in”, “next to” and “the intersection of”. The three
relations can be single or compound to describe location relation. Besides, there are some special spatial relations, such
as “along”, “between”, etc. The diversity of semantic spatial
relations provide means to associate spatially different semantic locations. As a result, a connected tie can be built for semantic location related ubiquitous information.
3.3.2 Location feature model
In the previous literature, Zhao (Zhao et al., 2007; Zhao and Zhang, 2007) argued that location semantics include location name, relationships, properties and time. Here we consider location semantics from the perspective of location calculation. In location feature model, four semantics are defined including spatial feature, scale feature, source feature and mobile feature. Spatial feature as the basic semantic of location include footprint and uncertainty field. Footprint is the geographic extent of location. It is depicted as geometry with coordinates, such as point, polyline, polygon, solid and their compound. When location becomes uncertain, uncertainty field represents the probability distribution of location in its footprint. Spatial feature is mostly used to position and represent a location. Scale feature is the scale semantic of location. Scale is an abstract concept and hard to measure quantitatively. We define a variety of scale reference concepts to describe the scale semantic of location, such as map scales (1:500), administrative hierarchy (city level) and spatial resolution (500m). In the process of geo-referencing locality description, scale feature is needed. Source feature refers to acquisition means of location information. A location might be discrete or continuous positioning results produced by devices at a timestamp or time period. It also might be derived from the verbal description of human beings. With the source feature of location, we can conduct location fusion to derive a more precise location. For example, it is popular to integrate positioning results of Wi-Fi and RFID to locate objects. Mobile feature depicts mobile characteristics of trajectory location of a dynamic object, such as velocity and orientation. This feature is helpful to mine interesting place from trajectory and analysing patterns of human behaviour. All location semantics above are mainly considered in the process
of positioning location descriptions and calculating location relations, as well as analysing and mining located-related ubiquitous information.
3.3.3 Semantic Location Association
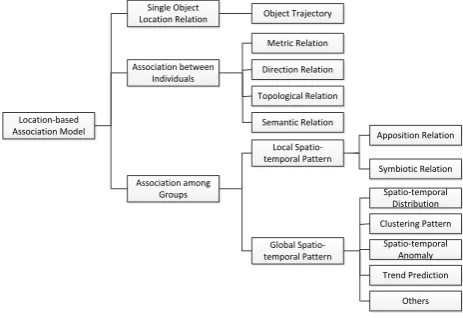
Through the feature analysis of multisource ubiquitous information on spatio-temporal benchmarks, spatial-temporal semantics, express models and qualities, summarize the internal spatio-temporal relation of ubiquitous information and build its formal description and expression. By adopting the efficient spatio-temporal relation analysis of ubiquitous information and exploring and qualitative reasoning the algorithm, extract the spatio-temporal relation on spatial position (address and geocoding), spatial form, spatial relation, spatial association, spatial contrast, spatial trend, spatial motion, time series and time cycle, obtain deep relation knowledge such as spatio-temporal distribution, clustering pattern, spatio-spatio-temporal anomaly, trend prediction, spatial co location pattern, sequential pattern and cycle, and offer comprehensive ubiquitous information of all aspects of location-aware based on location and target entity. The location-based association model is represented in Figure 4.
Location-based Association Model
Single Object Location Relation
Association between Individuals
Association among Groups
Object Trajectory
Metric Relation
Direction Relation
Topological Relation
Semantic Relation Local Spatio-temporal Pattern
Global Spatio-temporal Pattern
Apposition Relation
Symbiotic Relation Spatio-temporal Distribution Clustering Pattern
Spatio-temporal Anomaly Trend Prediction
Others
Figure 4. Location-based Association Model
3.4 Four Dimensional Map
Various data is associated according to the sematic location model and location-based association model, but how to express information on the map. It has been found that users perceive information derived from spatio-temporal data faster from animated than from static maps (Koussoulakou and Kraak, 1992), which brought up a variety of studies in this field regarding animation techniques and visualisation criteria (e.g., Acevedo and Masuoka, 1997, Van Wijk, 2002). There are some approaches to representing cartographic information in 3D, but they mostly do not take the dynamic presentation of temporal variations into account.
With the rise of spatio-temporal data acquisition and storage, institutions and researchers have been trying to cope with questions of storing, updating and visualizing 3D and 4D data in several fields for some time now. As Goodchild mentioned that most of technologies focus on outdoors, however for individuals, 87% of time is spent in indoors. Therefore, 4D map in PILM aims to establish a transaction model to integrate indoors and outdoors, ranging from 3D model to panorama. It will represent indoors/outdoors, ground/underground 3D information. Figure 5 shows the
visualization of indoor/outdoor integration: (a) is the remote sensing image of a laboratory in Wuhan University; (b) and (c) represent the 3D model of outdoor; (d) is the 3D model inside of laboratory. For the dynamics of a 4D map, it is able to specify a period of time and view only those posts relevant to that time.
(a) (b)
(c) (d)
Figure 5. Visualization of Indoor/Outdoor Integration
4. CONCLUSION
With the era of big data and the challenges on GIS, maps face a new revolution, not only data management, but also data representation. Traditional maps (such as Cybercartography, Google maps, and etc.) are unable to solve the problem, therefore we propose a new-style map named “Pan-information Location Map”, based on which data can be associated by semantic locations to satisfy the user’s requirement.
In the future, more and more data will be collected and saved by means of the Internet, several industrials and the sensor network. Also, several key technologies, such as data modelling, indoor and outdoor positioning, location extraction from informal expressions, spatio-temporal correlations analysis, and etc., are needed to be researched. Furthermore, we will use PILM to demonstrate related applications, such as user navigation, electric power, public security police, surveying and mapping, and etc.
ACKNOWLEDGEMENTS
This research was supported by “National Key Technology R&D Program of China Grant 2012BAH35B03”.
5. REFERENCES
Acevedo, W. and Masuoka, P., 1997. Time-series animation techniques for visualizing urban growth. Computers & Geosciences, 23, pp. 423–435.
Aisling O. D. and Roy D. S., 2013. The next generation of big data storage. Synthetic DNA, 4(3), pp. 123-125.
Bernd R., Florian H., Andreas R., and Wolfgang S., 2013. Towards 4D cartography – four-dimensional dynamic maps for understanding spatio-temporal correlations in Lightning Events. The Cartographic Journal, 50(3), pp. 266–275.
Bin J., and Ferjan J. O., 1997. Cyberlllap: the map for cyberspace. The Cartographic Journal, 34(2), pp. 111-116.
Engin, B., Bozkaya, B. and Balcisoy, S., 2009. Introducing level of detail to 3D thematic maps, Proceedings in GeoViz 2009, Hamburg, Mar 3–5, pp. 8-10.
Jobst, M. and Germanichs, T., 2007. The employment of 3D in cartography–an overview. Multimedia Cartography, pp. 217– 228.
Koussoulakou, A. and Kraak, M. J., 1992. Spatio-temporal maps and cartographic communication, The Cartographic Journal , 29, pp.101–108.
Goodchild M. F., 2011. Reports on ESRI ArcWatch “Looking
Forward: Five Thoughts on the Future of GIS”.
http://geodatapolicy.wordpress.com/2011/02/25/goodchild-on-looking-forward-five-thoughts-on-the-future-of-gis/ (Feb 2011).
Taylor, D. R. F. and Lauriault, T.P, 2005. Developments in the theory and practice of cybercartography: Applications and Indigenous Mapping.
Van Wijk, J. J., 2002. Image based flow visualization. ACM Transactions on Graphics, 21, pp. 745–754.
Zhao D. Q., Lue Z. P., and Zhang X. G., 2007. Location and its semantics in location-based services. Geo-spatial Information Science, 10(2), pp. 145-150.
Zhao, D. and Zhang X., 2010. Location semantics in positioning services. The 2nd International Conference on Future Computer and Communication (ICFCC), Wuhan, China, 3, pp. 615-619.
Digialbuzz Blog, “Infographic: 24 Hours on the Internet”,
http://www.digitalbuzzblog.com/infographic-24-hours-on-the-internet/ (Mar 13, 2012).
Robert E. W., 1987. Selling a geographical information system to government policy makers. Annual Conference of the Urban and Regional Information Systems Association.