www.elsevier.nlrlocateraqua-online
Sensory characteristics of farmed and wild
Atlantic salmon
Linda J. Farmer
a,), Janice M. McConnell
a,1, David J. Kilpatrick
ba
Department of Food Science, The Queen’s UniÕersity of Belfast, Newforge Lane, Belfast BT9 5PX, UK
b
Department of Biometrics, The Queen’s UniÕersity of Belfast, Newforge Lane, Belfast BT9 5PX, UK
Received 28 January 1999; received in revised form 11 November 1999; accepted 9 December 1999
Abstract
The eating quality characteristics of farmed and wild Atlantic salmon, from locations in and around Northern Ireland, were compared by sensory analysis of frozen salmon. Quantitative descriptive analysis, using a trained panel, was used to compare specific attributes, while an untrained panel used hedonic scaling methods to assess acceptability. Freezing affected texture and appearance but had little influence on flavour, while extended frozen storage had few further effects. The main differences in eating quality occurred between river-caught salmon and sea-caught salmon, whether farmed or wild; river-caught salmon tended to receive the highest scores for earthy aroma, flavour and aftertaste and the lowest scores for salmon-like odour and flavour. However, farmed salmon tended to exhibit textures which were more moist and light and less firm than salmon from wild sources. Farmed salmon were at least as acceptable as wild salmon in terms of appearance, odour, flavour, texture, aftertaste and overall acceptability.q2000
Elsevier Science B.V. All rights reserved.
Keywords: Acceptability; Atlantic salmon; Flavour; Odour; Storage; Texture; Appearance; Farmed; Wild
1. Introduction
Ž .
The farming of Atlantic salmon Salmo salar has become an important commercial enterprise in a number of North European regions, including Scotland, Ireland and the fjords of Norway. However, the wild Atlantic salmon has been regarded as a seasonal
)Corresponding author. Tel.:q44-28-90-255342; fax:q44-28-90-669551.
Ž .
E-mail address: [email protected] L.J. Farmer .
1
Department of Public Health Medicine, NHSSB, County Hall, Ballymena, Co Antrim, BT42 1QB UK 0044-8486r00r$ - see front matterq2000 Elsevier Science B.V. All rights reserved.
Ž .
luxury food for centuries, and it is often asserted that the eating quality of wild salmon is better than that of farmed fish.
The possible quality differences between wild and farmed salmon have been the subject of research for both the Atlantic salmon and the various species of Pacific
Ž .
salmon Oncorhynchus sp. ; some authors have reported differences in eating quality between wild and farmed salmon while others have found no difference. Sylvia et al.
Ž1995 found that the wild salmon had more ‘delicate, fresh fish flavour’ but no.
difference in texture from farmed salmon. In terms of colour, the flesh of wild salmon
Ž .
has also variously been reported to have less yellow hue Skrede and Storebakken, 1986
Ž .
and more red colour Higgs et al., 1989 than that of their farmed equivalents. Sensory differences in colour, texture or flavour have also been reported between wild and
Ž
cultured fish of other species Hatae et al., 1989; Aoki et al., 1991; Prescott and Bell,
.
1992; Orban et al., 1997 . In contrast, other authors have reported that the eating quality
Ž
of farmed salmon is similar or preferred to that of wild Bartos, 1989; Higgs et al.,
. Ž
1989 . Thus, the effect of domestication on the eating quality of Atlantic salmon and
.
other fish species remains unclear. The above studies have compared fish from only two or three sources for any one species of salmon and it is possible that any sensory differences observed could be entirely due to the difference in location. Considerable sensory differences can exist between trout from two farms from the same region
ŽFarmer, unpubl. data . Thus, the primary purpose of this investigation was to examine.
sensory differences between farmed and wild Atlantic salmon from a total of eight locations in Northern Ireland, the Republic of Ireland and Scotland. As it was necessary to conduct these studies on frozen fish, a short investigation was also conducted to check the effect of frozen storage on the sensory attributes under examination.
2. Materials and methods
2.1. Comparison of fish from different sources
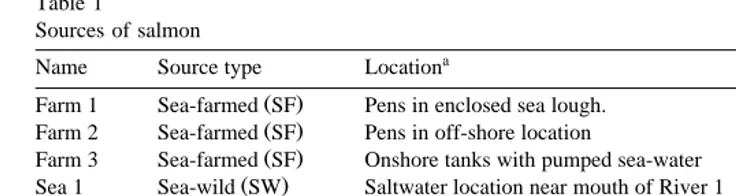
Farmed and wild salmon were obtained from a total of eight sources in Northern Ireland, the Republic of Ireland and Scotland during 1993 and 1994, as shown in Table 1. The method of capture and slaughter was inherently different between sources. Salmon from River 1 were caught in salmon traps and slaughtered by exposure to elevated concentrations of CO2 and a blow to the head. Salmon from River 3 were caught by hook and line. Salmon from the remaining wild sources were caught using
Ž . Ž .
drift nets sea or draught nets river and either died in the nets or were killed by a blow to the head. Salmon from Farm 3 were also killed by a blow to the head while those from Farms 1 and 2 were asphyxiated using CO . Those from Farm 1 were also bled by2
Ž
gill removal. All salmon were harvested during the period June to August the wild
.
salmon season and were held on ice until transported to the laboratory within 3 days of harvest.
Table 1
Sources of salmon
a
Name Source type Location 1993 1994
Ž .
Farm 1 Sea-farmed SF Pens in enclosed sea lough. U U
Ž .
Farm 2 Sea-farmed SF Pens in off-shore location U U
Ž .
Farm 3 Sea-farmed SF Onshore tanks with pumped sea-water U U
Ž .
Sea 1 Sea-wild SW Saltwater location near mouth of River 1 – U
Ž .
Sea 2 Sea-wild SW Saltwater location near mouth of Rivers 2r3 U U Ž .
River 1 River-wild RW 3 km from river mouth U U
b Ž .
River 2 River-wild RW 24 km from river mouth U
b Ž .
River 3 River-wild RW 4 km from river mouth U
a
‘Lough’ is the local name for either a partially enclosed sea water inlet or a freshwater lake.
b
Combined and treated as one source during 1993 due to low numbers captured.
harvest were determined by reading annuli in the fish scales, under a binocular microscope. Both wild and farmed salmon were 2 or 3 years old and had spent one winter at sea.
The fish were stored in a chill-room at 0–28C until evisceration, which occurred within 5 days of harvesting and after the resolution of rigor mortis. The pelvic and dorsal fins were removed and the region between the pectoral fin and the cloaca was cut
Ž .
perpendicular to the long dimension of the fish into steaks approx. 25 mm thick ; these were labelled A to I or J in the direction of head to tail. Generally, steaks B, D, F, H and J were used for sensory evaluation. The steaks were immediately vacuum-packed in
Ž
laminated vacuum pouches nylon 20 mm, polyethylene 60 mm; Brow Packaging,
.
Belfast , frozen and stored at y24"38C until required. As salmon from all sources were harvested throughout the wild salmon season and were analysed over a period of 3–4 months, the duration of frozen storage prior to sensory analysis ranged from 5 to 18 weeks in the 1993 trial and from 8 to 24 weeks in the 1994 trial.
2.2. Effect of freezing
Ž .
Salmon from Farm 2 and Farm 3 average weights 2.8 kg and 2.7 kg were harvested during February and April 1994, respectively. Salmon steaks were prepared and
Ž .
vacuum-packed as described above. Salmon steaks to be analysed when fresh unfrozen were refrigerated for 1–2 days prior to sensory analysis; the remainder were immedi-ately frozen and stored aty24"38C for 3–14 days prior to analysis.
2.3. Effect of length of frozen storage
Salmon from Farm 2, weighing on average 2.7 kg, were harvested between August
Ž .
1993 and February 1994. The salmon were again frozen as steaks as described above and stored at y24"38C for 33, 15, 8 and 4 weeks before the commencement of sensory analysis.
2.4. Sensory analysis
Ž .
Ž .
placed individually on inverted, perforated aluminium trays 180=120 mm which were placed in stainless steel baking trays. Tap water was added to a depth of 10 mm and the whole tray covered in aluminium foil. The steaks were cooked for 20 min in a
Ž .
fan-assisted oven Falcon E1102, Glynwed Appliances, Larberth, Scotland . Different
Ž .
cooking temperatures were used for the 1993 salmon 1808C and the 1994 salmon
Ž2008C due to differences in the numbers of steaks in the oven. The ultimate internal.
temperature ranged from 768C to 858C depending on the size of steaks. Each panellist received one half steak served on a heated porcelain plate; a small portion from the
Ž .
ventral region was served separately in a heated, lidded porcelain dish 80 mm diameter
Ž
for odour assessment. Tap water, filtered through a domestic water filter Boots the
.
Chemist, Nottingham, UK to remove any extraneous flavours, and water biscuits were supplied as palate cleansers. All panels were conducted in ventilated booths under N-sky
Ž
lighting and the data collected using ‘PSA 1.64’ data collection software Oliemans,
.
Punter & Partners, Utrecht, the Netherlands .
Ž .
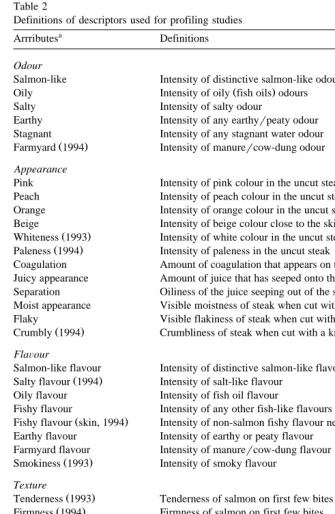
Quantitative descriptive analysis or sensory profiling Stone et al., 1974 was used to analyse salmon from various sources. A list of attributes describing aroma, appearance, flavour, texture and aftertaste was generated and refined, after discussion, by a trained panel to eliminate repetition and redundant descriptors, and to agree on the definition of
Ž .
each attribute Table 2 . Prior to the 1994 season the attributes were further refined, after additional training and discussion, in the light of experience gained during 1993. Ten panellists assessed salmon harvested in 1993 using 32 attributes, while eight people used 37 attributes for the 1994 trial. One salmon from each source was assessed by all panellists during a panel session; for salmon harvested during 1993, a total of 20 salmon from each source were assessed, while 10 salmon from each source were used during 1994. The experimental design used in the 1993 trial involved randomising the order of presentation for each panellist. For the 1994 trial, an 8=8 Latin square, balanced for
Ž .
presentation order and first-order carry-over effects, was used MacFie et al., 1989 .
Ž .
Random permutations Cochran and Cox, 1957 were used to apply blocks of the design to panel sessions.
Sensory profiling was also conducted on fresh and frozen salmon, and on salmon frozen for different lengths of time, using 32 attributes, as described above for the salmon harvested during 1993.
Hedonic scaling was conducted using 40 untrained panellists, drawn from staff members unfamiliar with the study, who subjectively assessed the acceptability of the aroma, appearance, flavour, texture and aftertaste as well as the overall acceptability of salmon obtained from 6 sources during 1993. Salmon samples were scored using an
Ž .
eight point hedonic scale ranging from extremely acceptable 1 to extremely
unaccept-Ž .
able 8 .
2.5. Statistical analysis
Ž
The salmon profiling data comprised measurements on 120 fish 20 panel sessions, 6
. Ž .
Table 2
Definitions of descriptors used for profiling studies
a
Arrributes Definitions
Odour
Salmon-like Intensity of distinctive salmon-like odour
Ž .
Oily Intensity of oily fish oils odours
Salty Intensity of salty odour
Earthy Intensity of any earthyrpeaty odour
Stagnant Intensity of any stagnant water odour
Ž .
Farmyard 1994 Intensity of manurercow-dung odour
Appearance
Pink Intensity of pink colour in the uncut steak Peach Intensity of peach colour in the uncut steak Orange Intensity of orange colour in the uncut steak Beige Intensity of beige colour close to the skin
Ž .
Whiteness 1993 Intensity of white colour in the uncut steak
Ž .
Paleness 1994 Intensity of paleness in the uncut steak
Coagulation Amount of coagulation that appears on the surface of the salmon steak Juicy appearance Amount of juice that has seeped onto the plate from the salmon Separation Oiliness of the juice seeping out of the salmon.
Moist appearance Visible moistness of steak when cut with knife Flaky Visible flakiness of steak when cut with a knife
Ž .
Crumbly 1994 Crumbliness of steak when cut with a knife
FlaÕour
Salmon-like flavour Intensity of distinctive salmon-like flavour
Ž .
Salty flavour 1994 Intensity of salt-like flavour Oily flavour Intensity of fish oil flavour
Fishy flavour Intensity of any other fish-like flavours
Ž .
Fishy flavour skin, 1994 Intensity of non-salmon fishy flavour near the skin of the salmon steak Earthy flavour Intensity of earthy or peaty flavour
Farmyard flavour Intensity of manurercow-dung flavour
Ž .
Smokiness 1993 Intensity of smoky flavour
Texture
Ž .
Tenderness 1993 Tenderness of salmon on first few bites
Ž .
Firmness 1994 Firmness of salmon on first few bites
Ž .
Springiness 1993 Springiness of salmon on first few bites Moist texture Amount of moisture released on chewing Light texture Lightness and smoothness of salmon in mouth Chewiness Amount of chewing required before swallowing
Flakiness Degree to which the salmon breaks down into flakes in the mouth Clinginess Degree to which the salmon clings to the mouth and teeth
Aftertaste
Time Time when aftertaste starts
Overall aftertaste Intensity of aftertaste Earthy aftertaste Intensity of earthy aftertaste Metallic aftertaste Intensity of metallic aftertaste Chicken-like aftertaste Intensity of chicken-like aftertaste
Ž .
Oily aftertaste 1994 Intensity of fish oil aftertaste
a
Ž .
analyses of variance ANOVA were carried out in each year, based on individual fish means for the various attributes. The effects of sessions were removed in the analyses providing a total of 105 and 63 residual degrees of freedom, respectively, for the 2
Ž .
years. When significant P-0.05 differences were found between the sources, Dun-can’s multiple range test at a probability level of Ps0.05 was used to establish
Ž .
significant differences O’Mahoney, 1986 . Data for hedonic scaling were also analysed
Ž
by ANOVA and Duncan’s Test. While data obtained by hedonic scaling or, for that
.
matter, profiling may not be strictly linear and therefore may not fulfil all the assumptions for these parametric tests, they are still useful methods for the interpretation
Ž .
of such data O’Mahoney, 1986 . This should be less of a problem for the profiling data as reference to the Central Limit Theorem implies that the assumption of a Normal Distribution for means over panellists may be reasonable. However, this is not the case for the hedonic scaling data and, accordingly, these were also analysed by the nonpara-metric Kruskal–Wallis rank sum test which does not assume normality of the
observa-Ž .
tions. This showed significant differences P-0.05 for appearance, flavour and aftertaste in agreement with the parametric tests. Hence, this paper concentrates on the results of the parametric tests.
Correlation coefficients were calculated to determine whether there was any relation-ship between the mean scores obtained by hedonic scaling for acceptability and the mean scores for each profiling attribute for the six salmon sources assessed in 1993. Regression analysis using quadratic terms was also conducted to check for possible curvilinear relationships.
Ž .
Principal components analysis PCA was conducted on the mean profiling scores for each individual salmon assessed, for both years of study, using the Genstat 5 statistical package and based on the sums of squares matrix between the attributes as the observations were on a common scale.
3. Results
3.1. Comparison of fish from different sources
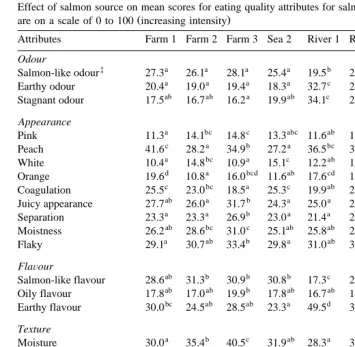
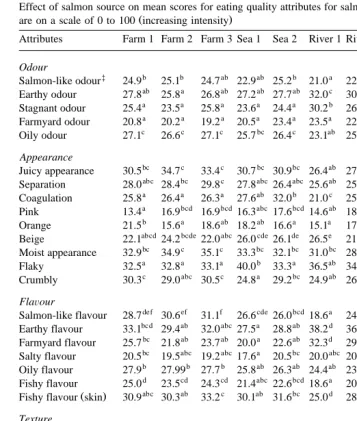
Analysis of the sensory profiling results by ANOVA shows that 25 out of 32 attributes in the 1993 trial, and 32 out of 37 attributes in 1994, gave significant
Ž .
Table 3
Effect of salmon source on mean scores for eating quality attributes for salmon harvested during 1993. Scores
Ž .
are on a scale of 0 to 100 increasing intensity
†
Attributes Farm 1 Farm 2 Farm 3 Sea 2 River 1 Rivers 2r3 Significance SEM
Odour
UUU
‡ a a a a b a
Salmon-like odour 27.3 26.1 28.1 25.4 19.5 26.0 0.87
UUU
a a a a c b
Earthy odour 20.4 19.0 19.4 18.3 32.7 25.5 1.53
UUU
ab ab a ab c b
Stagnant odour 17.5 16.7 16.2 19.9 34.1 22.1 1.75
Appearance
U
a bc c abc ab c
Pink 11.3 14.1 14.8 13.3 11.6 14.5 0.81
UUU
c a b a bc ab
Peach 41.6 28.2 34.9 27.2 36.5 31.4 1.71
UUU
a bc a c ab abc
White 10.4 14.8 10.9 15.1 12.2 13.0 0.85
UUU
d a bcd ab cd abc
Orange 19.6 10.8 16.0 11.6 17.6 13.5 1.38
UUU
c bc a c ab ab
Coagulation 25.5 23.0 18.5 25.3 19.9 21.3 1.23
UU
ab a b a a a
Juicy appearance 27.7 26.0 31.7 24.3 25.0 25.4 1.28
UU
a a b a a a
Separation 23.3 23.3 26.9 23.0 21.4 21.1 1.03
UU
ab bc c ab ab a
Moistness 26.2 28.6 31.0 25.1 25.8 24.4 1.24
U
a ab b a ab ab
Flaky 29.1 30.7 33.4 29.8 31.0 30.5 0.93
FlaÕour
UUU
ab b b b c a
Salmon-like flavour 28.6 31.3 30.9 30.8 17.3 27.4 0.93
U
ab ab b ab ab a
Oily flavour 17.8 17.0 19.9 17.8 16.7 14.8 1.04
UUU
bc ab ab a d c
Earthy flavour 30.0 24.5 28.5 23.3 49.5 35.4 1.73
Texture
UUU
a b c ab a ab
Moisture 30.0 35.4 40.5 31.9 28.3 31.3 1.58
UUU
ab b c ab a ab
Tenderness 44.5 50.4 57.7 44.3 39.9 44.6 1.90
UUU
a b b a a a
Lightness 39.7 45.4 49.1 40.4 38.3 40.4 1.31
UUU
bc ab a bc c b
Chewiness 36.3 31.7 27.3 35.7 38.4 33.6 1.46
UU
ab bc c a ab bc
Flakiness 31.9 33.7 36.0 30.2 32.3 35.1 1.02
Aftertaste
UUU
ab ab ab b c a
Chickeny aftertaste 12.6 14.5 12.7 15.9 8.7 12.4 1.05
UUU
a a a a c b
Earthy aftertaste 24.6 20.1 23.5 20.7 43.0 31.1 1.55
UUU
a a a a b a
Metallic aftertaste 15.9 14.2 14.0 15.3 23.3 17.6 1.16
UU
b b b b a ab
Time when aftertaste starts 18.2 21.6 19.2 18.0 13.1 17.2 1.49
UUU
a a a a c b
Strength of aftertaste 35.5 32.7 34.5 36.4 52.1 43.3 1.52
†
Significance of results calculated by ANOVA.
‡ Ž .
Scores without common superscripts within a horizontal line differ significantly P-0.01 according to Duncan’s test.
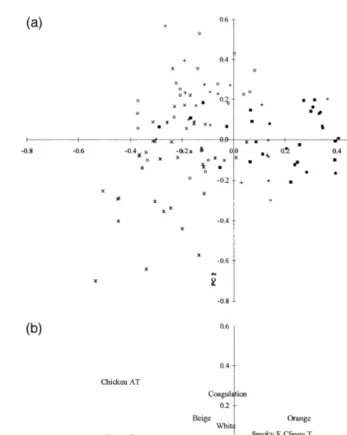
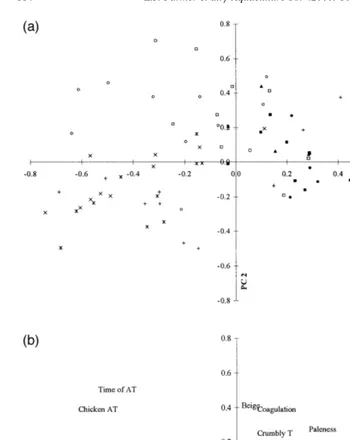
The results of PCA show which attributes gave the greatest discrimination between
Ž .
the mean scores for individual salmon Figs. 1 and 2; results for PC3 are not illustrated . For the 1993 salmon, PC1, PC2 and PC3 account for 34.6%, 16.4% and 9.5% of the variability, respectively; while, for the 1994 salmon, PC1, PC2 and PC3 account for 34.7%, 14.2% and 13.2% of the variability.
Table 4
Effect of salmon source on mean scores for eating quality attributes for salmon harvested during 1994. Scores
Ž .
are on a scale of 0 to 100 increasing intensity
†
Attributes Farm 1 Farm 2 Farm 3 Sea 1 Sea 2 River 1 River 2 River 3 Significance SEM
Odour
U
‡ b b ab ab b a ab a
Salmon-like odour 24.9 25.1 24.7 22.9 25.2 21.0 22.6 20.9 1.17
UUU
ab a ab ab ab c bc c
Earthy odour 27.8 25.8 26.8 27.2 27.7 32.0 30.0 33.8 1.24
UUU
a a a a a b a b
Stagnant odour 25.4 23.5 25.8 23.6 24.4 30.2 26.0 30.3 1.10
UUU
a a a a a a a b
Farmyard odour 20.8 20.2 19.2 20.5 23.4 23.5 22.7 29.8 1.48
UUU
c c c bc c ab bc a
Oily odour 27.1 26.6 27.1 25.7 26.4 23.1 25.1 21.6 0.92
Appearance
UUU
bc c c bc bc ab ab a
Juicy appearance 30.5 34.7 33.4 30.7 30.9 26.4 27.5 25.4 1.51
U
abc bc c abc abc ab ab a
Separation 28.0 28.4 29.8 27.8 26.4 25.6 25.9 24.8 1.05
UUU
a a a ab b c a ab
Coagulation 25.8 26.4 26.3 27.6 32.0 21.0 25.9 28.3 1.39
UU
a bcd bcd abc bcd ab cd d
Pink 13.4 16.9 16.9 16.3 17.6 14.6 18.4 19.7 1.00
U
b a ab ab a a ab a
Orange 21.5 15.6 18.6 18.2 16.6 15.1 17.9 16.8 1.31
UUU
abcd bcde abc cde de e ab a
Beige 22.1 24.2 22.0 26.0 26.1 26.5 21.4 19.1 1.24
UUU
bc c c bc bc bc ab a
Moist appearance 32.9 34.9 35.1 33.3 32.1 31.0 28.4 24.3 1.75
UU
a a a b a ab a a
Flaky 32.5 32.8 33.1 40.0 33.3 36.5 34.2 33.8 1.27
UU
c abc c a bc ab abc abc
Crumbly 30.3 29.0 30.5 24.8 29.2 24.9 26.5 28.5 1.31
FlaÕour
UUU
def ef f cde bcd a bc ab
Salmon-like flavour 28.7 30.6 31.1 26.6 26.0 18.6 24.4 22.3 1.22
UUU
bcd ab abc a ab d cd d
Earthy flavour 33.1 29.4 32.0 27.5 28.8 38.2 36.7 38.0 1.61
UUU
bc ab ab a ab d cd d
Farmyard flavour 25.7 21.8 23.7 20.0 22.6 32.3 29.9 30.7 1.48
U
bc abc abc a bc abc c ab
Salty flavour 20.5 19.5 19.2 17.6 20.5 20.0 20.7 18.1 0.74
U
b b b ab ab ab a a
Oily flavour 27.9 27.99 27.7 25.8 26.3 24.4 23.4 23.5 1.18
UUU
d cd cd abc bcd a ab a
Fishy flavour 25.0 23.5 24.3 21.4 22.6 18.6 20.2 19.5 0.93
UUU
abc ab c ab bc d a ab
Ž .
Fishy flavour skin 30.9 30.3 33.2 30.1 31.6 25.0 28.8 29.7 0.82
Texture
UUU
a a a b b b b b
Firmness 35.1 30.5 30.7 44.1 44.9 42.7 43.7 43.3 1.80
U
a ab ab b ab b ab ab
Flakiness 29.3 31.1 31.7 33.9 31.6 33.7 31.3 32.0 0.92
UUU
b b b a a a a a
Light texture 44.6 48.9 48.8 39.3 36.6 36.9 36.5 36.1 1.53
UUU
b b b a a a a a
Moist texture 35.4 38.7 37.1 27.9 26.3 25.7 25.0 26.2 1.77
UU
ab a a abc c bc bc bc
Chewiness 28.3 26.0 26.2 29.8 33.9 31.5 31.7 31.7 1.49
Aftertaste
UUU
bc bc bc d c a ab ab
Time when starts 14.4 15.7 15.2 22.6 18.4 10.1 12.6 12.1 1.27
UUU
ab a a a ab c bc c
Overall aftertaste 40.4 34.4 37.0 33.6 40.5 52.8 47.5 50.9 2.39
UUU
bc ab ab a ab d cd d
Earthy aftertaste 32.3 26.2 28.2 25.0 28.5 42.4 37.1 40.8 2.12
UUU
cde ab abc a bcd f ef def
Metallic aftertaste 27.6 22.3 24.5 21.4 26.2 32.5 30.4 29.8 1.24
UUU
b bc b c bc a a a
Chicken-like aftertaste 12.7 14.1 12.5 15.0 13.9 8.9 10.0 10.1 0.61
UUU
bcd d cd abc abc a ab a
Oily aftertaste 27.6 29.0 28.3 24.6 24.5 20.6 23.5 22.8 1.28
†
Significance of results calculated by ANOVA:
‡
Scores without common superscripts within a horizontal line differ significantly according to Duncan’s test; P-0.05 for salmon-like aroma, P-0.01 for all other attributes.
Ž .
Fig. 1. Principal components PC analysis of the mean profiling scores for salmon harvested during 1993
Ž . Ž . Ž . Ž .
showing PC1 and PC2 PC3 not illustrated . a Principal component scores for individual salmon scaled . b
Ž
Correlations of each attribute with principal component axes Asappearance, Tstexture, Osodour,
.
Fsflavour, ATsaftertaste .
Ž .
and did not account for any more of the variance not shown . Neither were any
Ž
significant correlations detected between these attributes and profiling attributes not
.
Ž .
Fig. 2. Principal components PC analysis of the mean profiling scores for salmon harvested during 1994
Ž . Ž . Ž . Ž .
showing PC1 and PC2 PC3 not illustrated . a Principal component scores for individual salmon scaled . b
Ž
Correlations of each attribute with principal component axes Asappearance, Tstexture, Osodour,
.
Fsflavour, ATsaftertaste .
Table 5
Effect of salmon source on the acceptability of salmon harvested during 1993. Scores are on a scale of 0 to 8
Ž1sextremely acceptable, 8sextremely unacceptable.
†
Acceptability of Farm 1 Farm 2 Farm 3 Sea 2 River 1 River 2r3 Significance SEM
‡
Odour 3.25 3.35 3.10 3.13 3.35 3.53 NS 0.201
U
a b ab ab ab b
Appearance 2.58 3.38 2.83 3.13 3.05 3.35 0.187
UU
a a a ab b ab
Flavour 3.43 3.35 3.13 3.68 4.33 3.70 0.228
Texture 3.33 2.78 2.83 3.33 3.25 3.38 NS 0.204
UUU
a a a ab b b
Aftertaste 3.20 3.08 3.10 3.68 4.28 4.18 0.224
UU
ab ab a abc c bc
Overall 3.40 3.35 3.08 3.78 4.15 4.05 0.224
†
Significance of results calculated by ANOVA: The non-parametric Kruskal–Wallis rank sum test produced identical levels of significance to the ANOVA with the exception of acceptability of flavour
ŽP-0.05 for Kruskal–Wallis, P-0.01 for ANOVA .. ‡
Scores without common superscripts within a horizontal line differ significantly according to Duncan’s test; P-0.05 for salmon-like aroma, P-0.01 for all other attributes.
U
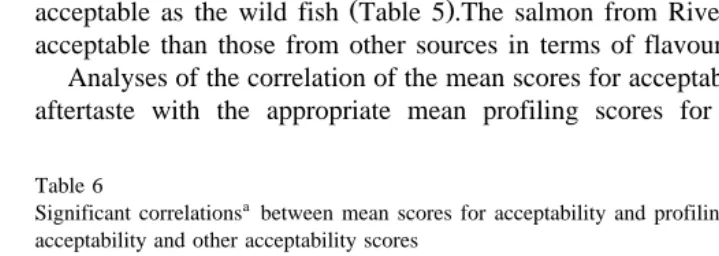
acceptable as the wild fish Table 5 .The salmon from River 1 were significantly less acceptable than those from other sources in terms of flavour and overall acceptability. Analyses of the correlation of the mean scores for acceptability of aroma, flavour and aftertaste with the appropriate mean profiling scores for each treatment gave the
Table 6
Significant correlationsabetween mean scores for acceptability and profiling attributes, and between overall
acceptability and other acceptability scores
b c a,d e
Attribute 1 Attribute 2 R Significance
U
Acceptability of flavour Salmon-like flavour y0.898
U
Earthy flavour 0.812
U
Acceptability of texture Moisture y0.818
U
Lightness y0.884
U
Acceptability of aftertaste Metallic aftertaste 0.833
U
Time when aftertaste starts y0.836
U
Strength of aftertaste 0.906
U
Acceptability of appearance Peach y0.834
U
Orange y0.839
U
Overall acceptability Acceptability of flavour 0.908
UU
Acceptability of aftertaste 0.969
a
Positive correlation between attributes is represented, in this case, by negative values of R, due to the fact that hedonic scales were used in which low scores were most acceptable.
b
Attribute 1sa hedonic scale for acceptability scored by an untrained panel.
c
Attribute 2sa profiling attribute, scored by a trained panel, except for the last two correlations, when further acceptability scales are used.
d
Pearson’s product moment coefficient.
e
Significance of R, using two-tailed table of critical values of Pearson’s product moments coefficient
ŽO’Mahoney 1986 ..
U P-0.05.
UU
Table 7
Mean eating quality attribute scores for fresh and frozen salmon analysed by ANOVA and Fisher’s LSD Test
a
Attribute Treatment Significance SEM
Frozen salmon Fresh salmon
Appearance
UUU
Juicy appearance 31.5 41.2 1.29
UUU
Separation 28.4 35.4 0.89
UUU
Moist appearance 31.2 41.1 0.84
FlaÕour
UUU
Oily flavour 21.6 26.8 0.87
Texture
Attributes for which a significant difference was detected by ANOVA.
U
correlation coefficients listed in Table 6. No evidence was found for curvilinear relationships between acceptability and profiling scores.
3.2. Effect of freezing on eating quality
For 24 of the 32 profiling attributes, there was no significant difference between frozen and fresh salmon. However, significant dfferences were found for the remaining
Ž .
8 attributes Table 7 . Most of these described the appearance and texture of the salmon. The only aspect of flavour altered by freezing was ‘oily flavour’, which was found to be reduced in the frozen fish.
Table 8
Mean eating quality attribute scores for salmon frozen for differing periods, analysed by ANOVA and Fisher’s LSD Test
f
Attribute Treatment Significance SEM
4–5 weeks 8–9 weeks 15–16 weeks 33–34 weeks
Appearance
U
a a a,b b
Separation 26.6 27.4 24.8 18.3 2.02
U
a a a,b b
Moist appearance 30.4 33.0 28.4 21.4 2.25
f
Attributes for which a significant difference was detected by ANOVA.
a,b Ž
Scores without common superscripts within a horizontal line differ significantly P -0.01; Fisher’s
.
LSD test .
3.3. Effect of length of frozen storage on eating quality
Thirty of the 32 eating quality attributes showed no significant change over 34 weeks of frozen storage. The two attributes affected by length of frozen storage refer to the
Ž .
appearance of the cooked salmon Table 8 . There were no significant effects of length of frozen storage on odour, flavour, aftertaste or texture.
4. Discussion
4.1. Freezing and frozen storage
For logistical reasons, all of the sensory analyses reported in this paper were conducted on salmon that had been frozen and stored for up to 24 weeks. For this reason, sensory studies were conducted to evaluate the effect of freezing and length of frozen storage on the eating quality of salmon, using profiling methods. The results
ŽTables 7 and 8 showed that a number of attributes relating to appearance and texture. Ž
were affected by freezing separation, juicy and moist appearance, tenderness and moist,
. Ž
light and springy texture and by length of frozen storage separation and moist
.
appearance . The loss of juiciness and increase in toughness of fish observed on freezing
ŽTable 7 is well known and is believed to be due to changes in the muscle proteins. ŽMackie, 1993 . The nature and causes of these changes have been reviewed by.
Ž . Ž .
Shewfelt 1981 and Mackie 1993 . The decreases in juicy and moist appearance, and in separation, also observed on freezing, are likely to be a consequence of a reduction in water holding capacity arising from protein damage. Likewise, the further changes in moist appearance and separation detected during prolonged frozen storage would have
Ž .
been caused by continued denaturation of the surface proteins Mackie, 1993 , but this
Ž .
was not sufficient to cause further textural changes Table 8 . Thus, the results reported in this paper for the texture and appearance of the frozen fish do not necessarily reflect those which would have been obtained for fresh salmon.
In contrast, the only aspect of flavour that was affected by freezing was oily flavour, which was found to receive higher scores for the fresh fish; length of frozen storage had no significant effect on flavour. Therefore, it is probable that the results for the profiling of odourrflavour attributes for frozen salmon are closely related to those which might have been obtained for fresh fish.
The salmon used to examine the effect of length of frozen storage were harvested during a period from August to February. As the eating quality of salmon may be
Ž .
4.2. Principle components analysis
The main effects of source and environment on the eating quality of salmon are
Ž .
illustrated by the results of PCA on the profiling data Figs. 1 and 2 . Although the variance explained by the first two principle components is rather small, the results for the salmon harvested during the two seasons show many similarities. In both cases, the mean values for salmon from each source tend to occupy the same region of the PCA
Ž . Ž
plot Figs. 1a and 2a . Furthermore, fish from similar types of salmon source i.e.
.
river-wild, seawild and sea-farmed are grouped together. For example, the river fish
Žsolid shapes all tend to be positive with respect to PC1, the wild sea-caught salmon. Žopen shapes are often negative on PC1, but positive on PC2, while the sea-farmed fish. Žstar shapes tend to be negative on both axes. Thus, sensory differences between source.
types are greater than those within them. Comparison of Figs. 1a and 2a with 1b and 2b, respectively, illustrates the relationship between salmon types and sensory profiling attributes.
For both 1993 and 1994, PC1 largely comprises descriptors relating to earthy descriptors and other aroma and flavour attributes and tends to differentiate between
Ž .
river and sea fish whether wild or farmed . During both seasons, PC2 relates mainly to
Ž
aspects of texture although appearance, time of aftertaste and the earthy attributes are
.
also included and partially differentiates between wild and farmed sea-caught salmon, especially those captured during 1994. PC3 discriminates between salmon on the basis
Ž .
of colour peach, orange colour versus paleness and beige , but does not differentiate
Ž .
between source types results not illustrated . Thus, the attributes causing the greatest sensory differences between salmon were consistent over the two seasons studied.
The inclusion of length of frozen storage for individual fish in a PCA did not indicate any relationship between this factor and sensory profiling scores, supporting the above
Ž .
results Table 8 , that extended frozen storage had little effect on sensory quality, and suggesting that this factor was not important for salmon eating quality in this study.
The trends illustrated in Figs. 1 and 2 are supported by the sensory data for specific
Ž .
eating quality attributes Tables 3 and 4 . The effects of salmon source on the sensory scores are discussed under the headings of aroma, flavour and aftertaste, texture and appearance.
4.3. Aroma, flaÕour and aftertaste
Ž .
As illustrated by the results of PCA Figs. 1 and 2 , the main differences in aroma and flavour attributes were not between wild and farmed salmon, but between river and
Ž .
sea-caught fish whether wild or farmed . Earthy odour, flavour and aftertaste were
Ž .
higher in the river-caught fish than in the sea-caught fish Tables 3 and 4 . During the 1993 trial, River 1 salmon, in particular, received higher scores for these earthy attributes than salmon from Rivers 2 and 3, which were, in turn, more earthy than the other four sources. During 1994, similar scores for these attributes were obtained for salmon from all three rivers. Earthy and muddy off-flavours in drinking water and in fish, especially those from freshwater, are commonly caused by the compounds, geosmin and 2-methylisoborneol. Their occurrence and origin have been extensively
Ž .
Ž .
by actinomycetes and various species of blue-green algae Slater and Blok, 1983 .
Ž .
Analytical studies Mitchell and Farmer, unpubl. data found geosmin to be present in river-caught salmon at up to 1.26mg kgy1, while 2-methylisoborneol was not detected
Ž- y1.
0.2 mg kg . These concentrations of geosmin are higher than the odour threshold
Ž .
for this compound in fish Persson, 1980 and, therefore, geosmin is likely to be the primary cause of the earthy attributes detected in these salmon.
The scores for other undesirable aroma and flavour attributes were elevated for salmon from some river sources. The scores for stagnant odour were significantly higher in salmon from River 1 than all other sources in 1993, and for salmon from River 3 in 1994. The River 1 fish were also subject to a short-lived off-flavour incident during one week in July 1993; a manure-like, farmyard odour was detected which rendered the fish
Ž
unpalatable. This was found to be caused by elevated levels of skatole Farmer et al.,
.
1995 . Exclusion of the four affected fish from the statistical analyses did not materially affect the overall results and these data are included in Table 3 and Fig. 1. Farmyard odour and flavour were monitored during the 1994 trial; however, although scores for these attributes were elevated for salmon from all the rivers, no specific incident occurred such as that experienced during 1993.
Salmon-like odour and flavour were most intense in the farmed salmon, with the lowest scores being received for the river-wild fish. Indeed, scores were significantly higher in salmon from some farmed sources than some sea-wild fish. It is possible that the panellists were more familiar with the flavour of farmed salmon and that this affected their definition of this attribute. However, the panellists were subjected to a long period of training to familiarise them with the characteristics of salmon from all sources. It is more likely that, in the river-fish, the salmon-like aroma and flavour were, to some extent, masked by the relatively high earthy odour and flavour as observed by
Ž .
Bett and Johnsen 1996 . It has been shown that the aroma and flavour of farmed
Ž
Atlantic salmon become less intense as maturation progresses Asknes et al., 1986;
.
Blokhus, 1986 . However, these changes occur after the skin colour has changed from
Ž
silver to brown and at the same time as the underjaw changes shape Asknes et al.,
.
1986 . The salmon used in this study did not show any visible signs of maturation in terms of altered shape or colour of the whole fish. It has also been suggested that the aroma and flavour of river salmon may be reduced due to the depuration of important
Ž .
flavour compounds on entering freshwater Boyle et al., 1992 and that the balance of odour compounds in raw freshwater fish is altered due to metabolic changes and their
Ž . Ž .
effect on lipid breakdown Josephson et al., 1984 . In contrast, Ostrander et al. 1976 did not detect any consistent differences in flavour between saltwater and freshwater farmed Pacific salmon. Further studies on the compounds responsible for the flavour of salmon are required to establish which of these mechanisms is the main cause of the flavour differences between sea and freshwater salmon in this region.
Ž .
Laverty 1993 advises that the bleeding of fish is generally recommended as blood can give a strong metallic taste, although no quality differences were detected between bled and unbled farmed trout. In this study, only salmon from Farm 1 were bled on
Ž .
slaughter. The mean scores for metallic aftertaste Tables 3 and 4 are not reduced for salmon from this source. Instead, metallic aftertaste is highest in the river fish and is
Ž .
removal of iron resulting from bleeding reduces lipid oxidation. Again fish from Farm 1 did not show any differences in, for example, oily or fishy aroma or flavour which could
Ž .
be attributed to this practice. These results agree with those of Laroche et al. 1995 who found that bleeding did not affect the odour or flavour of carp fillets.
The data from the 1994 season show that oily aroma, flavour and aftertaste were consistently highest in the farmed fish and lowest in the river salmon, with the sea-wild sources receiving intermediate scores. However, there were no significant differences between the sources of wild and farmed sea-caught salmon in these attributes. These data do not reflect the lipid content of the fish; some of the sea-wild fish tended to have the highest lipid content, with farmed and river-wild containing lesser amounts of lipid
ŽFarmer et al., 1997 . As oily flavour was reduced by freezing Table 7 , it is possible. Ž .
that a similar comparison using fresh fish may emphasize any differences in oily characteristics between wild and farmed sea-caught salmon.
No significant differences were observed in fishy flavour in 1993, but in salmon caught during the 1994 season, some differences were observed; the highest scores tended to be received by the farmed salmon and the lowest by the river-wild fish. Fishy odours can develop when fish is stored for long periods or under inadequate conditions. Such odours may be due to trimethylamine or dimethylamine, formed in marine fish from trimethylamine oxide by the action of microbial or endogenous enzymes,
respec-Ž .
tively Lindsay, 1988 . In addition, the compounds trans,cis,cis- and trans,trans,cis-2,4,7-decatrienal cause unpleasant fishy odours which are formed by autoxidation of
Ž . Ž .
long-chain n–3 fatty acids Lindsay, 1991 . Skonberg et al. 1993 found that coho
Ž
salmon and trout fed a diet including herring oil had a more fishy aroma and flavour in
.
the salmon than those where the oil was sunflower oil enriched in oleic acid. It was proposed that an increase in monounsaturated fatty acids decreases the risk of oxidative
Ž .
rancidity, although the fatty acids in the fish were not analysed Skonberg et al., 1993 . This is possible as a higher concentration of the long chain n–3 fatty acids derived from the herring oil could act as precursors for the 2,4,7-decatrienals discussed above. However, in the study described herein, no correlation was observed between scores for
Ž
fishy attributes and the overall content of any fatty acid or group of fatty acids Farmer
.
et al., 1997 . Indeed, overall fatty acid composition offered no explanation for any of the differences in perceived flavours or odours for the salmon harvested during 1994
ŽFarmer et al., 1997 , despite the fact that many important flavour compounds are.
derived from fatty acid precursors. Furthermore, there was no evidence of any relation-ship between frozen storage time and flavour or odour attributes, by either correlation or
Ž .
PCA not shown . It is, therefore, likely that flavour development in salmon depends on other factors, such as the fatty acid composition of the membrane phospholipids, the formation of free fatty acids, the amount and nature of antioxidants present or differ-ences in enzyme activity.
Hedonic scaling experiments on the acceptability of 1993 salmon, using an untrained panel, showed that the river fish tended to be less acceptable than sea-caught fish in
Ž .
Ž .
harvested from the sea Tables 3 and 4 and that salmonlike flavour was even slightly higher in salmon from farmed sources than in some of the sea-wild fish. These results counter the widespread belief that wild salmon have a superior flavour to that of farmed
Ž .
fish. The data reported herein contrast with those of Sylvia et al. 1995 , who reported
Ž .
that wild Pacific chinook salmon possess a more ‘delicate, fresh fish flavour’ than their
Ž
farmed counterparts; but these data agree with other studies Bartos, 1989; Higgs et al.,
.
1989 that the flavour of farmed salmon is at least as good as that of the wild fish.
Ž .
Similar results were obtained for lagoon-reared wild and farmed sea bream: there were
Ž .
no differences in the odour or flavour of the cooked fish Orban et al., 1997 .
Ž .
Correlation coefficients Table 6 indicate that acceptability of flavour was related to salmon-like flavour and lack of earthy flavour. An examination of the data showed that these correlations were due to the high earthy flavour and low salmon-like flavour of
Ž .
one treatment River 1 ; no correlation was observed for the other treatments. In contrast, the acceptability of aftertaste showed consistent correlation with the mean profiling scores for strength of aftertaste, time when aftertaste starts and metallic aftertaste. No significant correlation was observed for aroma attributes. It has been suggested that the relationship between acceptability scores and profiling scores is
Ž .
curvilinear rather than linear Moskowitz, 1981 . However, none of the correlations tested in this study showed any evidence of curvilinear relationships. Overall acceptabil-ity of the cooked salmon was significantly correlated with the scores for acceptabilacceptabil-ity of
Ž .
aftertaste and flavour Table 6 , suggesting that the above mentioned attributes were particularly important for the overall acceptability. The acceptability of salmon from different sources may reflect the previous experience of the panellists. For instance, it is possible that, for anglers and others accustomed to eating river-caught salmon, a slightly earthy flavour is a desirable and characteristic attribute of these fish. However, cus-tomers used to eating sea-caught wild or farmed salmon may be less likely to accept these attributes.
4.4. Texture
In contrast to flavour, the texture of the cooked salmon differed between wild and
Ž . Ž .
farmed salmon Tables 3 and 4 . Two of the farmed sources Farms 2 and 3 , and to a
Ž .
lesser extent the third Farm 1 consistently received the highest scores for moist, light and tender textures, whereas the wild fish received the highest scores for firmness and
Ž .
chewiness Tables 3 and 4 . These effects were significant in comparison with at least some of the other sources and were particularly pronounced during the 1994 season.
The study conducted on the acceptability of salmon harvested during 1993 did not demonstrate any significant differences in the acceptability of texture, although salmon from Farms 2 and 3 received the most acceptable scores. If a similar study on acceptability had been conducted on the 1994 salmon, when the differences in texture were greater, it is possible that significant differences may have been observed. Given
Ž .
the differences in texture between fresh and frozen salmon Table 7 , it would also be desirable to repeat the acceptability study using fresh salmon. Nevertheless, the accept-ability of texture was found to be significantly correlated with the mean scores for light
Ž .
Ž
In contrast to the above profiling results, various authors e.g. Higgs et al., 1989;
.
Sylvia et al., 1995 have reported that there is no significant difference in texture
Ž .
between wild and farmed salmon. One of these studies Sylvia et al., 1995 used fresh, unfrozen fish, unlike the work reported herein, but the work reported by Higgs et al.
Ž1989 was also performed on frozen fish. Studies on other fish species have shown.
differences in texture between wild and farmed fish. In red sea bream the muscle of wild
Ž . Ž .
fish was found to be harder Aoki et al., 1991 and preferred Hatae et al., 1989 to that
Ž .
of the cultured fish, although this was not true for all species Aoki et al., 1991 . Orban
Ž .
et al. 1997 found that the meat from farmed sea bream was more juicy, greasy and less fibrous than that of the wild fish; this was attributed, in part, to the much higher lipid content of the farmed fish.
In contrast to the results for flavour, there were no significant differences between wild fish captured in the sea and river for texture attributes. These results agree with
Ž .
those of Ostrander et al. 1976 , who found that salt versus fresh water had no significant effect on the texture or moisture of farmed Pacific salmon species, as measured by hedonic scaling methods.
A difference in texture may be caused by a range of factors. Activity has been found to affect the softening of the flesh after slaughter: softening occurred more slowly in red sea bream subjected to additional swimming exercise compared with non-exercised fish
Ž .
and in wild bream compared with cultured fish Tachibana et al., 1988 . Other studies have shown that fish allowed to struggle prior to death gave flesh with a softer texture
Ž
during the first few days of chilled storage than that of anaesthetized fish
Izquierdo-. Ž .
Pulido et al., 1992 . Asknes et al. 1986 has reported that the texture of farmed Atlantic salmon deteriorates on maturation, becoming watery and tough. However, as for flavour, these changes were only significant in October, 2 months after the first visible signs of maturation were observed.
A possible cause of the texture differences observed in this study between wild and
Ž .
farmed salmon may be suggested by the PCA results Figs. 1 and 2 . Sea-wild and sea-farmed salmon are partially differentiated by PC2, which is composed primarily of texture attributes. It may be observed that this differentiation is greater in 1994 than
Ž
1993, and that this is due to a ‘movement’ of farmed salmon especially those from
.
Farm 1 from the upper to the lower left quartile of the plot. Discussion with the farms concerned indicated that, while Farms 2 and 3 had used the same feed during 1993 and 1994, Farm 1 had increased the oil content of their feed in 1994. This suggests that the light, moist texture of the farmed fish may be influenced by dietary factors. Further studies are needed to determine which texture attributes are most acceptable and to establish how rearing conditions affect them.
4.5. Appearance
The amount of juice seeping out of the cooked salmon was termed ‘juicy appearance’ by the panellists, while the visible oil in these juices was termed ‘separation’. ‘Moist appearance’ referred to the cut surface of the cooked salmon. Separation, moist and
Ž .
sources, received higher scores for separation than most of the river salmon. Farm 3 salmon also received higher scores for moist appearance in 1993; while, in 1994, salmon from River 3 were perceived as appearing significantly less moist than all other sources. Farmed salmon received significantly higher scores for juicy appearance than river salmon in the 1994 study. These effects may have been caused by the generally higher lipid content of the farmed fish. However, Sea 1 salmon contained the most lipid of all the sources and Sea 1 and Sea 2 salmon, which contained widely differing amounts of
Ž y1 .
total lipid 136 and 68 mg g , respectively; Farmer et al., 1997 received similar scores for these attributes. It is possible that the type of lipid used in the diets for farmed fish may affect these measures of appearance.
The flesh colour of the cooked salmon also differed widely between sources. Farmed salmon from Farm 1 exhibited a significantly more intense peach colour than four of the remaining five sources examined in 1993 and a more orange colour in 1994. Pink colour also differed between sources in the 1994 trial. Lower scores for pink, orange andror
Ž .
peach colour were observed for some wild sources Tables 3 and 4 . These differences may be attributed to the amount and type of pigmentation in the diet. Wild salmon obtain the pigment astaxanthin from marine crustaceans, while astaxanthin, or the synthetic pigment, canthaxanthin, is incorporated in the diet of farmed salmon to give the desired flesh colour. Thus, the differences in colour between the farmed sources is likely to be caused by the diets used. The differences in colour between the wild sources must be determined by the availability of crustacea in coastal waters.
Ž .
Laroche et al. 1995 found that the appearance of cooked carp was affected by whether or not the fish were bled at slaughter: bled fish were darker, more pink and less homogeneous in colour. Salmon from Farm 1 had the lowest scores for pink colour, and
Ž .
the highest scores for peach and orange colours Tables 3 and 4 . It is not possible to judge whether the bleeding of salmon from Farm 1 contributed to these differences in appearance.
The salmon from Farm 1 received the most favourable scores for acceptability of
Ž .
appearance, as determined by hedonic scaling studies Table 5 , and acceptability of appearance was significantly correlated with the mean scores for peach and orange
Ž . Ž .
colour Table 6 . These data support the view Sigurgisladottir et al., 1994 that additional pigmentation improves acceptability.
5. Conclusion
These results show that marked differences in the eating quality of salmon occur between fish from different environments. However, salmon from the same source type
Žriver-wild, sea-wild or farmed tend to possess similar sensory attributes. The main.
differences in flavour occur between river and sea-caught salmon, while wild and farmed salmon differed in terms of texture and appearance. An untrained panel found that the farmed salmon were at least as acceptable as wild salmon in terms of appearance, odour, flavour, texture, aftertaste and overall acceptability.
not aim to investigate these individual factors, but a number of avenues have been suggested for further research of both scientific and commercial interest. In particular, the relationship between individual sensory attributes and consumer acceptability should be clarified for both fresh and frozen salmon, and for different groups of consumers. The role of dietary oil composition on the appearance, texture and flavour of farmed fish should be evaluated. In addition, research is needed to establish the chemical and biochemical factors that influence the generation of key flavour compounds in cooked salmon. An understanding of these matters would facilitate the optimisation of eating quality in farmed salmon.
Acknowledgements
Funding from the EU Interreg Initiative and the Department of the Environment for Northern Ireland — Environment Service is gratefully acknowledged. The authors also wish to thank Mr. Terence Hagan, Mrs. Diane Rea and Mr. Conrad Gibbons for assistance with the preparation and sensory analysis of the salmon, Mr. Alan Gordon for the statistical analyses, staff of the Aquatic Sciences Section for the assessment of the age of the salmon, the sensory panellists and the numerous people whose cooperation facilitated the procurement of both farmed and wild salmon.
References
w x
Aoki, T., Takada, K., Kunisaki, N., 1991. Bull. Jpn. Soc. Sci. Fish. 57, 1927–1934, from English abstract . Asknes, A., Gjerde, B., Roald, S.O., 1986. Biological, chemical and organoleptic changes during maturation of
farmed Atlantic salmon, Salmo salar. Aquaculture 53, 7–20.
Bartos, G.E., 1989. A comparison study of the physicochemical and sensory properties of four salmon types, based on method of cultivation. Master of Science Thesis, Pennsylvania State University, College Station, PA.
.
Bett, K.L., Johnsen, P.B., 1996 . Challenges of evaluating sensory attributes in the presence of off-flavours
Žgeosmin and 2-methylisoborneol . J. Sens. Stud. 11, 1–17..
( )
Blokhus, H., 1986. Aspects related to quality of farmed Atlantic salmon Salmo salar . In: Kramer, D.E.,
Ž .
Liston, J. Eds. , Seafood Quality Determination. Elsevier, Amsterdam, pp. 615–628.
Boyle, J.L., Lindsay, R.C., Stuiber, D.A., 1992. Bromophenol distribution in salmon and selected seafoods of fresh and saltwater origin. J. Food Sci. 57, 918–922.
Cochran, W.G., Cox, G.M., 1957. Experimental Designs. 2nd edn. John Wiley, New York.
Farmer, L.J., McConnell, J.M., Graham, W.D., 1997. Flavor characteristics and lipid composition of Atlantic salmon. In: Proceedings of the ACS Meeting on Flavor and Lipid Chemistry of Seafood, Orlando, USA, August 1996. pp. 95–109.
Farmer, L.J., McConnell, J.M., Hagan, T.D.J., Harper, D.B., 1995. Flavour and off- flavour in farmed and wild Atlantic salmon from locations around Northern Ireland. Water Sci. Technol. 31, 259–264. Haard, N.F., 1992. Control of chemical composition and food quality attributes of cultured fish. Food Res. Int.
25, 289–307.
Hatae, K., Lee, K.H., Tsuchiya, T., Shimada, A., 1989. Textural properties of cultured and wild fish meat.
w x
Bull. Jpn. Soc. Sci. Fish. 55, 363–368, from English abstract .
Izquierdo Pulido, M.L., Hatae, K., Haard, N.F., 1992. Nucleotide catabolism and changes in texture indices during ice storage of cultured sturgeon, Acipenser transmontanus. J. Food Biochem. 16, 173–192. Josephson, D.B., Lindsay, R.C., Stuiber, D.A., 1984. Variations in the occurrences of enzymically derived
volatile aroma compounds in salt- and freshwater fish. J. Agric. Food Chem. 32, 1344–1347.
Laroche, M., Rousseau, F., Dumont, J.P., 1995. Relations entre les resultats d’analyse sensorielle et de mesures instrumentales pour les filets de carpe. La Pisciculture Francaise 121, 22–26.
.
Laverty, J., 1993 . Postharvest conditions for maximising quality. Trout News 17, 23–28.
Lindsay, R.C., 1988. Fish flavors. In: A partnership of marine interests. IROC Oceans ’88. pp. 61–65. Lindsay, R.C., 1991. Chemical basis of the quality of seafood aromas and flavors. Mar. Technol. Soc. J. 25,
16–22.
MacFie, H.J., Bratchell, N., Greehoff, K., Vallis, L.V., 1989. Designs to balance the effect of order of presentation and first-order carry-over effects in hall tests. J. Sensory Studies 4, 129–148.
Mackie, I.M., 1993. The effects of freezing on flesh proteins. Food Rev. Int. 9, 575–610.
Moskowitz, H.R., 1981. Relative importance of perceptual factors to consumer acceptance: linear vs. quadratic analysis. J. Food Sci. 46, 244–248.
O’Mahoney, M., 1986. Sensory Evaluation of Food — Statistical Methods and Procedures. Marcel Dekker, New York
Orban, E., Sinesio, F., Paoletti, F., 1997. The functional properties of proteins, texture and the sensory
( )
characteristics of frozen sea bream Sparus aurata from different farming systems. Lebensm.-Wiss.
Technol. 30, 214–217.
Ostrander, J., Martinsen, C., Liston, J., McCullough, J., 1976. Sensory testing of pen-reared salmon and trout. J. Food Sci. 41, 386–390.
Persson, P.-E., 1980. Sensory properties and analysis of two muddy odour compounds, geosmin and 2-methylisoborneol, in water and fish. Water Res. 14, 1113–1118.
( )
Prescott, J., Bell, J.D., 1992. Sensory evaluation of Australian snapper Pagrus auratus raised in captivity. ASEAN Food J. 7, 111–113.
.
Shewfelt, R.L., 1981 . Fish muscle lipolysis — a review. J. Food Biochem. 5, 79–100.
Sigurgisladottir, S., Parrish, C.C., Lall, S.P., Ackman, R.G., 1994. Effects of feeding natural tocopherols and
( )
astaxanthin on Atlantic salmon Salmo salar fillet quality. Food Res. Int. 27, 23–32.
Skonberg, D.I., Rasco, B.A., Dong, F.M., 1993. Effects of feeding high monounsaturated sunflower oil diets on sensory attributes of salmonid fillets. J. Aquat. Food Prod. Technol. 2, 117–133.
Skrede, G., Storebakken, T., 1986. Characteristics of colour in raw, baked and smoked wild and pen-reared Atlantic salmon. J. Food Sci. 51, 804–808.
Slater, G.P., Blok, V.C., 1983. Volatile compounds of the Cyanophyceae — a review. Water Sci. Technol. 15, 181–190.
Stone, H., Sidel, J., Oliver, S., Woolsey, A., Singleton, R.C., 1974. Sensory evaluation by quantitative descriptive analysis. Food Technol. 28, 24–34.
.
Sylvia, G., Morrisey, M.T., Graham, T., Garcia, S., 1995 . Organoleptic qualities of farmed and wild salmon. J. Aquat. Food Prod. Technol. 4, 51–64.
Tachibana, K., Doi, T., Tsuchimoto, M., Misima, T., Ogura, M., Matsukiyo, K., Yasuda, M., 1988. Improvement of flesh texture in cultured red sea bream: I. Effect of swimming exercise on flesh texture of
w x