IMAGE PRE-PROCESSING FOR OPTIMIZING
AUTOMATED PHOTOGRAMMETRY PERFORMANCES
G. Guidi*, S. Gonizzi, L.L. Micoli
Department of Mechanical Engineering, Politecnico di Milano, via la Masa 1, 20156, Italy (gabriele.guidi, sara.gonizzi, laura.micoli)@polimi.it
Commission V, WG4
KEY WORDS: Automated Photogrammetry, SFM, Image Matching, Polarizing filter, HDR, Tone mapping, Shiny materials, Dark materials, Cultural Heritage, image-based modeling performances.
ABSTRACT:
The purpose of this paper is to analyze how optical pre-processing with polarizing filters and digital pre-processing with HDR imaging, may improve the automated 3D modeling pipeline based on SFM and Image Matching, with special emphasis on optically non-cooperative surfaces of shiny or dark materials. Because of the automatic detection of homologous points, the presence of processing with tone mapping, with experimental evaluation on different Cultural Heritage objects characterized by non-cooperative optical behavior. Three test images of each object have been captured from different positions, changing the shooting conditions (filter/no-filter) and the image processing (no processing/HDR processing), in order to have the same 3 camera orientations with different optical and digital pre-processing, and applying the same automated process to each photo set.
*
Corresponding Author
1. BACKGROUND 1.1 Photogrammetry with polarizing filters
Light is generally idealized as a sequence of photons, each one representing a short piece of electromagnetic wave. The direct sunlight has an orientation randomly varying, therefore is not polarized, but the light coming from the blue sky (i.e. reflected from the water molecules suspended in air), is characterized by a specific orientation determined by the dipole structure of water (H2O). When looking at such light from a direction at right angles with respect to the sun rays, such polarization is maximized and a polarizing filter, if rotated orthogonally to the polarizing orientation, will filter out the polarized component of skylight darkening the sky. The landscape below it and the clouds, will be less affected, giving an image with a darker and more dramatic sky, emphasizing the contrast with the clouds (Goldberg, 1992). Although such use of polarizing filters is well known from the very early stages of photography as a way for reducing the strong sky luminance or for eliminating reflections from glasses or stretches of water (Feininger, 1954), only few works have been published about the use of filtering with polarizers in photogrammetry. In aerial applications (Paine et al., 2012) have demonstrated that polarizing filters improve imaging on water and allow to penetrate haze, while in close-range photogrammetry they have been used for precise detection of shiny aluminum structures and retroreflective targets in aerospace industry (Wells et al., 2005).
For overcoming this problem High Dynamic Range (HDR) imaging has been developed starting from the late ‘90s. In this case multiple photographs with different exposure times are combined into a radiance map, which reflects the radiance in real-life scenes. The technique (Debevec and Malik, 1997), is based on multiple shots of a scene from the same position with exposure bracketing. If the images are taken at 8 bit per component (e.g. like when a jpeg output is chosen), 7 shots taken at 1 stop of difference (i.e. -3, -2, -1, 0, +1, +2, +3) are required for an optimal result (Barakat et al. 2008). From the integer RGB components of each image a floating point luminance can be estimated through different algorithms (Mann and Picard 1995, Debevec and Malik 1997, Robertson et al. 1999, De Neve 2009), generating luminance values ranging from 10-4 to 108. However, current Digital Single Lens Reflex (DSLR) cameras allow to store images in raw mode, saving the whole 12 or 14 bits of information for each RGB channel that the camera is capable to acquire. In this case the 7 eight bit shots can be substituted by 3 “richer” shots spaced 2 stops apart (-2, 0, +2), producing nearly the same result (Barakat et al., 2008).
The opportunity to work with HDR images has never been systematically exploited in photogrammetry, and no image-based modeling package is nowadays capable to process directly HDR radiance maps. However the process can be applied to 8 bit jpegs resulting from the tone mapping of floating points HDRs. Tone-mapping operators may compress the dynamic range of images by applying the same function to all pixels, or they may compress pixels based on their value and the values of a local neighborhood of pixels. As a practical result, details hidden in the brightest and darkest areas of each image due to clipping to the maximum (255, 255, 255, or white) and the minimum (0, 0, 0, or black) can be shown, allowing laboratory experiment (Cai 2013) an application to roadway environments (Cai and Li 2014) and a general analysis for applications to strongly different illuminated Cultural Heritage structures (Ntregka et al, 2013).
What is instead usually applied in traditional photogrammetric applications for trying to enhance details in the darker and lighter areas of images is the Wallis filter. It is a digital processing function applied to the captured image that locally enhances the contrast levels, and is often applied in order to optimize images for subsequent image matching (Balstavistas, 1991). As the HDR processing, the Wallis filter works on the image luminance (not on colors) and its purpose might seem similar giving in general very good results with much less effort than HDR (Jazayeri and Fraser, 2008). However, it has to be noticed that the processing is applied to LDR images, and, if some details are hidden due to light intensity on the scene lower to the minimal recordable value or higher than saturation like with the very difficult materials that we are considering in this paper (e.g. an area of the luminance image containing an highlight, represented by a matrix of pixels all set to 255), no information can be re-extracted with any filtering. HDR processing overcomes this problem, operating somehow before this stage, saving the whole dynamic content of the image. In an ideal processing pipeline these two processes (HDR and Wallis filtering) could be even applied in a sequence, operating at different points of the whole process.
2. PURPOSE OF THIS WORK
Automated photogrammetry packages providing dense clouds of 3D points are everyday more diffused in both professional and research applications due to their capability of reducing the processing time, giving as results texturized 3D models with a relatively small effort, whose accuracy and precision level is satisfactory for many applications such as 3D imaging on Cultural Heritage (Fassi et al., 2013).
This category of programs are based on the approach known as structure from motion (SFM). The extraction and matching of features are usually carried out with the SIFT detector. Subsequently the external image parameters are solved by a bundle adjustment, providing both orientations and calibrations of the various images. Finally the imaged are matched generating a dense cloud of 3D colored points (González-Aguilera et al., 2012; Remondino et al., 2013). However not many settings are available for the operator since most of the process is automatic. It was decided to experiment the use of image pre-processing for gaining information in the brighter and darker areas of images devoted to image matching, both with optical means (i.e. the of polarizing filters) and digital means (i.e. HDR and tone mapping), with the purpose of facilitating the automatic orientation process and the following image matching, testing the results with real Cultural Heritage objects typically difficult to be captured with automatic photogrammetry procedures due to their shiny behavior.
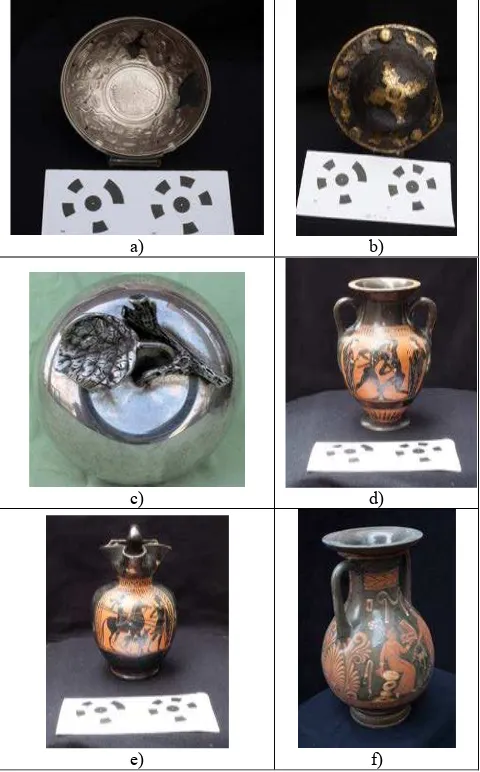
The automated photogrammetry package used in this study was AGISOFT Photoscan and the point clouds generated by this software were compared numerically among each other to see the difference in terms of number of matched points with and without the analyzed pre-processing, for the same image orientation. For such comparison purpose it was decided not to complete an entire 3D acquisition, but just orient and match a minimal number of images for comparing the effects of the different pre-processing analyzed. This minimal number has been arbitrarily set to three. “patera”. It has a diameter of 17 cm and seemed to be a perfect object for this test due to its shiny surface in addition to its decoration with a lot of little details in relief; ii) a Mediaeval metal plate decorating a shield (“umbo”). The umbo chosen for the test (Fig. 3b) is made of metal with bronze plates decorating the flat part all around the objects and the tip of it.; iii) a silver box shaped as an apple, with the body close to a perfectly reflective surface with the exclusion of a few oxidation, and a more opaque leaf in the upper its side; iv) two dark and shiny Greek vases; iv) an Etruscan jug (“olpe”). Those object belongs to the Archaeological Museum of Milan (MAM) and to a private collection. The choice of such specific objects was determined by their dark and/or reflective surfaces generating highlights and dark areas.
2.2 Survey plan
The survey for acquiring the images for photogrammetry was organized as in Fig. 1: the test objects were placed on a table with a monochromatic background. Three different camera positions (left, centre, right) were chosen, from which sets of three raw images have have been acquired. The first set without the filter and the second one with it, mounted on the lens and properly rotated for minimizing the highlights on the object surface.
Figure 1. Set arrangement for the photogrammetric survey.
In front of the objects two coded targets at a known distance were placed to scale the point clouds after the processing. The set was placed on the footpath right outside the Museum in order to use the natural light. The shot were done during a cloudy day to avoid more reflections due to the sunlight. In this way, it was possible to use the same image for the processing with and without the filter, also with HDR images, so that the condition of light didn’t change and the images were similar for each position. The camera used was a full frame CMOS sensor Canon 5D Mark II of 21 megapixel coupled with a 50 mm lens, placed on a tripod. The parameters of the shots were: ISO 200, the aperture on f/32 to have the maximum depth of field, manual focusing and the exposure controlled so that with the filter mounted on, the difference was always of 1.5 stop in respect to the images without the filter. The mean distance between the camera and the objects was around 70 cm. The dimensions of the images were 5616x3744.
3. ACQUISITION AND PROCESSING
As mentioned above the camera positioning was the same for each object. Two set of three images were shot from each position, the first without the and the second with the polarizing filter mounted on the lens. All images were acquired in raw mode in order to maintain all the 14 bit of information per RGB component. The three 14 bit LDR images were merged afterwards in the lab through a commercial HDR package (Photoshop by Adobe software, function “merge to HDR Pro”) in a single 32 bit HDR image. Each HDR was then tone mapped to an 8 bit image. This step is potentially critical since several mapping approach have been developed such as “Local Adaptation”, “Equalize Histogram”, “Exposure and Gamma” and “Highlight Compression” (Venkata Lakshmi, 2012). We chose “Equalize Histogram” being the process that allows to locally enhance the image contrast. In addition the other possible mappings have several possible input parameters that would have complicated the results comparison.
The Ground Sampling Distance (GSD) was kept below 0.11 mm. Specifically the different objects represented in fig. 3
where captured at an distance/GSD reported in the following table. Being object not flat these figures represent just average values.
Shooting distance (cm)
Average GSD (µm)
Patera (fig 3a) 80 102
Umbo (Fig 3b) 51 65
Apple (Fig. 3c) 58 74
Greek vase (Fig. 3d) 69 88
Etruscan Olpe (Fig. 3e) 74 95
Greek vase (Fig. 3f) 66 85
Table 1. Shooting distances and average GSDs.
For the data processing Agisoft Photoscan was used because of its massive and successful usage for 3D modeling in the Cultural Heritage field. This software at the first stage detects points in the source photos in a similar way of the well-known SIFT approach and generates a descriptor for each point based on its local neighborhood. These descriptors are used later to detect correspondences across the photos. For solving camera intrinsic and extrinsic orientation parameters, the software uses a greedy algorithm to find approximate camera locations and refines them later using a bundle-adjustment algorithm.
a) b)
c) d)
e) f)
Three vases were chosen for their intrinsic characteristics, as the presence of large parts of black painting that produced textureless and shiny surfaces. It was decided to use all vases, even if the structures are quite the same, because of their colors and geometry. The first Greek vase (Fig. 4a) is a black on red coloured amphora dating back to the IV century BC while the Etruscan vase (Fig. 4b) is a black on red colored olpe (wine jug) dating back to the V/IV century BC. As shown in figure the Etruscan vase has a very small radius of curvature between the body and the collar, meaning that in that particular part of the vase the reflections were augmented because of the shape. An additional Greek pieces, a very dark vase (Fig. 4c) was used in a successive test for comparing the effects of HDR generated in simplified way from a single 14 bit raw image (used for the experiment on the first two vases), against a “true” HDR originated from a triplet of raw images with exposures spaced 2 stops apart (-2, 0, +2).
4. RESULTS AND DISCUSSION
Each triplet of images was easily masked using the dark background as selection level. The masks were then exported in order to use them also for all the images acquired from a certain position with the different levels of image preprocessing (no filter; filter; no HDR; HDR). Both orientation and image matching were then launched on masked images. The resulting indexes such as the number of tie points automatically evaluated
during orientation, and the number of points actually matched for generating the dense 3D cloud were saved and compared each other.
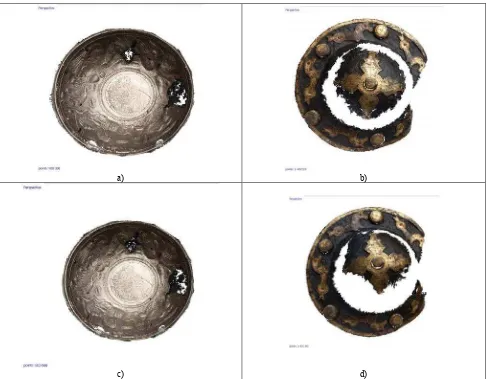
The targets shown in both figures 3 and 4 were used to metrically resize the model, but they resulted also helpful during the alignment phase. However they have been removed from the process while producing the dense point cloud using the “aggressive” depth filtering. The Patera, the Umbo and the first two vases were used for analyzing the effect of polarizing filters, and the image matching results are reported in tables 2 to 5.
Tie points Matched points
No filter 3795 920306
Polarizer 3959 913688
Table 2. Metallic object #1 (Patera). Orientation and matching results with and without polarizing filter.
Tie points Matched points
No filter 4899 1470523
Polarizer 4824 1416145
Table 3. Metallic object #2 (Umbo). Matching results with and without polarizing filter.
a) b)
c) d)
a) b)
c) d)
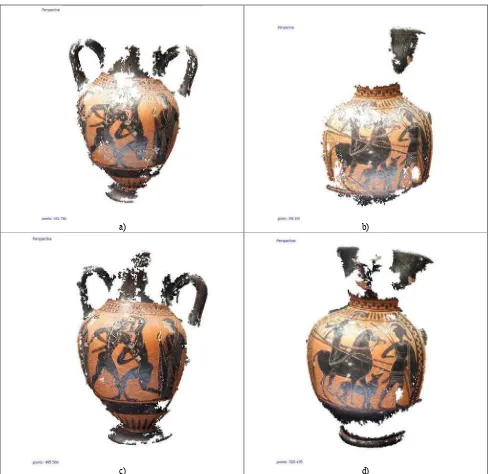
Figure 6. Image matching results on the ceramic test objects with and without polarizing filter: a, c) Greek vase; b, d) Etruscan vase. The first row (a, b) acquired without any polarizing filter while the second (c, d) with polarizing filter.
Tie points Matched points
No filter 1424 431756
Polarizer 1389 495566
Table 4. Ceramic object #1 (Greek vase). Matching results for different image pre-processing
Tie points Matched points
No filter 1108 399387
Polarizer 1169 503435
Table 5. Ceramic object #2 (Etruscan olpe). Matching results for different image pre-processing
polarizing filter, and from 1416145 to 1487364 (+5%) with the polarizing filter on.
With the ceramic objects the polarizing filters becomes much more important, since the physical behaviour of ceramic materials allows electromagnetic waves to keep their “natural” polarization. Reflections can be therefore strongly reduced thanks to filtering, and the increased number of matchable details allows to rise the number of matched points. This behaviour is shown in figure 6, where the second row of images qualitatively shows a number of matched points larger that the images of the first row, taken without polarizer. This qualitative impression is confirmed by numbers in tables 4 and 5. Tables 4 shows an increase on matched points from 431756 to 495566 (+15%) for the Greek vase whose images have been taken respectively without and with polarizing filter and no HDR. Also Table 5 shows and increase of matched points from 399387 to 503435 for the Etruscan olpe, corresponding to a considerable +26%.
However no influence seems to have HDR, at list using the single shot tone mapping used for all items considered till now, that in some cases seems, as witnessed by the numbers in tables 2-5, to give results worst than those generated without HDR processing. In order to check if such absence of increase in SFM performances is due to the way HDR have been implemented, a new set of images have been done for the Greek vase of figure 4c, whose HDR radiance maps have been calculated starting from exposure bracketing, as shown in figure 7.
a) b(
c) d)
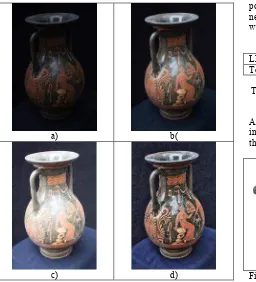
Figure 7. Canonical HDR processing with 3 raw shots at different exposures: a) -2 stops; b) right exposure; c) +2 stops; d) tone mapping of the resulting HDR image.
Once the images properly exposed (like that in Fig. 7b), and the images resulting from the tone mapping of a “true” HDR image (like that in Fig. 7d) are matched, the result is the one described in figure 8 and table 5.
a) b)
Figure 8. Image matching result from the images originated with different HDR processing: a) No HDR; b) tone mapped images from HDR processing.
From Fig. 8 it is possible to see qualitatively a small increase in the number of matched points, specially in the most “difficult” areas, like the dark internal area of the vase neck, and a few points in the exterior part of it, evident in the upper right sector of Fig 8a, that in Fig 8b are properly covered. In quantitative terms table 6 shows an increase from 5637561 to 5858700 matched points, corresponding to 4%. Such value is not so large but we have to consider that such small amount of additional points is formed by all those “difficult” points that would have never been captured with standard imaging due to their darkness with respect to the environment.
Tie points Matched points
LDR 5467 5637561
Tone mapped HDR 5646 5858700
Table 6. Ceramic object #3 (dark Greek vase). Matching results for different image pre-processing and no polarizer filtering.
A similar comparison has been done with the silver apple shown in Fig. 3c, providing a far better result, shown qualitatively in the following image.
a) b)
Figure 8. Image matching result from the silver apple images originated with different HDR processing: a) No HDR; b) tone mapped images from HDR processing.
significative increase in the matched points from 627,256 to 1,024,126 (+63%).
Tie points Matched points
LDR 898 627256
Tone mapped HDR 1030 1024126
Table 7. Third metallic object (silver apple) matching results for different image pre-processing.
5. CONCLUSION
The use of processing for compressing the dynamic range of high-contrast images originated by object with dark or highly reflective materials, has been shown. Such compression aims at improving the matching of images in the framework of the SFM/image matching 3D modeling pipeline.
The analyzed tools are: i) at optical level the strong attenuation (or the complete cancellation, for proper angles) of polarized light components influencing negatively Image Matching algorithms with fake matchings, originating wrong or imprecise clouds of 3D points; ii) at digital level the use of HDR/tone mapping processing, for obtaining details in those areas of the images, generally saturated by over-exposition or under-expositions, whose matching is intrinsically erroneous due to the absence of information to be matched.
Such tools have been discussed and applied to specific and critical Cultural Heritage applications, referred to the 3D acquisition and modeling of some dark and shiny archaeological remains made of different materials.
The main results are that polarizing filters may greatly help in improving image quality automatic photogrammetry with all those material such as ceramic, that is capable to maintain the natural polarization of light. The experimental result make evident an improvement from 5% to 25% of the matched points after filtering. However metallic object do not conserve light polarizations and are consequently not affected by such enhancement.
HDR has also been tested revealing a moderate enhancement on the tested ceramic object, in the order of 5%, with respect of standard images, but a definitely much better result on a metallic object (+63%).
6. REFERENCES References from Journals:
Barakat N., Hone A.N., Darcie T.E., 2008. Minimal-Bracketing Sets for High-Dynamic-Range Image Capture, IEEE Transactions on Image Processing, vol. 17, no. 10, pp. 1864-1875.
Cai, H., 2013. High Dynamic Range Photogrammetry for Light and Geometry Measurement. AEI, pp. 544-553.
Cai, H., Li, L., 2014. Measuring Light and Geometry Data of Roadway Environments with a Camera, Journal of Transportation Technologies, 4, pp. 44-62.
Patrick Ledda, Alan Chalmers, Tom Troscianko, Helge Seetzen, 2005. Evaluation of tone mapping operators using a high dynamic range display, ACM Transactions on Graphics 24 (3), pp. 640–648.
Robertson, M.A., Borman, S., Stevenson, R. L., Estimation-theoretic approach to dynamic range enhancement using
multiple exposures, Journal of Electronic Imaging, 12(2), 2013, pp. 219–228.
Yoshida, A., Mantiuk, R., Myszkowski, K, Seidel, H-P, 2006. Analysis of reproducing real-world appearance on displays of varying dynamic range, Computer Graphics Forum 25 (3) pp. 415–426.
References from Books:
Feininger, A., 1954. Successful Photography, Prentice Hall, Englewood Cliffs, NJ, USA, pp. 70-72.
Goldberg, N., 1992. Camera Technology: The Dark Side of the Lens. Academic Press. pp. 141–147. ISBN 978-0-12-287570-0.
Holst, G.C., CCD Arrays, Cameras, and Displays, JCD Publishing and SPIE Optical Engineering Press, Bellingham, WA (1996), pag. 113.
Paine, D.P., Kise, J.D., 2012. Aerial Photography and Image Interpretation, John Wiley & Sons, Hoboken NJ, USA.
Reinhard, E., Ward, G., Pattanaik, S., Debevec, P., 2006. High Dynamic Range Imaging, Morgan Kaufmann, Burlington, MA, USA, Chapter 03 – High Dynamic Range Image Encodings, pp. 91-93.
Reinhard, E., Ward, G., Pattanaik, S., Debevec, P., 2006. High Dynamic Range Imaging, Morgan Kaufmann, Burlington, MA, USA, Chapter 07 - Spatial Tone Reproduction, pp. 223-323.
References from Other Literature:
De Neve, S., Goossens, B., Luong, H., Philips, W., 2009. An improved HDR image synthesis algorithm, 16th IEEE International Conference on Image Processing (ICIP), pp. 1545,1548. Comparison between laser scanning and automated 3D modelling techniques to reconstruct complex and extensive cultural heritage areas, ISPRS Archives, Vol. XL-5/W1, 2013, pp. 73-80.
González-Aguilera, D., Fernández-Hernández, J., Mancera-Taboada, J., Rodríguez-Gonzálvez, P., Hernández- López, D., Felipe-García, B., Gozalo-Sanz, I., Arias-Perez, B., 3D modelling and accuracy assessment of granite quarry using unmmanned aerial vehicle, ISPRS Annals of the Photogrammetry, Remote Sensing and Spatial Information Sciences 07/2012; I(3):37-42.
Mann, S. , 1993. Compositing multiple pictures of the same scene, Proc. 46th Annual IS&T Conf., Boston, MA, May 9–14, Vol. 2, pp. 50–52.
Mann, S. and Picard, R.W., 1995. On being ‘undigital’ with digital cameras: Extending dynamic range by combining differently exposed pictures, IS&T’s 48th Annual Conf., Washington, D.C., pp. 422–428, May 7–11.
Medina, Rachel A., Scappaticci, Nicholas I., and Bodenbender, Brian E., 2011. High Dynamic Range Images in Sand Dune Photogrammetry. Geological Society of America, Abstracts with Programs, Volume 43, Issue 5, January 1, p.433
Ntregka, A., Georgopoulos, A., Santana Quintero, M., 2013. Photogrammetric Exploitation of HDR Images for Cultural Heritage Documentation, ISPRS Annals of the Photogrammetry, Remote Sensing and Spatial Information Sciences, Volume II-5/W1, XXIV International CIPA Symposium, 2 – 6 September 2013, Strasbourg, France, pp. 209-214.
Remondino, F., Spera, M.G., Nocerino, E., Menna, F., Nex, F., Gonizzi-Barsanti, S., Dense image matching: Comparisons and analyses, Digital Heritage International Congress (DigitalHeritage), 2013, vol. 1, pp.47-54, doi: 10.1109/DigitalHeritage.2013.6743712
Robertson M. A., Borman S., Stevenson R. L., 1999. Dynamic range improvement through multiple exposures, Int. Conf. Image Process., Vol. 3, pp. 159–163.
Venkata Lakshmi, S.; Sujatha, S.; Janet, J.; Bellarmine, T., Analysis of tone mapping operators on high dynamic range images, Proc. of IEEE Southeastcon, 2012, pp.1-6. doi: 10.1109/SECon.2012.6196908