CONSIDERING THE DYNAMIC REFUELING BEHAVIOR IN LOCATING ELECTRIC
VEHICLE CHARGING STATIONS
K. Liu a, *, X.H. Sun b,
a School of Transportation and Logistics, Dalian University of Technology, Dalian 116024, China,
b Dept. of Civil Engineering, Nagoya University, Furo-cho, Chikusa-ku, Ngoya 464-8603, Japan, [email protected]
KEY WORDS: Electric Vehicle, Recharging Stations, Location Model, Time-spatial Constraints, Waiting Time, Detour Behavior
ABSTRACT:
Electric vehicles (EVs) will certainly play an important role in addressing the energy and environmental challenges at current situation. However, location problem of EV charging stations was realized as one of the key issues of EVs launching strategy. While for the case of locating EV charging stations, more influence factors and constraints need to be considered since the EVs have some special attributes. The minimum requested charging time for EVs is usually more than 30minutes, therefore the possible delay time due to waiting or looking for an available station is one of the most important influence factors. In addition, the intention to purchase and use of EVs that also affects the location of EV charging stations is distributed unevenly among regions and should be considered when modelling. Unfortunately, these kinds of time-spatial constraints were always ignored in previous models. Based on the related research of refuelling behaviours and refuelling demands, this paper developed a new concept with dual objectives of minimum waiting time and maximum service accessibility for locating EV charging stations,named as Time-Spatial Location Model (TSLM). The proposed model and the traditional flow-capturing location model are applied on an example network respectively and the results are compared. Results demonstrate that time constraint has great effects on the location of EV charging stations. The proposed model has some obvious advantages and will help energy providers to make a viable plan for the network of EV charging stations.
* Corresponding author.
1. INTRODUCTION
With increasing concerns about global warming and the anxiousness about the shortage of non-renewable energies, alternative-fuel vehicles, especially the electric vehicles (EVs) are attracting more and more attentions. EVs will certainly play an important role in addressing the challenges of energy security and the problems of climate change and urban air pollution. A lack of the charging infrastructure, however, has inhibited the purchase and usage of EVs, and many existing studies have emphasized the refueling stations as one of the most formidable barriers to the promotion of EVs (Schwoon, 2007; Upchurch, 2010).
The problem is that consumers will be reluctant to purchase EVs until a sufficient number of charging stations are available for daily usage, while on the other hand fuel providers have no intentions to invest in such kinds of charging infrastructures unless there exist sufficient demands. Therefore, Schwoon (2007) stated that an initial network of charging stations should be constructed firstly by the government or the society to attract consumers.
Given the high costs of building new charging stations and the limited budgets, it is especially important to discuss the location problem, that is, how to locate effectively a limited number of EV charging stations in a transportation network to maximize the potential adoption of EVs. The conventional and popular models for locating alternative-fuel stations achieved to minimize total demand-weighted travel distance, or to solve the maximum covering problem, as well as to satisfy multiple objectives, from the viewpoints of system optimization. While
for the case of locating EV charging stations, the relative longer charging time make the issue of capacity constraints more significantly, therefore the possible delay time of waiting for charging or searching next station due to the requested minimum charging time should be considered and optimized. The service capacity constraints of EVs recharging stations differentiate the spatial distributions of recharging demands from that of the traditional refueling stations, which moreover lead to completed different recharging behaviors that are not system optimized. Unfortunately, these kinds of time-spatial constraints were always ignored in previous models.
This paper introduces a new location model by considering EV’s special performance and the associated recharging behaviors. The proposed model has dual objectives of minimum waiting time and maximum service accessibility for locating EV charging stations, with the refueling demands are simulated by considering the dynamic refueling decision behaviors based on several rational hypothesis rather than system optimization.
Analysis reveals how the requested minimum charging time affects the optimal locations of the charging stations.
The remained parts are organized as follows. Sections 2 summarized a literature review on the state-of-art of EV recharging stations’ location. Section 3 briefly depicts the proposed Time-Spatial Location Model (TSLM) for locating EVs’ recharging stations. Section 4 analyses a case study for comparing the proposed model and the widely used flow-refueling location model (FRLM). The last section concludes our analysis.
2. LITERATURE REVIEW
In recent years, a large number of approaches and models have been proposed to locate optimally the alternative-fuel-vehicle’s refueling stations, which can be mainly grouped into two categories: the node-based models and the path- or flow-based models.
The node-based models normally assumed that refueling demand is produced on the nodes of a road network, and their objectives are to locate a given number of p facilities, and allocates demand nodes i to facilities j to minimize the total distance from demand nodes to their nearest open station (Upchurch, et al. 2010). The p-median model is one of the most widely used node-based models, which usually assumes that refueling demand nodes are residence or workplace, so it has the appeal of locating stations conveniently to where people live when was applied on the actual problems.
The optimal objective of another type of models on path/flow demands basis is to locate p facilities to maximize the number of trips captured. The most popular model is the flow-capturing location model (FCLM) which is also called the flow-intercepting location model (FILM) (Yang et al. 2006). FCLM provides a behaviorally realistic basis for locating refueling stations since it considers that consumers prefer to stop along their way to destinations rather than make a special-purpose trip solely to refuel their vehicles. However there are some major drawbacks of FCLM, but at the same time leaves vast space for further research. FCLM ignores the difference between capturing longer trips and shorter ones, for longer trips, a vehicle with a limited driving range may need more than one station along the path to complete the trip without running out of fuel. In order to ensure not to exceed the vehicle’s range, Kuby and Lim (2005) and Kuby et al. (2009) developed the flow-refueling location model (FRLM) through introducing vehicle range parameter by using combinations of open facilities. The FRLM can be better applied to real-world networks at both the metropolitan scale and state scale. Yet neither FCLM nor FRLM are essentially capable of addressing the EV charging stations location problems, since the assumption that any refueling station is sufficient to serve all flows passing through is far away from the realistic. Upchurch et al. (2009) extended the FRLM with limited capacities and obtained the capacitated flow refueling location model (CFRLM). The fact that drivers may be willing to make reasonable detours from the shortest paths for refueling vehicles is worth of noticing. To address this concern, Yang et al. (2006) proposed the Flow Capturing Location Model with Service Radius (SR-FCLM), which assumes that if the distance between a service station and at least one node in the intended path is within service radius, then the consumer would be willing to deviate from the original route and detour two radius to receive services and then back to the original route.
In addition to the above two types of models, due to the fact that many location problem are inherently multi-objective in nature (Bapana et al. 2002), many multi-objective models have been developed. For example, the Maximum Covering/Shortest Path Problem (Bapna et al. 2002), the Minimum Cost/Maximum coverage model (wang et al. 2010), and the Maximum Capturing/Minimum Distance which combines the FCLM and the p-median model (Hodgson et al. 1992). Besides these static models, the Agent-Based Model is also employed in location problems, which provides a dynamic feedback idea: the
more vehicles there are, the more likely a purchaser will choose one himself, and the more refueling stations will be invested. Stephan (2004) and Schwoon (2007) obtained certain results using this dynamic feedback idea. One significant contribution
is that they raised the concept of “Worry Factor” which reflects people’s concern about the availability of service station when using alternative-fuel vehicles. time-spatial constraints were always ignored in previous models. Therefore a new model is proposed to establish a convenient initial network of recharging stations for the promotion of EVs. From the users’ perspective, convenience means not just having to travel too far to obtain service but being able to obtain service without an overly long waiting time. So our research is aimed at strategically locating charging stations to minimum waiting time and maximum service accessibility, which we called Time-Spatial Location Model (TSLM) because it considers the impacts of time and space constraints on location simultaneously.
3.1 Refueling Behaviors
Recent studies have shown that refueling is frequently performed in commuting trips, single-purpose refueling is not uncommon but drivers are willing to detour certain distance off their intended route to refuel their vehicles (Upchurch, 2010). For the users of EVs, they also have to care about the accessibility of charging stations around their travel routes and the waiting times at a certain station for charging. It is generally accepted that one rational person should choose such station that minimizes the sum of the waiting time at a certain station and the subsequent travel time to reach destination as long as the remaining power can support the searching process, and one always along the shortest path when traveling between two nodes.
The EV recharging logics can be described as: (a) Assuming that an EV at one node can arrive at another node, which means that the remaining battery power must sufficiently cover the distance between the two nodes. If this is insufficient, the vehicle must be recharged at the first node, where a station must be located. (b) The remained battery power is the difference between the state of charge (SOC) at the start node and the power consumption of travelled route that is a function of distance for simplicity.
Drivers tend to refuel in areas where are detailed in their mental maps, e.g. in the vicinity of their homes and workplaces; drivers tend to interrupt their journey near the beginning or end for refueling, rather than in the middle; refueling is frequently performed in commuting trips, while it is linked with shopping with less-than-expected frequency. Single-purpose refueling is not uncommon, but drivers are willing to detour certain distance off their intended route to refuel their vehicles. Besides these general observed refueling behaviors, for the users of EVs, they
also have to care about the accessibility of charging stations and the charging waiting time.
For an EV arrived at a charging station i with qi charge piles, there are three cases it will face. If the remaining power can’t support to arrive at the next station, then it must recharge at station i no matter how long the waiting time is; or else one can choose to receive service or not, which depends on the number of waiting vehicle at station i and the available number of charge piles. The drivers may leave according to his/her judgment on the queuing condition of the other available recharge stations.
The waiting time at station i is governed by three factors. The number of waiting vehicles n, the number of charge piles qi and the charging time of each EV. The number of waiting vehicles n is a variable which dues to the temporal and spatial distributions of charging demand and the initial remaining power. The number of charge piles qi is not only influenced by the charging demand, but also restricted by physical conditions of a given location. The charging time of each EV is up to the remaining power, the system of charge mode and the type of EV. Generally there are two charge modes: quickly recharging for 30 minutes with nearly 80% of the full storage and about 6 to 8 hours for slow recharging with full charge.
3.2 Model Assumptions
As we all know, the charging behaviors are very complex that are affected by a variety of factors. In order to conveniently describe the problems, we make the following assumptions:
1) For all the users, the charging stations are detailed in their mental maps and the queuing of other stations are completely transparent so that one can always make the best decision on whether charging or not at a certain site if the remaining power can arrive at another station. 2) This paper assumes that the initial remaining power for each EV is randomly drawn from a normal distribution with the range of 60-100 km, while all EVs can travel 100 kilometers after receiving recharging service.
3) The number of charge piles st each station is fixed although the variable quantity of charge piles is perfected and realistic.
4) The charging time of each EV is 30 minutes as long as one decides to receive service at a charging station no matter how much power left and what type of the vehicle is. 5) All the roads have similar traffic condition and each EV travels at the same speed, and the consumed electric energy has the linear relationship with the distance.
6) The departure time of each EV is taken to be random variable subject to uniform distribution.
7) This paper considers only the charging at peak hours so the capacity of each station can be defined as incapacitated. 3.3 Model Formulation
As mentioned earlier, the objective of TSLM is to minimize waiting time and maximize service accessibility. Considering maximizing service accessibility means minimizing the searching time for the other station caused by queuing. Meanwhile according to the rational person’s choose behaviors, the TSLM model is in fact equivalent to minimize the total travel time from the origin to destination. The following variables are defined:
p: Total number of charging station, p=1,2,…;
i: Nodes or stations; charge at node i, and 0, otherwise;
τ: Requested charging time, which equals to 30 minutes Wim: Waiting time of the arriving EV m at station i, minutes; Ui: Number of vehicles failed to recharge at node i, which can be used as an evaluation index of network service levels; For Sim=1, assuming that the last EV leaving station i before the mth EV arrives is labelled as L, then N calculate the shortest path distance dij for each j (i≠j). Also all the Ui are initialized as 0;
2) Then record every EV’s departure time from the origin and generate randomly the remaining mileages VMTim of each vehicle.
3) For a certain origin i with Xi=0, if VMTim<min{dij}, update Ui=Ui+1, else travel toward station j which ensures that the sum of waiting time at station j and the subsequent travel time to destination is the shortest. For Xi=1, if VMTim<min{dij}, then Sim=1, by this time the waiting time Wim should be calculated according to the queuing and the leave time gim should be updated; else if the sum of Wim and the subsequent travel time to destination is longer than some of other stations, then Sim=0, EV m will driving toward station j at which the sum is smallest along the shortest path.
4) When a certain EV m arriving at any station j except the origins, if VMTjm is shorter than the shortest distance between the right station j and the other stations, then Sjm=1, and the waiting time Wjm should be calculated and the leave time gjm should be updated; else EV m will judge whether the sum of Wjm and the subsequent travel time to destination is longer than the sum of other stations, if that is the case, then Sjm=0, EV m should update the leave time gjm=rjm and travel toward the station at which the sum is smallest.
The TSLM is effectively a dynamic model by fully considering the time factor according to the above description of charging
process which makes the model more realistic and more complex. In addition, the TSLM also has another significant difference from most of the existing models on the shortest path. TSLM doesn’t restrict all the vehicles always travelling along the shortest path even for searching an available recharging station, which makes it more realistic.
4. CASE STUDY
4.1 Example Network and Charging Demand
To validate the effectiveness of the TSLM model, a 25-node example network which is provided by Berman and Simchi-Levi (1988) is selected as the study area (Fig. 1). Unlike the initial network, the length of each link is doubled in order to ensure that a certain amount of EVs have the charging demand during their journey, while the node weights that reflect the population were multiplied by one thousand.
Fig.1 A 25-node Example Network
The O-D flow is generated by using Hodgson’s formula (Hodgson, 1990): ODij=WiWj/dij**1.5, where the Wi is the weight of the origin node, the Wj is the weight of the destination node, and the dij is the shortest path distance between node i and node j. Among the calculated total travel demands of 12240 trips, there are 1970 demands for charging during their round-trip travel by generating randomly the initial remaining power according to the stated assumptions. Besides, considering the charging at peak hours is the most important, the remained eventual charging demands for this study are 101 trips. The departure times are according to a uniform distribution.
4.2 Results
The TSLM aims to reflect authentic charging behavior as described in the charging process which makes its solution process more complex. The complexity increases with the expansion of network and the number of charging stations. As a preliminary validation study, it is assumed that the number of charging stations is 2 and each station has 25 charge piles according to the budgets. The results of TSLM on the example network are shown in Fig. 2.
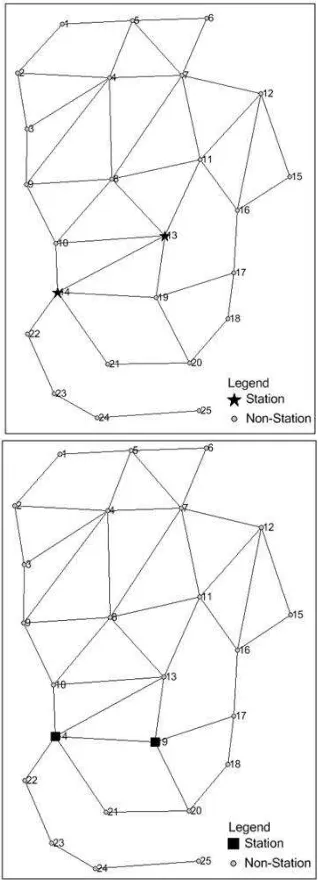
Fig.2 Location Results of TSLM
The optimal locations of the two stations are node 14 and node 24 with satisfying the charging demands of all the 101 EVs and their total time for travelling and waiting is 7380 minutes, which doesn’t include the service times since the requested charging time is the same for every EV. Here the waiting time is calculated by the single-line and multi-server queuing model. In order to confirm the validity of TSLM, this article also apply the widely used model FCLM to the same network with the charging demands are identical, and the results obtained by greedy algorithm can be seen in Fig. 3. There are two optimal layouts for the two stations, namely 14&13 (above), and 14&19 (below). The serviced EVs are 97 and their total travelling times along the shortest path are 6321 minutes for both cases. However, there is no other information can be used to judge which one is better.
Fig.3 Location Results of FCLM
The comparative results demonstrate that for the TSLM, all the EVs have received services, while there are 4 vehicles cannot complete their travels by FCLM rules. However, the total time of TSLM is longer than that of FCLM. So it is not easy to compare the merits and demerits of the two models given that TSLM allows vehicles to detour from their shortest path to complete the charging and therefore the serviced EVs and their total times are greater than that of FCLM.
In view of this and seeing the difference between TSLM and FCLM, we impose restriction of shortest path on the TSLM while keeping other conditions being the same. The final locations and served numbers of EVs are the same as FCLM, but the waiting times of the two cases are 1274 minutes and 1131 minutes, respectively, with their total times are 7595 minutes and 7452 minutes, which are larger than 7380 minutes by TSLM (Table 1). It can be inferred that the TSLM is superior to FCLM with greater serviced EVs and shorter times which mainly due to the assumption of detour behavior.
In addition, the TSLM also defines the rules of whether charging or not at a certain station when facing with multiple choices. The waiting times of 14&13 and 14&19 obtained by applying the TSLM without detouring and judgment rules on the example network are 1449 minutes and 1314 minutes, which obviously larger than that of TSLM with shortest path only.
Model Locations Serviced vehicles
Waiting Time/Total Time* (minutes)
TSLM 14&24 101 654/7380
TSLM
(shortest path) 14&19 97
14&19:1131/7452 (14&13:1274/7595) TSLM
(shortest path, without rules)
14&19 97 14&19:1314/7635 (14&13:1449/7770) * Total time doesn’t include the service time of every EV.
Table 1.Results of Different Models
Furthermore, the above results also provides important basis for judging that the combination of 14 and 19 is better than 14 and 13, which is impossible for FCLM.
5. CONCLUTION AND FURTHER WORK
This paper proposes a TSLM model for locating EV charging stations based on some assumptions of actual travel behavior and recharging decision making process, and conducts a comparative study by applying the FCLM, TSLM and its modifications on an example network respectively. The comparative results demonstrated that TSLM is better than FCLM because of the assumptions of allowing detour travel behavior and judgment rules.
Further researches are needed for relaxing the assumptions, for example the number of charging piles of each station, the charging time of each EV, and the relationship between energy consumed and distance travelled under different road conditions, for these assumptions the variable magnitudes are more realistic than fixed values.
ACKNOWEGEMENT:
Authors would like to acknowledge the funds supporting from NationalNatural Science Foundation of China (Grants No. 51378091) and the Fundamental Research Funds for the Central Universities of China (Grants No. DUT12ZD203).
REFERENCES:
Bapna, R., Thakur, L.S. and Nair, S.K. (2002) Infrastructure development for conversion to environmentally friendly fuel. European Journal of Operational Research, 142, pp. 480-496. Current, J., Ratick, S. and ReVelle, C. (1997) Dynamic facility location when the total number of facilities is uncertain: A decision analysis approach. European Journal of Operational Research, 110, pp. 597-609.
D. Simchi-Levi and Berman, O. (1988). A Heuristic Algorithm for the Traveling Salesman Location Problem on Networks. Operation Research, 36(3), pp.478-484.
Hodgson, M.J. (1990) A Flow-Capturing Location- Allocation Model. Geographical Analysis, 22(3), pp. 270-279.
Hodgson, M.J. and Rosing, K.E. (1992) A network location-allocation model trading off flow capturing and p-median objectives. Annals of Operations Research, 40(1), pp.247-260. Kuby, M. and Lim, S. (2005) The flow-refueling location problem for alternative-fuel vehicles. Socio-Economic Planning Sciences, 39(2), pp.125–145.
Kuby, M., Lines, L. and Schultz, (2009) Optimization of hydrogen stations in Florida using the Flow-Refueling Location Model. International Journal of Hydrogen Energy, 34, pp.6045-6064.
Schwoon, M. (2007) A tool to optimize the initial distribution of hydrogen filling stations. Transportation Research Part D, 12, pp.70-82.
Stephan, C. and Sullivan, J. (2004) An Agent-Based Hydrogen Vehicle/ Infrastructure Model. IEEE Proceedings of the 2004 Congress on Evolutionary Computation, Vol. 2, Portland. Upchurch, C., Kuby, M. and Lim, S. (2009) A model for location of capacitated alternative-fuel stations. Geographical Analysis, 41, pp.127-148.
Upchurch, C. and Kuby, M. (2010) Comparing the P-median and flow –refueling models for locating alternative-fuel stations. Journal of Transport Geography, 18, pp.750-758.
Wang, Y.W. and Lin, C.C. (2009) Locating road-vehicle refueling stations. Transportation Research Part E, 45, pp.821-829.
Wang, Y.W. and Wang, C.R. (2010) Locating passenger vehicle refueling stations. Transportation Research Part E, 46, pp.791-801.
Yang, J., Zhang, M. and Chen, X. (2006) A Class of the Flow Capturing Location-Allocation Model with Service Radius. Systems Engineering Theory and Practice, 2006(1), pp.117-122.