Pluriactivity, farm household socio-economics and the botanical
characteristics of grass fields in the Grampian region of Scotland
N.E. Ellis
a,∗, O.W. Heal
b, J.B. Dent
c, L.G. Firbank
aaInstitute of Terrestrial Ecology, Merlewood Research Station, Grange-over-Sands, Cumbria LA11 6JU, UK
bInstitute of Ecology and Resource Management, University of Edinburgh, West Mains Road, Edinburgh EH9 3JG, UK
cRoyal Agricultural College, Cirencester GL7 6JS, UK
Received 10 September 1998; received in revised form 8 April 1999; accepted 1 June 1999
Abstract
The maintenance of low-intensity farming is important for the conservation of habitats and species and is a particular issue in Europe as areas under extensive farming regimes continue to diminish. Current proposals for agricultural reform in Europe are seeking to retain and encourage extensive farming partly by seeking to redirect farm workers into non-farm activities such as leisure activities, marketing and processing. In 1991/1992, the botanical characteristics of grass fields on farms where farm households were engaged in non-farm activities (pluriactivity) were compared to those where the farm was fully employed in agriculture. This was done through a botanical and land use/management survey carried out on 71 lowland farms in the Grampian region of Scotland on which a socio-economic survey had been undertaken. Pluriactivity was found to be related to the socio-economic characteristics of the household, so therefore, could not be associated directly with the type and intensity of farming, and hence the botanical composition of the grass swards. The mean age of non-pluriactive farm households was significantly greater than that of pluriactive households and the farms were generally larger. Land management, particularly the rate of reseeding, had the greatest impact on the grass swards. All pluriactive farms had more plant species within their fields than non-pluriactive farms, but the greatest difference was between the non-pluriactive farms and those with off-farm work. The main conclusion is that land management has the greatest over-riding influence on the species composition of grass fields but that the type and intensity of management is influenced by the farm and household characteristics, particularly any involvement in non-agricultural activities. Households not involved in non-agricultural activities were more likely to be farming intensively. The implication of the study is that agricultural and rural policies need to recognise the ecological importance of smaller farms and in particular their association with off-farm work. ©1999 Elsevier Science B.V. All rights reserved.
Keywords:Farm pluriactivity; Socio-economic characteristics; Grass swards; Extensive farming
∗Corresponding author. Tel.: 446-2413; fax:
+44-0131-446-2406
E-mail address:[email protected] (N.E. Ellis)
1. Introduction
From the 1940s, policies in Britain encouraged intensive farming methods which resulted in losses of both habitats and species. Semi-natural grass-lands have particularly decreased in extent, occupy-ing around 3% of the area that they had covered in
122 N.E. Ellis et al. / Agriculture, Ecosystems and Environment 76 (1999) 121–134
1930 (Fuller, 1987), the remaining grasslands being further impoverished of species through drainage, reseeding, an increased use of agro-chemicals and in-creased stocking densities (Hopkins, 1988). Through-out Europe areas under extensive farming regimes are continuing to diminish (Bignal and McCracken, 1996).
During the 1980s, a change in European agricultural policies began to encourage a reduction in agricultural production through the use of quotas, set-aside arable land and grazing extensification schemes. Whilst some farm households have left farming others, affected by a consequential decline in farm income, have become involved in non-agricultural activities to compensate, at least within the UK (Cox et al., 1989). Factors deter-mining the uptake and type of non-agricultural activi-ties are complex which are not always associated with economic conditions (e.g. Bryden, 1994; Edmond and Crabtree, 1994). Off-farm work has been associated with hobby farmers (Gasson, 1988) whereas on-farm diversification has been found to be more likely to occur along tourist routes (at least in Scotland; Ed-mond et al., 1993), where farm households are gen-erally more qualified (Corcoran and Dent, 1994) and the farm plays a strategic role in the income generated by the household (Munton et al., 1989).
Whatever the cause for the uptake of pluriactiv-ity, the rate of uptake in certain areas has increased markedly. A socio-economic survey of 295 farms in the Grampian region of Scotland showed that the up-take of pluriactivity had trebled between 1980 and 1991 (Ellis, 1994); in Wales, the uptake of off-farm work was greater after 1986 than in the 5 years be-fore (Bateman and Ray, 1994). In 1992, this shift in farm labour resources was recognised in the provi-sion of aid to farmers for less-intensive farming and involvement in non-farming activities under the EC Agri-environmental package (Regulation No 2078/92) and is now being further addressed in the latest agri-cultural reform package, Agenda 2000.
Land use systems directly determine the types and mosaic of the land cover across the farm whilst the level of management within each land use deter-mines the type and number of plant species within (Fig. 1). For example, a purely agricultural man-agement plan may aim to maximise all profitable land, managing intensively with maximum/optimum agro-chemical inputs and livestock numbers. In the
event of alternative employment (pluriactivity), the land management plan may differ according to where the resources of the household are redirected. In the case of off-farm employment (off-farm pluriactiv-ity), the management plan may be simplified with less emphasis on the use of all land and managed with fewer resources both time-wise and financially through reduced agro-chemical inputs and fewer live-stock. The result of a less intensive regime may, therefore, allow the establishment of a greater num-ber of plant species, whilst in less accessible corners of farmland, semi-natural habitats (such as scrub and wetter areas) may increase or appear. Gasson (1988) associated off-farm work with less time and labour demanding systems such as beef, sheep and cereals rather than the more demanding dairy cows and non-cereal enterprises. In the case where alterna-tive enterprises are developed on the farm (on-farm pluriactivity), the pluriactivity may diversify the land use (e.g. alternative crops, golf courses, horse riding) although some forms of on-farm diversification do not affect the land (for example, tourist accommo-dation and farm shops). With on-farm diversification the intensity of land management may not be notice-ably reduced because, with the household remaining on the farm, a more efficient use of time may be made.
The hypotheses above indicate a line of influence from farm household socio-economic characteristics to land management through to ecological charac-teristics. This study initially ignored the middle of this line of influence and looked directly for a rela-tionship between the involvement in pluriactivity (the socio-economic aspect) and the botanical characteris-tics of grass fields (the ecological aspect). Only later were the components of the socio-economic and land management data used to identify the order of influ-ence of such on grass sward composition.
2. Data collection
2.1. A socio-economic survey of pluriactivity in Grampian
Fig. 1. The theoretical relationship between factors affecting a farm household and their decisions on the use of land, outlining the knock-on effects to landscape and species.
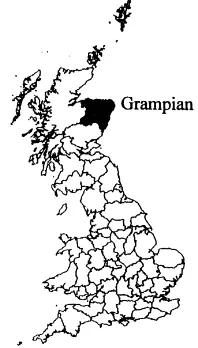
Fig. 2. The location of Grampian region within Britain.
1991. The sample of farms was randomly selected by the Farm Type (SOAFD, 1992) and by farm British Size Unit (BSU) groups, excluding farms smaller than 4 BSUs and farm estates (one BSU corresponds to 2000 ECU of standard gross margin; SOAFD, 1992). Farms were, therefore, selected across a range of land uses and economic categories.
Each farm household was interviewed to obtain data on the extent of the farm, farm ownership, the com-position of the household, qualifications, income, the number of labourers employed to work at the farm and the feasibility of family succession of the farm. Data were also collected on any non-agricultural activities providing additional income to the household, such as:
the household member(s) involved, the time allocated to farming/non-farming activities by each household member and the location of the work (i.e. whether it was on or off the farm). Using the information col-lected about the location of the pluriactivity, four farm groups were recognised
1. farms where no member of the household was involved in non-agricultural activities, termed
Non-pluriactive;
2. farms where at least one household member was working off the farm but there was no on-farm non-agricultural activitythe Off-farm group; 3. farms where there was at least one non-agricultural
activity (such as a Bed and Breakfast, farm shop, caravan sites, livery, etc.) but no-one had an off-farm job -the On-farm group;
4. farms where members were working off-farm and there were also on-farm non-agricultural activities -the Both group.
2.2. The botanical survey
Seventy-one farms were selected out of the 295 farms visited with a socio-economic questionnaire in order to obtain details on the land use and the botanical characteristics of the four farm groups. Seventy-one farms was the maximum number that could be botan-ically surveyed by two people over two summer sea-sons (1991 and 1992).
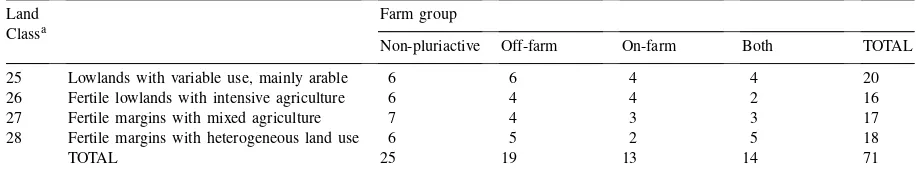
124 N.E. Ellis et al. / Agriculture, Ecosystems and Environment 76 (1999) 121–134 Table 1
The number of farms used in the ecological survey in Grampian Region, Scotland, stratified by the location of the non-agricultural activity/ies of the household and by Land Class
Land Farm group
Classa
Non-pluriactive Off-farm On-farm Both TOTAL
25 Lowlands with variable use, mainly arable 6 6 4 4 20
26 Fertile lowlands with intensive agriculture 6 4 4 2 16
27 Fertile margins with mixed agriculture 7 4 3 3 17
28 Fertile margins with heterogeneous land use 6 5 2 5 18
TOTAL 25 19 13 14 71
aThe Land Classes were defined by geology, relief, climate and human artefacts. The landscape descriptors were later obtained through field survey (see Bunce et al., 1996 for further details).
However, a delay in the start of the socio-economic survey meant that the botanical survey started before all data on the 295 farms had been collected which resulted in an unequal number of farms in each group although random sampling within each group was maintained. A second stratification of the sample was also used to reduce any potential bias of pluriactivity to the physical characteristics of the land. This was achieved by selecting the farms in each group equally across four Institute of Terrestrial Ecology (ITE) Land Classes (Table 1). These Land Classes have been de-fined by a computerised database which has classified each 1 km square within Britain into one of 32 Land Classes using data on climate, topography, geology and human artefacts (such as the length of main and minor roads) in the square (Bunce et al., 1996). The four selected Land Classes account for 60% of the total Grampian area (the lowland area) the rest of the region being mountainous and therefore not under pri-mary agricultural use. Lowland Grampian covers in-tensive arable areas towards the east and north coasts, and marginal upland areas where heather-dominated land (mainly found in the west of the region) has been reclaimed by reseeding and used for livestock.
The boundaries of the 71 farms were copied onto 1 : 10,000 scale maps before the botanical survey visit using the sketches made on 1 : 25,000 scale maps by the farm household during the socio-economic survey. On arrival at the farm, a short interview (10–20 min) using the maps was undertaken with the farmer or manager to obtain data on the use and management of each grass field: (a) whether the field had been per-manently grass or part of an arable rotation over the
previous 10 years and (b) how often the grass had been reseeded in that time, (c) the main use(s) of the field over the previous 4 months, (d) how much inor-ganic N had been applied over the last 12 months, (e) whether organic manures (farmyard manure, slurry or silage effluent) or (f) herbicides been applied in the last twelve months and, (g) if the field has been stocked during the last 12 months, whether it had been stocked to its potential according to the farmer’s perception. To minimise the interview time, farmers were asked to indicate which management category each field fell into rather than obtaining specific data; for example, it was asked whether the field had received 0, 1–149, 150–249 or >250 kg N ha−1in the last twelve months
rather than the exact amount of inorganic N. The field management categories were taken from work pre-viously done on British grasslands (Hopkins et al., 1985).
Botanical data were collected from grass fields using 10 quadrats at each farm. Quadrats were ran-domly positioned on the farm map before the visit. At the farm, quadrats were located as close to the pre-determined positions as possible but always at least 3 m from the edge of the field to minimise the influence of the field boundaries. About 5% were found to be positioned outside grassland but were relocated to the nearest grass field along a cardinal point from the initial location on the map (i.e. either due north, east, south or west), at least 3 m from its boundary. Full species lists were made within each
2 m×2 m quadrat and an estimate made of each
2.3. Data management and analyses
Two-way analyses of variance (ANOVA) (using the farm as the unit) were used to determine differences between the farm groups. Post hoc testing between each pluriactive group and the non-pluriactive group used Dunnett’s test in SAS (SAS Institute, 1985). Data expressed as percentages were analysed after angular transformation.
Associations between pluriactivity and socio-economic and land management characteristics were made using principal components analysis (PCA) in the GENSTAT package using the correlations method option (Payne et al., 1987) (Table 2). The socio-economic and land management data were thereafter analysed with the species data separately (socio-economic with species data, land manage-ment with species data) because of the otherwise high ratio of variables to farm sites. These asso-ciations were made using Redundancy Analysis (RDA) within the CANOCO program (Ter Braak, 1988), taking all defaults. Two variables, the pres-ence of on-farm pluriactivity and the percentage time given to agricultural activities, were omitted due to collinearity. Statistical tests of significance on the RDA axes and ordinated variables were carried out by Monte Carlo tests using 99 random permuta-tions. With the relatively high number of variables for the number of farms, significance levels between
p<0.05 and p<0.1 were considered as weakly sig-nificant, particularly as the number of farms was also low.
3. Results
3.1. Summary of survey data
Seventy-two percent of farms covered by the socio-economic survey were pluriactive; 50% of the farms were in the Off-farm group, 11% were in the On-farm group and a further 11% were in the Both group. Although 71 farms were visited as part of the botanical survey, three farms had no grassland and a further two had grasslands which were not managed by the household. This meant that land management data were collected from 68 farms whilst species data
were collected from only 65 farms. Unless otherwise stated, the following results only apply to these 65 farms.
3.2. The use and management of grass fields using the botanical survey questionnaire
From the botanical survey maps, the area of grass-land was estimated for each farm, but no significant difference was found between the farm groups. How-ever, the use of grassland varied between the farm groups. Non-pluriactive farms used a greater pro-portion of cattle fields than those in the Off-farm and Both groups (p<0.05), although there was a non-significant increase in the proportions of sheep and mixed sheep and cattle fields in these pluriac-tive groups (Fig. 3). Beef cattle accounted for 37% of fields surveyed, silage fields accounted for 16%, whilst sheep fields with cattle accounted for 15% of fields and sheep alone fields for 10%. Other field uses were all under 5%. Non-agricultural activities on the farm within the On-farm and Both groups occupied, at most, 1% of grass fields.
In terms of the management of the grass field sites, no significant differences were identified between the farm groups. At least half of all grass fields were in arable rotation with 80–85% of all fields having been reseeded in the previous 8 years. About 20% of all fields had not received any N in the previous year, whilst over 50% had received between 1 and 125 kg N ha−1. Farmers believed that they had been
stocking over half of the grazed fields to the fields potential. Between 17–36% of fields received organic manures and fewer than 5% of fields had herbicides applied which were generally spot-sprayed.
3.3. The association of pluriactivity with
socio-economic and land management characteristics
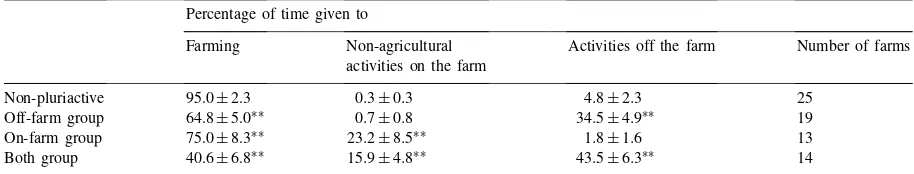
Data from the socio-economic survey indicated that working away from the farm decreases time given to agriculture more than involvement in non-agricultural activities on the farm (p<0.01) (Table 3).
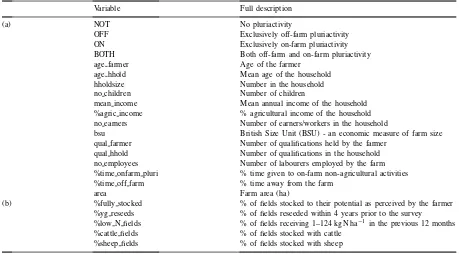
Pluri-126 N.E. Ellis et al. / Agriculture, Ecosystems and Environment 76 (1999) 121–134 Table 2
The variables selected from (a) the socio-economic questionnaire and (b) the land management questionnaire for the 65 field surveyed farms, and used within a Principal Components Analysis (PCA) and in Redundancy Analyses (RDA)
Variable Full description
(a) NOT No pluriactivity
OFF Exclusively off-farm pluriactivity
ON Exclusively on-farm pluriactivity
BOTH Both off-farm and on-farm pluriactivity
age farmer Age of the farmer
age hhold Mean age of the household
hholdsize Number in the household
no children Number of children
mean income Mean annual income of the household %agric income % agricultural income of the household no earners Number of earners/workers in the household
bsu British Size Unit (BSU) - an economic measure of farm size qual farmer Number of qualifications held by the farmer
qual hhold Number of qualifications in the household no employees Number of labourers employed by the farm %time onfarm pluri % time given to on-farm non-agricultural activities %time off farm % time away from the farm
area Farm area (ha)
(b) %fully stocked % of fields stocked to their potential as perceived by the farmer %yg reseeds % of fields reseeded within 4 years prior to the survey %low N fields % of fields receiving 1–124 kg N ha−1 in the previous 12 months %cattle fields % of fields stocked with cattle
%sheep fields % of fields stocked with sheep
Table 3
The percentage of time allocated to various activities within the working week by the farm household (mean±SE) for the 71 botanically surveyed farmsa
Percentage of time given to
Farming Non-agricultural Activities off the farm Number of farms activities on the farm
Non-pluriactive 95.0±2.3 0.3±0.3 4.8±2.3 25
Off-farm group 64.8±5.0∗∗ 0.7±0.8 34.5±4.9∗∗ 19
On-farm group 75.0±8.3∗∗ 23.2±8.5∗∗ 1.8±1.6 13
Both group 40.6±6.8∗∗ 15.9±4.8∗∗ 43.5±6.3∗∗ 14
aThe data were obtained from a socio-economic survey carried out during 1991.
∗∗p<0.01 level of significance between the non-pluriactive farms and the pluriactive group using post hoc comparisons on angular
transformed data.
activity, on the other hand, tended to be correlated with larger families and more qualifications (Fig. 4a, b). As indicated by the data collected by the field questionnaire, non-pluriactive farms were asso-ciated with a greater proportion of grass fields used for cattle (p<0.01) with off-farm work associated with a greater proportion of fields used for sheep (p<0.05).
Axis 2 explained only 15% of the variation between the farms but showed a trend for the Off-farm and Both groups to contain smaller farms, in terms of the hectarage or economic size (BSU), with the On-farm group containing larger farms, but these differences were not statistically significant.
3.4. Grass sward compositions
Most grass swards were Lolium perenne and
Tri-folium repensreseeds. These are generally the poor-est swards (in terms of the number of species) in Britain.Dactylis glomerataandPhleum pratensewere also sown species, but mainly on the non-pluriactive
farms; D. glomerata occurred in 32% quadrats on
non-pluriactive farms (compared to less than 25%) and
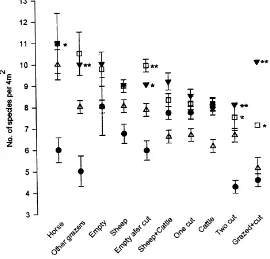
P. pratensein 85% (compared to less than 79%). The mean number of plant species per quadrat var-ied in a consistent manner between the farm groups, even within the same field use (Fig. 5). Non-pluriactive farms had the fewest species for most field uses, typ-ically 4–8 species per 4 m2. The Off-farm and Both groups had the greatest number of species recorded across all types of field use with mean values of 7–11 species per 4 m2. Of the pluriactive farms, the On-farm
group had least species across all field uses, typically 5–10 species per 4 m2.
3.5. Explaining the species characteristics of grass fields in each farm group
3.5.1. Socio-economic variables
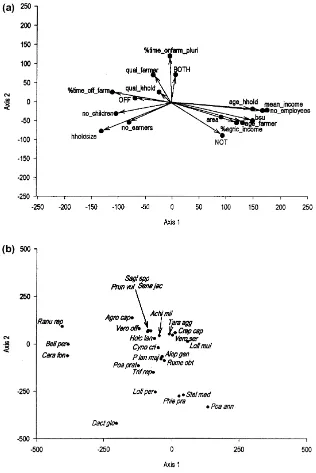
Using the RDA, the socio-economic variables ex-plained 36% of the total variance in the species data along the first axis and 13% along the second axis, weakly significant for the first axis (p<0.06) and for all axes (p<0.09).
The first axis was correlated to the mean age of the farmer and household, the mean income of the house-hold, the number of farm labourers and the BSU (all at p<0.001) (Fig. 6a). Superimposing the species names onto this graph indicates that farms with younger households with children still at home, a low farm income and few or no farm labourers (i.e. the Off-farm group) were associated with a greater like-lihood of having non-sown species in the sward such asBellis perennis,Ranunculus repensandCerastium fontanum(Fig. 6b).
3.5.2. Land management variables
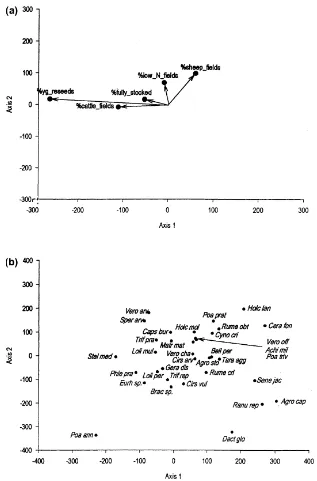
The RDA using the land management data ex-plained 59% of the variance in the species on the first axis (p<0.01). This axis was strongly corre-lated to the percentage of fields reseeded within 4 years (p<0.001) (Fig. 7a). Species associated with a high reseeding regime were sown speciesP. pratense,
Trifolium spp. and Lolium spp, species indicative of cultivation (e.g. Poa annua, Stellaria media, Sper-gula arvensis), and mosses (Eurynchium spp. and
128 N.E. Ellis et al. / Agriculture, Ecosystems and Environment 76 (1999) 121–134
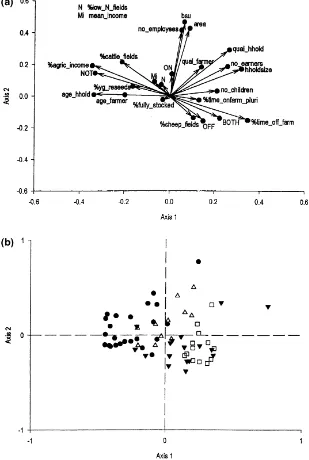
Fig. 4. A Principal Components Analysis (PCA) using socio-economic and land management variables to define the characteristics of each farm group. (a) The strength of each variable is positively related to the length of the arrow. The abbreviations are defined in Table 2. (b) The placement of each of the 71 farms in relation to the principal axes in (a):dnon-pluriactive farms,Hfarms with off-farm work only, 1farms with on-farm pluriactivity only,hfarms with both off-farm and on-farm pluriactivities.
The Monte Carlo test on all axes was significant (p<0.01). Axis 2 only explained 15% of the vari-ance in the species data and was most associated with the percentage of sheep fields and the percentage of
fields receiving the least N (both atp<0.01). The re-lationship indicated that the greater the percentage of sheep fields and low N application fields, the greater
Fig. 5. Mean species richness per 4 m2field quadrat for various field uses and each farm group:dnon-pluriactive farms,Hfarms with off-farm work only,1farms with on-farm pluriactivity only,hfarms with both off-farm and on-farm pluriactivities. Bars indicate standard error about the mean. *p<0.05, **p<0.01 level of significance between the non-pluriactive farm group and the pluriactive group using a one-way analysis of variance. The main point of this figure is to indicate the consistent pattern of lower species richness values on the farms that are non-pluriactive and in the On-farm group rather than the actual species richness values.
cristatus,Holcus lanatus,Poa pratensisandCerastium fontanum).
4. Discussion
4.1. Pluriactivity and socio-economics; their influences on the farming regime
It was not possible to obtain adequate data on the land management and/or ecological characteristics of farms before the household became pluriactive (El-lis, 1994) which would have allowed an examination in the sequence of any alterations in management di-rectly due to pluriactivity. Further, with the mean age of non-pluriactive households being greater than those of pluriactive farms, the effect of education and peer opinions on farming cannot be teased apart from the influence of pluriactivity. The differentiation in age between non-pluriactive and pluriactive farm house-holds agrees with research in other areas of Britain
(e.g. Nalson, 1968; Gasson, 1988). Non-pluriactive farms were also, on average, larger farms with more labourers (agreeing with Gasson, 1988; Shucksmith et al., 1988; Bateman and Ray, 1994). The stability of a larger capital base of such farms also economically separates such farms from their younger counterparts. Therefore, the possibility exists that the land use and management characteristics of the farm may have al-ready existed before involvement in pluriactivity. For example, farms with off-farm work may have already been managing less intensively than other farms be-fore gaining off-farm employment because of a low income to the farm. Of course, time spent away from the land as a result of off-farm work may enhance the effect of a less intensive management regime.
4.2. Botanical differences
130 N.E. Ellis et al. / Agriculture, Ecosystems and Environment 76 (1999) 121–134
Fig. 6. The Redundancy Analysis (RDA) between the socio-economic and pluriactivity variables with plant species data, for all farms. (a) The strength of each variable is positively related to the length of the arrow. The abbreviations are defined in Table 2. (b) The positioning of each species in relation to the variables in (a). See the appendix for full specie names.
differences in the botanical composition of the swards may have resulted from a cumulative effect of the small variations in the various facets of management. Collected management data may also have been too
Fig. 7. The Redundancy Analysis (RDA) between the land management variables with plant species data, for all farms. (a) The strength of each variable is positively related to the length of the arrow. The abbreviations are defined in Table 2. (b) The positioning of each species in relation to the variables in (a). See the appendix for full specie names.
sown species whereas pluriactive farms contained fur-ther species, farms with off-farm work associated with the most. When it is considered that the sown grasses
P. pratense andDactylis glomerata were more often
found on the non-pluriactive farms (the younger pluri-active farmers relying more on particular variants of
132 N.E. Ellis et al. / Agriculture, Ecosystems and Environment 76 (1999) 121–134
species per quadrat between non-pluriactive and pluri-active farms is greater than at first appears.
4.3. Grassland context
In contrast to other beef-producing areas of Britain, Grampian is very intensive. In relation to other British grasslands, these swards were young (more than half were under 4 years) but were in receipt of average lev-els of N (Hopkins et al., 1988). With the 4 m2quadrats containing between 4–11 species, no sward can be de-scribed as ‘species-rich’, a term which has been ap-plied to grasslands containing at least 20 species per 1 m2(e.g. Grime, 1973). Mesotrophic grasslands used
for hay production in northern England have recorded
between 15 and 22 species per 0.0625 m2(Smith and
Rushton, 1994). The reason for the low botanical di-versity is, in part, a result of the historical management of the land as Scottish farmers were known to reseed their pastures before 1940 (Stamp, 1946) in contrast to the English who only began to reseed their pastures after the plough-up grant had been introduced in 1939 (Stapledon, 1939). Such reseeding and long-term agri-cultural improvement impoverishes the soil of seeds of semi-natural species (e.g. Bekker et al., 1997). Also fewer species occur in the northern reaches of the British Isles than in the south (Perring and Walters, 1982) and few non-agricultural habitats (which har-bour potential grassland colonisers) are found within Grampian farmland (Ellis, 1994). Therefore the dif-ferences in species richness between non-pluriactive farms and pluriactive groups may be more exagger-ated elsewhere in the UK and Europe.
5. Conclusions
In conclusion, the above discussion indicates that the relationships described in Fig. 1 are true: the species composition of grass fields is determined di-rectly and primarily by land management and only secondly by the characteristics of the farm and house-hold. Considering the land management alone, the greatest influence on species composition was the reseeding regime with, less significantly, the propor-tion of sheep grazed fields and applied N. In terms of the farm household characteristics and farming involvement, a greater rate of reseeding and
pro-portionately more fields used for cattle (i.e. a more generally intensive farming regime) were associated with non-pluriactive farms.
6. Policy implications
Younger farmers have been associated with in-creased intensification, usually through the succes-sion of the farm (e.g. Munton and Marsden, 1991). Older farmers in certain areas of the European Com-munity (the Mediterranean countries and Central France) are particularly associated with traditionally extensive agriculture (Baldock, 1994). Yet this study shows that the younger farmers were tending to farm less intensively than the older farmers whilst also being involved in non-agricultural enterprises, even ahead of such encouragement given through the EC agri-environmental package in 1992 (Regulation No. 2078/92). Proposed rural development measures for the establishment of young farmers and early retire-ment, therefore, appear to be compatible with the encouragement of less intensive farming in regions like Grampian. A partial explanation of this may be the higher level of education enjoyed by the younger generation which not only gave them the skills to be-come involved in pluriactivity but also increased their awareness of the economic and environmental costs of over-excessive management. The educational as-pect may be as important a measure as any proposed rural development.
Further measures to encourage rural development specifically directed at on-farm diversification still re-quire to be carefully assessed as this study indicates little difference in the botanical composition of grass fields between the On-farm group and non-pluriactive farms. Direct support for on-farm leisure activities, marketing and processing (without cross-compliance measures) may raise income levels with the possibil-ity of affording to increase management intenspossibil-ity else-where on the farm. However, financial support to farm businesses for extensive grazing patterns as well as payments for environmental goods (such as tradition-ally grazed meadows) appear to be ecologictradition-ally and socially beneficial for most farms but will have great-est ecological effect where land has not already expe-rienced many years of intensive farming.
Acknowledgements
This project was funded by the Economic and Social Research Council. Gratitude is given to the farmers who gave time to this project and for allowing access to their land, and to Emma Edwards-Jones and Alice Broom who helped on the field surveys. We thank Colin Barr and Dr. David Howard for providing access to the Institute of Terrestrial Ecology’s Land Class database. We also thank Ron Smith and Tim Sparks for statistical advice and, in particular, Tim Sparks for help with SAS.
Appendix A
Overall, 105 vascular and bryophyte species were identified. However, for visual clarity in the figures, not all species are shown. Nomenclature of vascular species follows Stace (1991) and of bryophytes Wat-son (1981).
Baldock, D., 1994. Some European policy issues. In: Bignal, E.M., McCracken, D.I., Curtis, D.J. (Eds.), Nature Conservation and Pastoralism. Joint Nature Conservation Committee, Peterborough, pp. 104–109.
Bateman, D., Ray, C., 1994. Farm pluriactivity and rural policy: some evidence from Wales. J. Rural Stud. 10, 1–13. Bekker, R.M., Verweij, G.L., Smith, R.E.N., Reine, R., Bakker,
134 N.E. Ellis et al. / Agriculture, Ecosystems and Environment 76 (1999) 121–134
Bignal, E.M., McCracken, D.I., 1996. Low-intensity farming systems in the conservation of the countryside. J. Appl. Ecol. 33, 413–424.
Bryden, J., 1994. Interaction between farm households and the rural community effects of non-agricultural elements in farm household decision making on farming systems. In: Dent, J.B., McGregor, M.J. (Eds.), Rural and Farming Analysis: European Perspectives.CAB International, Wallingford, pp. 243–254. Bunce, R.G.H., Barr, C.J., Clarke, R.T., Howard, D.C., Lane,
A.M.J., 1996. Land classification for strategic ecological survey. J. Environ. Manage. 47, 37–60.
Corcoran, K., Dent, J.B., 1994. Education and Extension: a perpetuating paradigm for success. In: Dent, J.B., McGregor, M.J. (Eds.), Rural and Farming Analysis: European Perspectives. CAB International, Wallingford, pp. 255–268. Cox, G., Lowe, P., Winter, M., 1989. The farm crisis in Britian. In:
Goodman, D. (Ed.), The International Farm Crisis. Macmillan, pp. 113–134.
Edmond, H., Crabtree, J.R., 1994. Regional variation in Scottish pluriactivity: the socio-economic context for different types of non-farming activity. Scott. Geogr. Mag. 110, 76–84. Edmond, H., Corcoran, K., Crabtree, J.R., 1993. Locational access
to markets for pluriactivity. J. Rural Stud. 9, 339–349. Ellis, N.E., 1994. Farmland Ecology and the Uptake of
Non-agricultural Activities by Farm Households. Ph.D. Thesis, University of Edinburgh, Edinburgh.
Fuller, R.M., 1987. The changing extent and conservation interest of lowland grasslands in England and Wales: A review of grassland surveys 1930–1989. Biol. Conserv. 40, 281–300. Gasson, R., 1988. The Economics of Part-time Farming. Longman
Scientific and Technical.
Grime, J.P., 1973. Competitive exclusion in herbaceous vegetation. Nature Lond. 242, 344–347.
Hopkins, A., 1988. Distribution and management of grassland in the United Kingdom. In: Park, J.R. (Ed.), Environmental Management in Agriculture. Belhaven Press, London, pp. 178–185.
Hopkins, A., Matkin, E., Ellis, J., Peel, S., 1985. South-west England grassland survey 1983. 1. Age structure and sward composition of permanent and arable grassland and their relation to manageability, fertiliser nitrogen and other management features. Grass Forage Sci. 40, 349–359. Hopkins, A., Wainwright, J., Murray, P.J., Bowling, P.J., Webb,
M., 1988. 1986 survey of upland grassland in England and
Wales: changes in the structure and botanical composition since 1970–1972 in relation to grassland management and physical features. Grass Forage Sci. 43, 185–198.
Munton, R.J., Marsden, T.K., 1991. Occupancy change and the farmed landscape: an analysis of farm-level trends 1970–1988. Environ. Plann. A. 23, 499–510.
Munton, R.J., Whatmore, S.J., Marsden, T.K., 1989. Part-time farming and its implications for the rural landscape: A preliminary analysis. Environ. Plann. A. 21, 523–536. Nalson, J.S., 1968. Mobility of Farm Families: A Study of
Occupational and Residential Mobility in an Upland Area of England. Manchester University Press, Manchester.
Payne, R.W., Lane, P.W., Ainsley, A.E., Bicknell, K.E., Digby, P.G.N., Hordin, S.A., Leech, P.K., Simpson, H.R., Todd, A.D., Verner, P.J., White, R.P., 1987. GENSTAT 5, Committee of the Statistics Department, Rothamsted Experimental Station. Clarendon Press, Oxford.
Perring, F.H., Walters, S.M., 1982. Atlas of the British Flora. Thomas Nelson, London.
SAS Institute, 1985. SAS User’s Guide: Statistics. Version 5. SAS Institute, Cary, NC, USA.
Shucksmith, D.M., Bryden, J., Rosenthall, P., Short, C., Winter, M., 1989. Pluriactivity, farm structures, farm structures and rural change. J. Agric. Econ. 40, 345–360.
Smith, R.S., Rushton, S.P., 1994. The effects of grazing management on the vegetation of mesotrophic (meadow) grassland in Northern England. J. Appl. Ecol. 31, 13–24. SOAFD, 1992. Farm Income in Scotland 1990/1991. Scottish
Office Agriculture Food and Fisheries Department, Edinburgh. Stace, C., 1991. New Flora of the British Isles. Cambridge University Press. Stace, C., 1991. New Flora of the British Isles. Cambridge University Press, Cambridge.
Stamp, L.D., 1946. The Land of Britain and How it is Used. Longmans, Green and Co. London.
Stapledon, R.G., 1939. The Plough-up Policy and Ley Farming. Faber and Faber, London.
Ter Braak, C.J.F., 1988. CANOCO - a FORTRAN program for canonical community ordination by [partial][detrended] [canonical] correspondence analysis, principal components analysis and redundancy analysis (version 2.1). Technical report to the Ministry of Agriculture and Fisheries, Wageningen, The Netherlands.