ASSESSMENT OF LARGE SCALE LAND COVER CHANGE CLASSIFICATIONS AND
DRIVERS OF DEFORESTATION IN INDONESIA
A. Wijayaa,* , R. A. Sugardiman, Budihartob, A. Tosianib, D. Murdiyarsoa,c, and L.V. Verchota aCenter for International Forestry Research, Situ Gede, Bogor Barat 16115, Indonesia
bDirectorate General of Forestry Planning, Ministry of Forestry, Jakarta, Indonesia
cDepartment of Geophysics and Meteorology, Bogor Agricultural University (IPB), Bogor, 16115, Indonesia *Corresponding author: [email protected]
THEME: Forests, Biodiversity and Terrestrial Ecosystems (BIOD theme). This is an invited presentation to be presented at the special session of “Trends in operational land cover mapping”, which has been approved by the Technical Program Committee and the chairs of the sessions are Konrad Wessels (CSIR, South Africa) and Brice Mora (GOFC-GOLD/Wageningen University, The Netherlands)
ABSTRACT:
Indonesia possesses the third largest tropical forests coverage following Brazilian Amazon and Congo Basin regions. This country, however, suffered from the highest deforestation rate surpassing deforestation in the Brazilian Amazon in 2012. National capacity for forest change assessment and monitoring has been well-established in Indonesia and the availability of national forest inventory data could largely assist the country to report their forest carbon stocks and change over more than two decades. This work focuses for refining forest cover change mapping and deforestation estimate at national scale applying over 10,000 scenes of Landsat scenes, acquired in 1990, 1996, 2000, 2003, 2006, 2009, 2011 and 2012. Pre-processing of the data includes, geometric corrections and image mosaicking. The classification of mosaic Landsat data used multi-stage visual observation approaches, verified using ground observations and comparison with other published materials. There are 23 land cover classes identified from land cover data, presenting spatial information of forests, agriculture, plantations, non-vegetated lands and other land use categories. We estimated the magnitude of forest cover change and assessed drivers of forest cover change over time. Forest change trajectories analysis was also conducted to observe dynamics of forest cover across time. This study found that careful interpretations of satellite data can provide reliable information on forest cover and change. Deforestation trend in Indonesia was lower in 2000-2012 compared to 1990-2000 periods. We also found that over 50% of forests loss in 1990 remains unproductive in 2012. Major drivers of forest conversion in Indonesia range from shrubs/open land, subsistence agriculture, oil palm expansion, plantation forest and mining. The results were compared with other available datasets and we obtained that the MOF data yields reliable estimate of deforestation.
Keywords: forest cover, land cover change, deforestation, deforestation drivers
1. INTRODUCTION
Tropical deforestation contributes significantly to Greenhouse Gasses (GHG) emissions as major driver of global warming (Margono et al., 2014). Deforestation estimate and its associated carbon emissions from tropical deforestation is highly uncertain due to limited data availability. The Intergovernmental Panel on Climate Change (IPCC) has noted that deforestation data of those tropical regions is highly uncertain with possible error as much as 50% (Achard et al., 2002). Of about 15% of remaining world’s tropical forest ecosystem present in Southeast Asia region (Stibig et al., 2014). Compared to other tropical humid ecosystems of the world, Insular Southeast Asia experienced the highest deforestation for over the last decade, especially in the 1990’s (Achard et al., 2002; Miettinen et al., 2011). This certainly affects the magnitude of carbon emissions from this particular region. Recent study found that from 2000 to 2005 Southeast and South Asia regions had the highest carbon emissions in the tropics of about 0.5 Pg C/year, which combined emissions from deforestation, peat drainage and peat fires (Harris et al., 2012). Compared with other countries in the tropics, Indonesia’s forest cover is the third largest in the world after Brazil and Democratic Republic of Congo. However, Indonesia experiences from the
highest deforestation rate surpassing deforestation in the Brazilian Amazon in 2012 (Margono et al., 2014). Besides, Indonesia possesses the largest tropical peatlands globally, which are staggeringly converted to agriculture (mainly oil palm plantation) and other land uses. Land clearing from burning practices are common for many regions in Indonesia, which accumulate more carbon emissions, especially for peat burning. Emissions from forestry and peatlands contribute to 60% of total national emissions in Indonesia for the last decade (Ministry of Environment, 2010)
National capacity for forest monitoring, on the other side, has been well-established and the availability of national forest inventory data could largely assist the country to report their forest carbon stocks and change over the last decade (Mora et al., 2012). The country has benefited from different international donors and bilateral agreements, such as with Norwegian Government which pledged up to one billion USD to support REDD+ readiness and implementation aiming at reducing carbon emissions from land use, land use change and forestry sectors (LULUCF).
To assess the achievement of emissions reductions target under REDD+ scheme, a country should estimate carbon emissions The International Archives of the Photogrammetry, Remote Sensing and Spatial Information Sciences, Volume XL-7/W3, 2015
36th International Symposium on Remote Sensing of Environment, 11–15 May 2015, Berlin, Germany
This contribution has been peer-reviewed.
projection which is compared against the actual emissions upon implementation of emissions reduction programs. For land use change and forestry sectors, this measure is defined as forest reference emissions levels/forest reference levels (FREL/FRL). Although Indonesia promised to reduce emissions to 26 – 41% by 2020 (Julian Caldecott et al., 2011), but to date the country has not yet announced their national FREL/FRL to international community. Time series information on forest cover change and emissions attributed those changes are required to set up FREL/FRL estimate. The availability of improved land cover data over the course of 1990 – 2012 generated by the Ministry of Forestry is potentially useful and important as a basis of activity data for calculating national/sub-national FREL/FRL. Thus, this work has objectives to: 1)assess deforestation estimate using this
most recent land cover data, 2)identify drivers of forest cover
change between 1990 and 2012, and 3) analyse forest cover
change trajectories in the country.
2. DATA AND METHODS 2.1 Land cover classification approaches
Directorate General of Forestry Planning under Ministry of Forestry (MoF) has started the acquisition of Landsat 5 (Landsat Thematic Mapper/TM) and Landsat 7 (Landsat Enhanced Thematic Mapper Plus/ETM+) satellite images since early 90’s. These data are combined together with new generation of Landsat 8 (Landsat Data Continuity Mission/LDCM) sensor launched in 2013. National Aeronautics and Space Agency in Indonesia (LAPAN) is currently responsible for collecting and pre-processing satellite imageries before it will be used by different government agencies for generation of various thematic information, e.g. Ministry of Forestry may use the data to produce forest change cover maps.
Currently the MoF has been refining national land cover classification map back from 1990 to 2013, and plan to update deforestation data over more than two decades using the updated land cover data. The national land cover maps is produced based on multi-stage visual observations and on-screen digitizing of mosaic Landsat TM/ETM+ data and since 2013 it also make use of Landsat LDCM to generate information of 23 major land cover/land use types over the entire country (Indonesian Ministry of Environment and Forestry, 2014; Margono et al., 2014; Ministry of Forestry, 2009; Romijn et al., 2013). Of about 217 Landsat TM/ETM+ scenes are required each year to cover the entire Indonesian Archipelago. It does not include those Landsat scenes which cannot be used due to extensive cloud cover coverage. The agency has been collecting and archiving more than 10,000 scenes Landsat imageries from the entire country dated back from early 90’s onwards, as to produce mosaics of cloud free images around 1,200 Landsat scenes are required each year
This process is time-consuming and labor intensive involving MoF personnel’s from district and provincial levels to manually interpret and digitize the satellite imageries, The MoF experts at national level are responsible to assessing the quality assurance and consistency of consolidated land cover maps. The accuracy assessment takes place mainly in the areas dominated with forest/vegetation cover using higher spatial resolution satellite imageries. Field check is conducted each year to confirm actual land cover types, for the areas which are subject to rapid land cover change and have no satellite coverage caused by long term cloud cover. Additional maps of logging concessions,
timber-and estate crop plantations were also used to assist the verification of the land cover data.
Historically, the visual interpretation processes of satellite data initiated by the MoF to generate consistent information on forest cover and change have started in 1989 using aerial photos as the main data source, and from 1990 onwards the processes have implemented various satellite sensors, including Landsat (30 m resolution), SPOT vegetation (1 km resolution) and MODIS (250 m resolution) data. Following the policy to make Landsat data freely available for public, the MoF initiated additional efforts to update national land cover maps information having benefits from more complete archive data of Landsat satellite data. Following minimum mapping unit of the MoF land cover data, forest is defined as areas with size of 6.25 ha and covered by trees with minimum 30% of canopy cover and minimum height of 5 meter. Forest definition applied in the study includes natural forests on mineral soil (upland forest), peat swamp forest and mangrove forest. Thus, deforestation is defined as conversion or loss of natural forests to other land uses for longer period, due to natural or human induced disturbance.
There are six forest classes in the MoF land cover map, namely intact and secondary upland forests, intact and secondary peat swamp forests, intact and secondary mangrove forests; whereby conversion of one of these forest classes to another non-forest land use is considered as deforestation. Several important non-forest land uses, among others, include non-forest plantations, estate crops and oil palm plantations, upland farming and rice field, settlement areas, and other non-utilized lands including shrubs, open land, swampy bush and savanna.
2.2 Accuracy assessment of land cover data
Accuracy assessment was conducted in two-folds. First, independent validation of MOF land cover data using ground data was undertaken by the Ministry, and the accuracy of confusion matrices yields 88% of accuracy for all 23 land cover categories, and the accuracies increased to 98% when only forest/non-forest land categories were evaluated (Ministry of Forestry, 2012). Second, we aggregated the MOF land cover map into forest/non-forest classes and compared with existing data generated from semi-automatic classification approaches (LAPAN, 2014; Margono et al., 2014). The agreement of forest cover map of MOF data and University of Maryland data (Margono et al., 2014) was higher than 90%, whereas comparing the data with INCAS deforestation estimate (LAPAN, 2014), the agreement was 78%, which show at some extent the reliability of visual interpretation technique adopted by the MOF in generating multi time-series land cover map at national scale.
2.3 Forest cover change and drivers of deforestation analysis
We followed the approach of Romijn, et al (2013) by aggregating 23 land cover/land use types of the MOF land cover data into several sub-classes to analyse proximate causes of deforestation. Time series analysis of post-forest land use are useful to indicate direct activities that cause deforestation (Wijaya et al., 2012). this recent, however, has managed to use more recent and improved dataset that has gone through several stages of quality control to check for consistency and the data is currently available for the period of 1990, 1996, 2000, 2003, 2006, 2009, and 2012. The
data is also available for viewing purpose
Figure 1 Decision tree of forest trajectories analysis
2.4 Forest change trajectory analysis approach
Forest change trajectories analysis basically follows the forest transition (FT) theory to classify countries/regions into four categories based on forest cover percentage and rate of deforestation (Hosonuma et al., 2012). Following the FT theory, forested regions may fall into one of these categories: high forest low deforestation (HFLD), high forest high deforestation (HFHD), low forest high deforestation (LFHD) and low forest low deforestation (LFLD) (Da Fonseca et al., 2007).
Following the FT category, HFLD is suggested for those regions which fall into pre forest transition phase, whereas at the other end the LFLD region describes post forest transition regions. In this study, the LFLD region is expanded into late- and post- forest transition phase to improve the clarity. The unit of trajectories analysis is first administration level (i.e. 33 provinces), because Indonesian landscape is relatively large and consists of several groups of islands, which may fall in different stages of forest transition. The percent of forest cover and rate of forest loss were calculated for each province and for each time step (e.g. 1990-2000, 2003-2006, etc.). Mean values of the two variables for each time step were used as a threshold to label each province into particular FT category. Decision tree workflow of FT analysis is developed and described in Figure 1.
3. RESULTS AND DISCUSSION
3.1 Forest cover dynamics
The land cover change data over past 22 years showed that the extent of forests in 2012 of about 92 Mha, markedly lower than in 2000 (~100 Mha) and from 1990 (113 Mha) (Table 1). This explains decreasing deforestation rate from 1.27 Mha/year in the 1990’s to 0.67 Mha/year in the 2000’s (Figure 2). The episode of extreme drought season in 1997/1998 which leads to huge forest fires and forest loss can be captured from the datasets. We found in total 8.9 Mha or 2.2 Mha annually of forest loss from 1996 – 2000. This estimate was significantly higher than the rate of deforestation from other periods observed in this study.
Although deforestation rate were decreasing from 1990 – 2000 to 2000 – 2012, the data showed an increase of deforestation rate over the last 12 years, from 0.60 Mha/year in 2000 – 2006 to 0.74 Mha/year in 2006 – 2012. While the extent of secondary upland forest was relatively the same over the entire study period
(around 38 Mha), deforestation of upland forest was primarily attributed to the loss of 12 Mha of intact forests, which is almost equal to the size of New York State.
The most striking finding is probably from the loss of peat swamp forest ecosystem. Of about 40 percent of this ecosystem were deforested and converted into another land use from 1990 to 2012. This estimate is associated with the loss of 1.1 Mha (17%) of intact peat swamp forest and 6.8 Mha (50%) of secondary peat swamp forest.
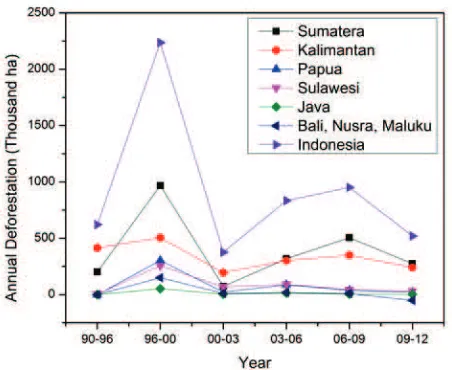
Figure 2 Annual deforestation estimate across main Islands of Indonesia
Comparing distribution of natural forest stocks across different Islands of Indonesia (Table 2), we found Sumatera and Kalimantan had major contributions to shape national deforestation over the past two decades. From 1990 to 2012 Indonesia lost in total 18.3% (20.7 Mha) of its forests; this was associated with deforestation in Sumatera and Kalimantan, which contributed to 41.5% (8.6 Mha) and 37.5% (7.8 Mha) of total national deforestation. Our observation also found that Sumatera lost more than 40% (forest stocks decline from 21 Mha to 12.5 Mha) of natural forest cover, much higher than the average of national deforestation; whereas 22% of Kalimantan forests were cleared between 1990 - 2012 (forest stocks decline from 35 Mha to 27.5 Mha).
The International Archives of the Photogrammetry, Remote Sensing and Spatial Information Sciences, Volume XL-7/W3, 2015 36th International Symposium on Remote Sensing of Environment, 11–15 May 2015, Berlin, Germany
This contribution has been peer-reviewed.
Table 2 Extent of forest stocks across Main Island of Indonesia from 1990 to 2012
Forest stocks 1990 1996 2000 2003 2006 2009 2012
(× 1000 ha) Area % Area % Area % Area % Area % Area % Area %
Forest stocks 1990 1996 2000 2003 2006 2009 2012
This study found higher deforestation estimate compared to recent study by Margono, et.al (2014) which estimated 6.02 Mha (i.e. 0.5 Mha/year) of total forests loss from 2000 – 2012. We found similar results as compared to Stibig, et.al (2014) that estimated tropical deforestation using systematic sampling approaches of remotely sensed data (Landsat data, 30 m spatial resolution) and reported 1.15 Mha and 0.82 Mha of annual deforestation during 1990’s and 2000’s periods. Another study by Miettinen, et.al (2011) reported slightly higher estimate of 0.88 Mha of annual deforestation during 2000 – 2010 period applying moderate resolution of MODIS satellite (i.e. spatial resolution of 500 m).
3.2 Analysis of drivers of deforestation
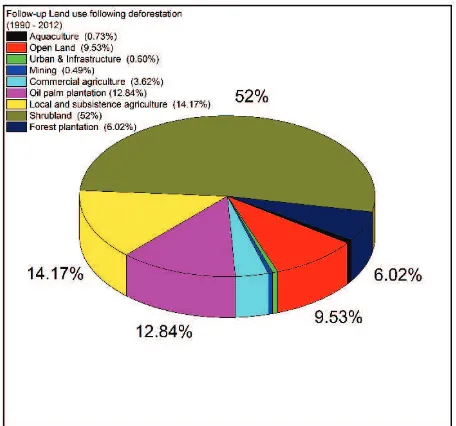
This study found during the 1990’s period (1990-2000) of about 48% (5.8 Mha) of forests were converted as shrublands, whereas 15.6% (1.8 Mha) and 14.5% (1.7 Mha) of the forests were deforested, due to subsistence agriculture activities and for the expansion of estate crops (mainly oil palm, sometimes mixed with rubber plantations). In the recent decade (2000-2012) of about 52% (4.5 Mha) of forests were converted to shrubland and 16.5% (1.4 Mha) forests were deforested as open land (Figure 3). This is an interesting finding, since general assumption believes that deforestation is a trade-off for development, and the good balance between them should be well-managed. Our analysis using 22 years of national land cover change data noted that it is not a common case for Indonesia, where large portions of former forestlands were in dormant stage of development for longer period. Time series analysis of land cover change data from different time intervals (i.e. 3, 6, 9 and 12 years combinations) confirmed those findings showing that shrublands and open land categories took up 52% – 81% (ca. 300 – 680 thousand hectares annually) of total post-forest land use for each time interval from 1990 – 2012.
Subsistence agriculture, oil palm plantations, and plantation forests contributed to 14%, 13% and 6% of total land use after deforestation, respectively (Figure 3). Mean proportion of oil palm, subsistence agriculture and forest plantations areas acquired from natural forests conversion was approximately 30% - 40% across study period, whereas the rest of those plantations were cultivated on non-forest lands. The fact that more than 50% of post-forest land use were shrubs or open land, is the evidence that natural forests loss in Indonesia were not immediately used for economic uses, which can be considered not productive.
Figure 3 Follow up land use after deforestation 1990 - 2012
3.3 Forest change trajectory analysis
The results of forest trajectories analysis (Figure 4) based on forest cover percentage and rate of deforestation estimate disaggregated at province level (Total 33 provinces) show that 4 out of 8 provinces in Sumatera were in mid-transition stage (low forest cover, high deforestation), whereas provinces in Java and Bali were mostly in post-transition stage (< 25% natural forest cover, regeneration stage). We noticed that most provinces in Sulawesi (except South Sulawesi), Maluku, Nusa Tenggara and Papua were still in pre-transition stage (high forest cover, low deforestation), mainly due to relatively less development of these regions compared to other regions. The provinces in Kalimantan interestingly were transitioning in different stages; for example, East Kalimantan province was in the pre-transition phase, West and Central Kalimantan provinces were in the early transition phase, and South Kalimantan province was in the mid-transition phase.
Figure 4 Forest transition trajectory across main Islands in Indonesia, and indicated REDD+ pilot province (with dots shading) The International Archives of the Photogrammetry, Remote Sensing and Spatial Information Sciences, Volume XL-7/W3, 2015
36th International Symposium on Remote Sensing of Environment, 11–15 May 2015, Berlin, Germany
This contribution has been peer-reviewed.
We also found 11 provinces selected as REDD+ pilot province by Indonesian REDD+ Agency early 2013 were classified, as pre-, early- or mid-transition periods. These provinces altogether accumulated of about 80% (72.5 Mha out of 92 Mha) of forest cover in 2012 and among those were experiencing high deforestation and forest degradation over the last two decades, which makes them are more important for payment for performance programs for reducing land based carbon emissions, such as REDD+ initiative. Reducing emissions from these 11 province may potentially reduce total emissions in 2020 by 26 – 41%, as a commitment of Indonesiaa to combat climate change.
CONCLUSION
Indonesia lost 18.3% (20.7 Mha) of forest cover from 1990 – 2012; this was mainly due to deforestation in Sumatera and Kalimantan, which contributed to 41.5% (8.6 Mha) and 37.5% (7.8 Mha) of total national deforestation. Of about 40 percent of tropical peat swamp forests were deforested and converted into another land use during this period, and this is associated with the loss of 1.1 Mha (17%) of intact peat swamp forest and 6.8 Mha (50%) of secondary peat swamp forest. We also found during the 1990’s period (1990-2000) of about 48% (5.8 Mha) of forests were converted as shrublands, whereas 15.6% (1.8 Mha) and 14.5% (1.7 Mha) of the forests were deforested, due to subsistence agriculture activities and for the expansion of estate crops. The 11 provinces selected as REDD+ pilot province were classified, as pre-, early- or mid-transition periods. These provinces altogether accumulated of about 80% (72.5 Mha out of 92 Mha) of forest cover in 2012 and among those were experiencing high deforestation and forest degradation over the past two decades.
ACKNOWLEDGEMENTS
This work is possible with collaboration between Directorate General of Forestry Planning, Ministry of Forestry of Indonesia and Center for International Forestry Research (CIFOR). The authors gratefully acknowledge the Ministry of Forestry in Jakarta, Indonesia, for providing the land cover maps of Indonesia for the years 1990, 2000, 2003, 2006, 2009, 2011, 2012. The study was supported by NORAD and AusAID within CIFOR’s Global Comparative Study on REDD+ project. First author would like to thank to the German Aerospace Center (Deutsches Zentrum fuer Luft- und Raumfahrt/DLR) for providing travel grants to attend and participate in the 36thsession of ISRSE 2015 in Berlin.
REFERENCES
Achard, F., Eva, H.D., Stibig, H.-J., Mayaux, P., Gallego, J., Richards, T., Malingreau, J.-P., 2002. Determination of Deforestation Rates of the World's Humid Tropical Forests.
Science 297, 999-1002.
Da Fonseca, G.A.B., Rodriguez, C.M., Midgley, G., Busch, J., Hannah, L., Mittermeier, R.A., 2007. No forest left behind. PLoS
Biology 5, 1645-1646.
Harris, N.L., Brown, S., Hagen, S.C., Saatchi, S.S., Petrova, S., Salas, W., Hansen, M.C., Potapov, P.V., Lotsch, A., 2012.
Baseline map of carbon emissions from deforestation in tropical regions. Science 336, 1573-1576.
Hosonuma, N., Herold, M., De Sy, V., De Fries, R.S., Brockhaus, M., Verchot, L., Angelsen, A., Romijn, E., 2012. An assessment
of deforestation and forest degradation drivers in developing countries. Environmental Research Letters 7.
Indonesian Ministry of Environment and Forestry, 2014. Digital Land Cover and Land Use Map of Indonesia for Years 1990 -2013. Directorate General of Forestry Planning , Ministry of
Environment and Forestry of Indonesia, Jakarta, Indonesia.
Julian Caldecott, Mochamad Indrawan, Pasi Rinne, Mikko Halonen, 2011. Indonesia - Norway REDD+ Partnership: First Evaluation of Deliverables. Gaia Consulting Ltd in association
with Creature Ltd, Helsinki, Finland, p. 41.
LAPAN, 2014. The Remote Sensing Monitoring Program of Indonesia's National Carbon Accounting System: Methodology and Products - Version 1. LAPAN - IAFCP, Jakarta, Indonesia.
Margono, B.A., Potapov, P.V., Turubanova, S., Stolle, F., Hansen, M.C., 2014. Primary forest cover loss in Indonesia over 2000-2012. Nature Clim. Change advance online publication.
Miettinen, J., Shi, C., Liew, S.C., 2011. Deforestation rates in insular Southeast Asia between 2000 and 2010. Global Change
Biology 17, 2261-2270.
Ministry of Environment, 2010. Indonesia Second National Communication under the United Nations Framework Convention of Climate Change (UNFCCC). Ministry of
Environment of Indonesia, Jakarta, p. 200.
Ministry of Forestry, 2009. Forestry Statistics of Indonesia 2008.
Indonesian Ministry of Forestry, Jakarta, Indonesia.
Ministry of Forestry, 2012. Improvement of Land Cover Change Estimate of Indonesia for Year 2011 (In Indonesian). Directorate
General of Forestry Planning, Ministry of Forestry, Jakarta, Indonesia, p. 40.
Mora, B., Herold, M., de Sy, V., Wijaya, A., Verchot, L.V., Penman, J., 2012. Capacity development in national forest monitoring: Experiences and progress for REDD+. Center for
International Forestry Research (CIFOR), Bogor, Indonesia.
Romijn, E., Ainembabazi, J.H., Wijaya, A., Herold, M., Angelsen, A., Verchot, L., Murdiyarso, D., 2013. Exploring different forest definitions and their impact on developing REDD+ reference emission levels: A case study for Indonesia.
Environmental Science and Policy 33, 246-259.
Stibig, H.J., Achard, F., Carboni, S., Raši, R., Miettinen, J., 2014.
Change in tropical forest cover of Southeast Asia from 1990 to 2010. Biogeosciences 11, 247-258.
Wijaya, A., Romijn, E., Rahman, S., Herold, M., Verchot, L., 2012. Assessment of deforestation drivers and national carbon emissions using remote sensing analysis, Geoscience and