HYDROLOGIC AND FEATURE-BASED SURFACE ANALYSIS FOR TOOL MARK
INVESTIGATION ON ARCHAEOLOGICAL FINDS
Kristóf Kovács a,b, *, Klaus Hanke a a
Institute of Basic Sciences in Civil Engineering, Surveying and Geoinformation Unit, University of Innsbruck,
Austria - (kristof.kovacs, klaus.hanke)@uibk.ac.at
b
Institute of Geography, Georg-August-Universität Göttingen, Germany - kkovacs@gwdg.de
Commission V, WG V/2
KEY WORDS: Laser Scanning, Tool Mark, Surface Analysis, Edge Detection, GIS, Archaeology
ABSTRACT:
The improvement of detailed surface documentation methods provides unique tool mark-study opportunities in the field of archaeological researches. One of these data collection techniques is short-range laser scanning, which creates a digital copy of the object’s morphological characteristics from high-resolution datasets. The aim of our work was the accurate documentation of a Bronze Age sluice box from Mitterberg, Austria with a spatial resolution of 0.2 mm. Furthermore, the investigation of the entirely preserved tool marks on the surface of this archaeological find was also accomplished by these datasets.
The methodology of this tool mark-study can be summarized in the following way: At first, a local hydrologic analysis has been applied to separate the various patterns of tools on the finds’ surface. As a result, the XYZ coordinates of the special points, which represent the edge lines of the sliding tool marks, were calculated by buffer operations in a GIS environment. During the second part of the workflow, these edge points were utilized to manually clip the triangle meshes of these patterns in reverse engineering software. Finally, circle features were generated and analysed to determine the different sections along these sliding tool marks. In conclusion, the movement of the hand tool could be reproduced by the spatial analysis of the created features, since the horizontal and vertical position of the defined circle centre points indicated the various phases of the movements. This research shows an exact workflow to determine the fine morphological structures on the surface of the archaeological find.
* Corresponding author.
1. INTRODUCTION
1.1 Motivation
The high-resolution survey of archaeological finds by short-range laser scanner systems arshort-ranges exact research opportunities in the field of archaeological science, since numerous spatial analysis methods can be developed on the created digital models of the archaeological objects (Hanke et al. 2010). The aim of our work was the accurate short-range laser scanner documentation of the entirely preserved Bronze Age sluice box from Mitterberg, Austria within the HiMAT (History of Mining Activities in the Tyrol and Adjacent Areas - Impact on Environment and Human Societies) project. After the data acquisition, the sliding tool marks on the surface of this archaeological find could be visualised by different methods in the Geographical Information System (GIS) environment (Kovács et al. 2011). This paper presents the recent results of this tool mark-study, which could help to understand the characteristics of the Bronze Age manufacturing as well.
1.2 Related Works
In the second half of the 1990’s, photographic documentation was applied to investigate the tool marks on the surface of archaeological finds (Sands 1997). In a more recent research, high-resolution laser scanning measurements were used to survey the impressions of hand tools on archaeological woods. These objects were stored in various conditions and the deformation differences were investigated after these
preservation processes. The three-dimensional (3D) analysis of the tool marks on these finds was accomplished by surface comparison in digital environment (Lobb et al. 2010). The analysis of cut marks on bones was carried out in another significant archaeological research project, which has provided a workflow to classify the various cut marks by statistical methods (Domínguez-Rodrigo et al. 2012).
The key issues of the archaeological tool mark-studies, such as the precise documentation and identification processes, have been also investigated extensively by forensic scientists, since the research challenges are similar in both areas. In most crime cases, the tool marks are analysed by the visual comparison of the signatures such as in this tool mark identification report of a mattock to a clod of soil (Clark 2011). On the other hand, more precise documentation method was applied by a 3D digital microscope in a knife tool mark research project, where the characteristics of these tool marks were accurately measured and analysed in digital environment (Shaw et al. 2011). The fundamental requirements of tool marks-studies have been defined in the field of forensic science during the last years: The specification of the individual characteristic number, which could offer a positive identification at the evidence investigation; the requirement of an exactly defined evaluation workflow and the results of these exact studies must be repeatable as well (Committee on Identifying the Needs of the Forensic Sciences Community, National Research Council 2009). For these reasons, the research objectives of this hydrologic and feature-based tool mark-study can be summarized as follows: user-independent tool mark
recognitions; implementation of automated techniques for computer-based 3D analysis and comparison of tool marks.
2. DATA ACQUISITION AND DIGITAL MODELLING OF THE ARCHAEOLOGICAL FIND
During a high-resolution documentation process, measurement errors can be caused by the smallest surface deformation of the object. Therefore, the external conditions, such as humidity and temperature, must stay constant during the data collection. The excavated parts of the Bronze Age sluice box were accurately cleaned and stored by the archaeologist in a mine entrance area, where the important climate requirements could remain constant. Here, the short-range laser scanning survey was also accomplished with a FARO® ScanArm. The selected resolution of this data collection was 0.2 mm. Thirty-one wooden objects were documented during three days and the volume of the raw dataset was in the order of 440 million points.
The first step of the post processing workflow was the automatic registration of point clouds. The various sides of the wooden boards were adjusted in a common reference system by “Best Fit Alignment” technique in InnovMetric PolyWorks® Software. The maximum residual between the overlapping areas of these wooden boards was less than 1 mm after the registration process.
After the triangulation of the registered point clouds, the small holes of the created 3D models have to be post-processed manually, since the wood cracks of the archaeological finds could not be completely surveyed. Finally, the accurate 3D models of this unique object were created and the high-resolution documentation of the sluice box was successfully achieved (Figure 1).
Figure 1. The high-resolution documentation and virtual reconstruction of the sluice box
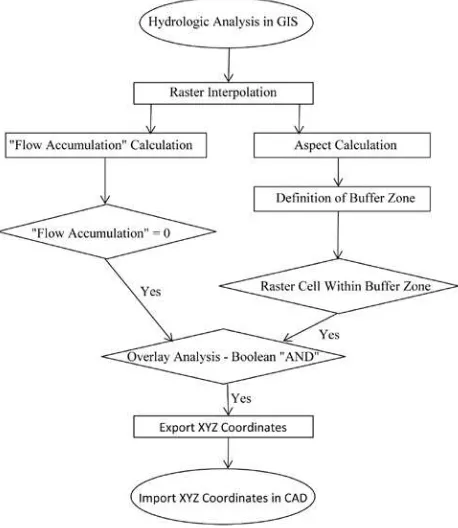
After the digital modelling, one wooden board of this archaeological find was selected by the archaeologists, where the sliding tool marks were most significant. This test area with tool marks was investigated in GIS and in Computer-Aided Design (CAD) environment (Figure 2).
Figure 2. Flowchart of hydrologic analysis in GIS
3. HYDROLOGIC ANALYSIS OF THE TOOL MARKS IN GIS
3.1 Raster Interpolation and Determination of “Flow Accumulation” Parameters
The micro-relief characteristics of an archaeological find are similar to the standard Earth’s surface features such as mountain ridges and valleys. For this reason, the GIS-based surface analysis can offer novel tool mark-study opportunities. Based on the point cloud, a raster model was calculated in ESRI ArcGIS® Software as the comparison of this raster can provide major solutions for the automated detection of surface changes in digital environment. IDW (Inverse Distance Weighted) interpolation was applied and the selected raster size of the test area was 0.5 mm. The definition of a projection system was insignificant in this case since a flat area of the wooden board was investigated in GIS.
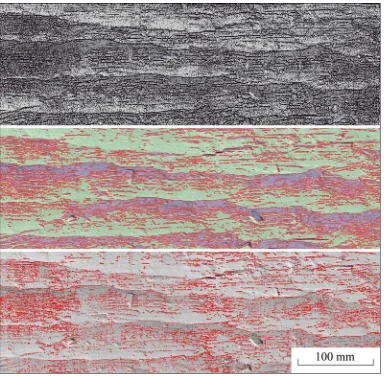
“Flow Accumulation” parameters were determined by the “Spatial Analyst Tools” during the first part of the workflow (Figure 3a). The raster cells with null “Flow Accumulation” values represent the local maxima of the surface model. This technique is usually used to recognise the mountain ridges in Earth sciences.
3.2 Calculation of Aspect Parameters and Buffer Zones
During the second part of the workflow, the number of these raster cells was reduced by various buffer operations, since beside the edges of the sliding tool marks, the borderlines of the small wood cracks were selected by the “Flow Accumulation” method as well.
At first, the special aspect parameters of the raster model were defined by the evaluation of two main slope directions. The idea of this concept is the following: The edge lines of the sliding tool marks are running parallel on the surface of the archaeological find. For this reason, the direction of these edge
lines implied the two main categories during this aspect calculation, and the boundary of aspect changes between these two categories can represent the edges of the tool marks. Finally, 0.5 mm width buffer zones were created along these boundaries (Figure 3b).
3.3 Overlap Analysis of the Different Partial Results
Boolean operator tools were used to compare the results of the “Flow Accumulation” and the aspect calculations during the third part of the workflow. The raster cells were selected by
overlap analysis. Two requirements were defined: The “Flow Accumulation” value is null and the raster cell is located within the buffer zone of the aspect boundary (Figure 3c).
As a result, the raster cells, which also represent the edges of sliding tool marks, were effectively calculated by the applied automated techniques during the complete workflow in GIS environment. Finally, the XYZ coordinates of these points were exported and in CAD systems post-processed by feature-based analysis methods.
Figure 3abc. a (top) - The local maxima of the surface model indicated by black points; b (middle) - The aspect calculations and the buffer zones indicated by red shapes; c (bottom) – The selected raster cells indicated by red points after the overlap analysis
4. FEATURE-BASED INVESTIGATION OF THE TOOL MARKS IN CAD
The concept of this feature-based analysis of the sliding tool marks can be summarized as follows: Various paths of the hand tool could be identified and separated by the results of the presented GIS-based methods. After the segmentation of these paths, different standard features as lines, polylines and circles were defined along these patterns and the movements of the hand tool could be determined by the spatial analysis of these created features.
A single tool mark is mentioned as a facet in the field of archaeological science (Sands 1997). The path of a sliding tool mark can contain numerous facets. The identification of the
various facets was the aim of this feature-based tool mark study. After all, the determination of the boundary lines and the border regions between these objects could be carried out by the study of the hand tool movements.
4.1 Segmentation of the Tool Mark’s Paths and Calculation of Cross-Sections
At first, the results of the GIS-based surface analysis, the XYZ coordinates were imported in InnovMetric PolyWorks® Software and the various paths of the hand tool were manually separated by the help of these coordinates on the mesh model of the archaeological find.
After this step, cross-sections were created at 5 mm steps along these separated patterns. Finally, circle features were generated
by a best-fit process in Rhinoceros 3D® Software as the form of these cross-sections constituted circular arcs.
4.2 Investigation of Circle Features and Definition of Hand Tool Movement’s Trajectory
The aim of this investigation was the calculation of a standard circle feature, which can be alike to the shape of hand tool. Altogether 279 circle features were analysed along a test area of a tool mark’s path and the average radius value (195 mm) was calculated from the different radius datasets. Finally, new circle features were generated by automated techniques from this mean radius value along the test path.
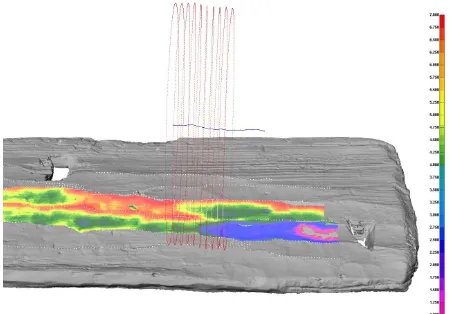
The centre points of these new circles were compared in the CAD system. The horizontal and vertical position of these points indicated the various phases of the hand tool’s movements and the lengths of the facets could be detected by the variation of these circle centre points (Figure 4).
After the connection of these circle centre points by line features, the trajectories of hand tool’s movement were visualised by these polylines (Figure 5). The vertical differences between the neighbouring circle centre points were less than 1 mm along this test path. Within an investigated facet, approximately 2 mm vertical change has been measured. This result correlated with the comparison between this test path and a horizontal reference plane and with the distance changes among the endpoints of the cross-sections as well.
Figure 4. The comparison between sliding tool marks and horizontal reference plane (in mm) is visualised together with the results of hydrologic and feature-based surface investigations
5. DISCUSSION AND FUTURE WORKS
The above described methodology provided outstanding tool mark-study opportunities as the significant characteristics of the sliding tool marks and their facets could be identified in this case study. On the other hand, the predefined research opportunities as the implementation of automated techniques during the recognition and evaluation process must be improved, because some working steps of this presented workflow were carried out manually. For example, the variation of raster calculations can offer further methods for the enhanced detection of the tool mark’s edge lines in GIS.
5.1 Modification of Raster Calculations in GIS
The goal of this modification process was the reduction of the calculated XYZ coordinates that could represent the edge lines of the sliding tool marks.
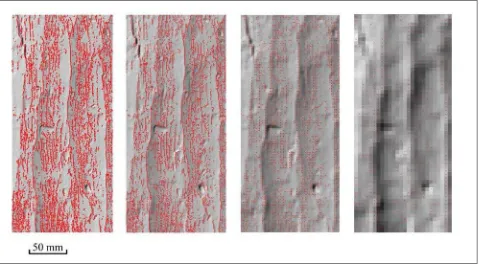
At first, an approximately 13 cm wide and 75 cm long test area was selected from the original point cloud on the investigated wooden board and the volume of the raw dataset was almost 1.3 million points in this region. The various interpolations with four different raster sizes were accomplished in GIS environment. The locale maxima of these different raster models were analysed and the “Flow Accumulation” values were compared in ArcGIS® Software. The size of buffer zones along the boundary lines was also simultaneously changed in
these raster models and the exported XYZ coordinates were calculated by the overlay analysis of these new hydrologic- and aspect calculations (Table 1).
In summary, the raster calculations with 1 and 2 mm raster sizes provided better results since the edge lines of the sliding tool marks could be accurately identified by using less number of exported coordinates. On the other hand, several significant changes of the surface model were detected after the interpolation with 5 mm raster size as the edge lines of tool marks were smoothed in this case (Figure 6).
The above defined research objectives cannot be achieved only by the enhancement of GIS analysis techniques. For this reason, the use of hand tool standards can also offer additional opportunities to improve the methodology of tool mark’s identification and evaluation.
Interpolations (Raster Size)
Number of Selected Raster Cells ("Flow Accumulation" = 0)
Number of Exported XYZ
Coordinates IDW Interpolation
(0.5 mm) 168423 48490
IDW Interpolation
(1 mm) 41626 21241
IDW Interpolation
(2 mm) 10020 7572
IDW Interpolation
(5 mm) 1660 1537
Table 1. The results of different raster calculations
Figure 5. The visualisation of a hand tool movement’s trajectory - top view of the trajectory within an investigated facet (left), side view of the trajectory after the vertical scaling for better visualisation (right)
Figure 6. The comparison of different raster calculations – interpolations with various raster sizes (from left to right: 0.5 mm, 1 mm, 2 mm, 5 mm) and their hillshade models with the exported XYZ coordinates (red points)
5.2 Utilisation of the Hand Tool Standards in the Tool Mark Studies
The concept of this application is the definition of standard shapes for the head of hand tools and these predefined forms should help to recognise and classify the patterns of tool marks. The ASME (American Society of Mechanical Engineers) has categorised the various hand tools in the ASME B107 Standard documents. On the other hand, the precise geometry descriptions of the hand tool’s categories are unachievable since several production differences can be noticed between the manufacturing companies.
Based on the archaeological interpretation, the investigated Bronze Age sluice box was constructed most likely by a Bronze Age axe or adze (the head is rotated by 90 degrees like a hoe). The performance requirements and the terminology of the recent produced axe hand tools are described in the ASME B107.400-2008 Striking Tools Standard document (The American Society of Mechanical Engineers 2009). The accurate comparison of geometric characteristics between the Bronze Age axe and the recent produced hand tools is unfeasible. However, the geometry of the axe head’s shapes could be visually compared and the exact terminology could be implemented in this research. The cutting edges of the blades are usually similar to a circular arc. Therefore, circles could be generated during the applied feature-based surface analysis method.
The spatial analysis of the main types of hand tools and their forms must be implemented in the future works since these predefined standard shapes could help to improve the tool marks recognition and evaluation in GIS and CAD environments.
6. CONCLUSIONS
The applied hydrologic and feature-based methods offer a novel workflow to determine the fine morphological structures on the surface of the sluice box. In this tool mark-study, the movement of the hand tool along the sliding tool marks could be investigated by the spatial analysis of the created circles. The horizontal and vertical position of the circle centre points indicated the various phases of the movements and the facets could be separated by these techniques as well.
The automated evaluation of the sliding tool mark’s edges could be improved by the modification of the raster calculations in GIS environment since the number of exported XYZ coordinates were significantly reduced after the variation in raster size. The application of the hand tool standards has helped to classify the different hand tools and the terminology could also be implemented in this study.
In additional, the presented workflow may have an important impact on the archaeological researches since the characteristics of the Bronze Age manufactures, such as the shape of the used hand tool and the sizes of the various facets could be analysed by this methodology.
ACKNOWLEDGMENT
The work is generously supported by the Austrian Science Fund (FWF Project F3114) in the framework of the Special Research Program “History of Mining Activities in the Tyrol and Adjacent Areas” (SFB HiMAT) as well as by the Austrian province governments of Tyrol, Vorarlberg and Salzburg, the Autonomous Province Bozen-South Tyrol, Italy, the local
authorities of the mining areas concerned, the TransIDEE foundation and the University of Innsbruck, Austria.
REFERENCES
Clark, M. D., 2011. Toolmark Identification of a Mattock to a Clod of Soil from a Grave. Journal of Forensic Sciences, Vol. 56, No. 1.
Committee on Identifying the Needs of the Forensic Sciences Community, National Research Council., 2009. Strengthening Forensic Science in the United States: A Path Forward. National Academies Press.
Domínguez-Rodrigo M., Pickering, T. R., Bunn, H. T., 2012. Experimental study of cut marks made with rocks unmodified by human flaking and its bearing on claims of w3.4-million-year-old butchery evidence from Dikika, Ethiopia. Journal of Archaeological Science, Vol. 39, Issue 2, pp. 205-214.
Hanke, K., Hiebel, G., Kovács, K., Moser, M., 2010. Documentation Challenges in an International and Interdisciplinary Research Project. Proceedings of the ISPRS Commission V Midterm-Symposium in Newcastle upon Thyne, UK. In: The ISPRS International Archives of Photogrammetry, Remote Sensing and Spatial Information Sciences, Vol. XXXVIII, Part 5.
Kovács, K., Hanke K., Moser, M., 2011. GIS-based surface analysis of archaeological finds. Proceedings of the ISPRS Workshop '3D-ARCH 2011'"3D Virtual Reconstruction and Visualization of Complex Architectures" In: The International Archives of Photogrammetry, Remote Sensing and Spatial Information Sciences, Vol. XXXVIII-5/W16.
Lobb, M., Krawiec, K., Howard, A. J., Gearey, B. R., Chapman, H. P., 2010. A new approach to recording and monitoring wet-preserved archaeological wood using three-dimensional laser scanning. Journal of Archaeological Science, Vol. 37, Issue 12, pp. 2995-2999.
Sands, R., 1997. Prehistoric Woodworking: The analysis and interpretation of Bronze and Iron Age toolmarks. University College London: Archetype Press.
Shaw, Kai-Ping., Chung, Ju-Hui., Chung, Fang-Chun., Tseng, Bo-Yuan., Pan, Chih-Hsin., Yang, Kai-Ting., Yang, Chun-Pang., 2011. A Method for Studying Knife Tool Marks on Bone. Journal of Forensic Sciences, Vol. 56, No. 4.
The American Society of Mechanical Engineers., 2009. ASME B107.400-2008 Striking Tools.