A COMPARISON OF TWO DIFFERENT APPROACHES OF POINT CLOUD
CLASSIFICATION BASED ON FULL-WAVEFORM LIDAR DATA
Jin-hu Wang a,b, *, Chuan-rong Li a, Ling-li Tanga, Mei Zhoua, Jing-mei Li a
a Academy of Opto-Electronics, Chinese Academy of Sciences. Dengzhuang South Road, Beijing b
The Graduate University of Chinese Academy of Sciences, Yuquan Road, Beijing. [email protected]
Commission III, WG III /2
KEY WORDS: full-waveform LiDAR; Decomposition, Unsupervised classification, point cloud, space transform, EM algorithm
ABSTRACT:
In this paper, two different point cloud classification approaches were applied based on the full-waveform LiDAR data. At the beginning, based on the full-waveform LiDAR data, we decomposed the backscattered pulse waveform and abstracted each component in the waveform after the pre-processing of noise detection and waveform smoothing. And by the time flag of each component acquired in the decomposition procedure we calculated the three dimension coordination of the component. Then the
components’ waveform properties, including amplitude, width and cross-section, were uniformed respectively and formed the Amplitude/Width/Section space. Then two different approaches were applied to classify the points. First, we selected certain targets and trained the parameters, after that, by the supervised classification way we segmented the study area point. On the other hand, we apply the IHSL colour transform to the above space to find a new space, RGB colour space, which has a uniform distinguishability among the parameters and contains the whole information of each component in Amplitude/Width/Section space. Then the fuzzy C-means algorithm is applied to the derived RGB space to complete the LiDAR point classification procedure. By comparing the two different segmentation results, which may of substantial importance for further targets detection and identification, a brief discussion and conclusion were brought out for further research and study.
* Corresponding author. This is useful to know for communication with the appropriate person in cases with more than one author. 1. INTRODUCTION
Airborne Laser Scanning (ALS) is an active remote sensing technique providing direct range measurements between laser scanner and objects, has witnessed an alternative source for acquisition of ranging data in last decade. Range is determined directly from the signal runtime measurements. And airborne LiDAR deliver fast and reliable representation of landscape by Georeferencing. Depending on the geometry of illuminated surfaces, several backscattered echoes can be recorded for a single pulse emission. This showed the potential of multi-echo LiDAR data for urban area analysis and building extraction (Frueh et al., 2005). While many others study the LiDAR backscattered pulse intensity (Charaniya et al., 2004) and combine LiDAR and multispectral data(Secord et al., 2006) for classification. Since 2004, new commercial ALS systems called full-waveform (FW) LiDAR have emerged with the ability to record the complete waveform of the backscattered 1D-signal. Each echo in this signal corresponds to an encountered object. Thus, in addition to range measurements, further physical properties of objects included in the diffraction cone may be revealed by analysing the shape of backscattered waveforms. A detailed state-of-the-art on full-waveform topographic LiDAR can be found in Mallet et al., 2009. In urban scenes, the potential of such data has been barely investigated, in addition to the geometry to detect vegetation areas (Gross et al., 2007; Wagner et al., 2008).
In this paper, two different point cloud classification approaches were applied based on the full-waveform LiDAR data. Firstly, the backscattered full-waveform LiDAR pulse waveform was decomposed and all components in the waveform were abstracted. Further, by the time flag of each component acquired in the decomposition procedure, three dimension coordinates of the components were calculated. Also,
the components’ waveform properties, including amplitude,
width and cross-section, were uniformed respectively to form the Amplitude/Width/Section space. After that two different approaches were applied to classify the points. On one hand, region of interest were selected and samples were trained to perform supervised classification. On the other hand, IHSL colour transform was introduced to transform the above space to find a new RGB colour space. Afterwards, the fuzzy C-means algorithm was applied to complete the LiDAR point classification procedure. By comparing the two different segmentation results, which may of substantial importance for further targets detection and identification, a brief discussion and conclusion were brought out for further research and study.
2. WAVEFORM DECOMPOSITION
In order to come to an analytical waveform properties solution, assuming that the scattering properties of a cluster of scatters can be described by Generalized Gaussian Function.
2
2
|
|
( )
exp(
)
2
t
f t
S
(1)whereSˆ is amplitude and
the standard deviation of the cluster. The cluster position is specified by
while
denote the shape of the component waveform. The targets backscattered pulse waveform is the superposition of echoes from scatters at different ranges. To abstract every components’ parameters contained in backscattered waveform, the Expectation Maximum algorithm is applied to accomplish the decomposition process. The EM algorithm was presented by Dempster、Laind and Rubin in 1977 to estimate the parametersInternational Archives of the Photogrammetry, Remote Sensing and Spatial Information Sciences, Volume XXXIX-B3, 2012 XXII ISPRS Congress, 25 August – 01 September 2012, Melbourne, Australia
from incomplete dataset (EM). As for the backscattered waveform decomposition, the procedure is as follow:
a): model parameters
initiation:
(0)j,
(0)j,
(0)j,
(0)j.
j
1,
…
k
,. Wherek
denote the components number in the backscattered waveform, and
(0)j is the weight of componentsj
in the waveform,
(0)j,
(0)j,
(0)j is specified as the parameters in model function respectively.Then likelihood function is computed according to the initiated parameters by the final likelihood function is computed as the waveform decomposition accomplishing criteria.
( 1) ( 1) ( 1) ( 1) ( 1)
In this paper, the components in backscattered waveform were modelled as generalized Gaussian function, and we take the curve fitting approach accomplished the decomposition procedure. And the corresponding results are four parameters, and here we just take amplitude, width and cross-section to form this space. We calibrated the scanner by using standard reflectance targets before flight and measured albedo of roads and roofs in the experiments region. The definitions of the three parameters are as follows respectively (Plataniotis et al.; Wolfgang et al., 2006).
Amplitude: 2 standard deviation of the echo pulse component
i
.Width: 2 2
,
2 p i 2 s i W s s s (10)
Where
s
idenotes the standard deviation of emitted pulse. Cross Section: 4 is the calibration constant.
Although the A/W/C parameter space could present a general distinguishability among different objectives and targets, there exists high correlation between the parameters. To a certain component, its Amplitude and Cross section are positive correlation, and has a related coefficient of 0.4-0.6 according to experiments, while the Width and Amplitude/Cross section have negative correlation, has an average related coefficient of -0.3. Thus, in order to make good use of the components parameters for point cloud classification, the A/W/C space is mapped to IHSL space to obtain a uniform distinguishability among all components and class.
3.2 Mapping to IHSL
Because of the parameters in A/W/C-S space have non-uniform distinguishability, this highly restrains the classification performance. In this part, the IHSL transformation is performed to map the original space parameters to HSV space. The relationships of the parameters are described as follows:
1
Then, inverse transformation is applied to the space and obtained the final space parameters for the classification.
0 (Bezdek,1981), and received extensive attention in colour image segmentation based on pixel(Castleman et al., 1996). The fuzzy C-means algorithm based on the minimization of C-means function, defined as
membership value of pixel k in cluster centre
i
, D is a squared ik inner-product distance norm given by2 ik k i
D x v (17), where
x k
k(
1, 2,...,
N
)
is the givenset of input data,
v i
i(
1,..., )
C
is the set of C cluster centres. The minimization of (11) can be solved by using the iteration International Archives of the Photogrammetry, Remote Sensing and Spatial Information Sciences, Volume XXXIX-B3, 2012XXII ISPRS Congress, 25 August – 01 September 2012, Melbourne, Australia
through the first order condition for stationary points of (16). The stationary points of (11) can be found by means of Lagrange multipliers, which is given by
2
1 1 1 1
( , , ) ( ) ( ) ( 1)
C N N C
m
m ik ik k ik
i k k i
J U V D
(18)Setting the gradients of Jm with respect toU, Vand equal to
0, when 2
0
ik
D andm1, theU , V would minimize only if
2 1
1
1
(
)
ik C
ik m
j jk
D
D
,
1
i
C
,1
k
N
, (19)And
1
1
( )
( )
N m ik k k
i N m ik k
x v
,
1
i C(20)Thus, we could simply apply the fuzzy C-means algorithm, by performing the iteration of (19) and (20).
4. CLASSIFICATION
Two different approaches were taken to perform the classification process, supervised and unsupervised classification.
4.1 Supervised classification
In the study area, the data has 538299 points and has a density of 1.2points/m2. Five typical types of objects, bare land, trees, houses, road and farm land, were selected and formed the training data and their properties were computed.
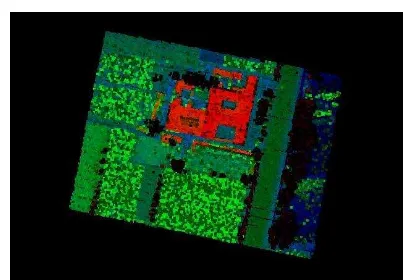
Figure 1: supervised point cloud classification result
The classification result is presented as in figure 1. The results shows that by the addition properties, that are the width, amplitude and cross-section of the backscattered waveform, objects of the same height but has different width and cross-section could easily distinguished. Also, object in neighbourhood spaces could also be separated by components’ intensity and width parameters and research an excellent classification performance. However, because of the correlation
among the parameters, which draws back the classification results.
4.2 Unsupervised classification
Figure 2. Unsupervised classification results
The correlation among the parameters was removed by the transform and the parameters were applied to the point cloud classification using Fuzzy C-Means algorithm. The classification result is shown in figure 2, which shows that low vegetation point could be classified and improve the classification performance.
5. CONCLUSION
The experiments in this paper shows that by using the additional parameters abstracted from full-waveform LiDAR, supervised classification approach could research good classification performance. Also, through IHSL transformation of the parameters, then the fuzzy C-means algorithm is applied to the derived new space to complete the LiDAR point classification procedure. By comparing the two different segmentation results, which may of substantial importance for further targets detection and identification, a brief discussion and conclusion were brought out for further research and study.
6. REFERENCES
A. Charaniya, R. Manduchi, and S. Lodha, “Supervised
parametric classification of aerial lidar data,” in Real-Time 3D Sensors and their use workshop, in conjunction with IEEE CVPR, 2004, p. 8p.
C. Frueh, S. Jain, and A. Zakhor, “Data Processing Algorithms for Generating Textured 3D Facade Meshes from Laser Scans and Camera Images,” International Journal of Computer Vision, vol. 61, no. 2, pp. 159–184, 2005.
C. Mallet and F. Bretar, “Full-waveform topographic lidar: State-of-the-art,” ISPRS Journal of photogrammetry & Remote Sensing, vol. 64, no. 1, pp. 1–16, 2009.
H. Gross, B. Jutzi, and U. Thoennessen, “Segmentation of tree
regions using data of a full-waveform laser,” in Symposium of ISPRS Photogrammetric Image Analysis (PIA), Munchen, Germany, sep 2007, ISPRS, vol. XXXVI Part(3/W49A).
J. Secord and A. Zakhor, “Tree detection in aerial lidar and
image data,” in ICIP, 2006, pp. 2317–2020.
K.R. Castleman, Digital Image Processing. Prentice Hall, Englewood Cliffs, NJ, USA, 1996 (Sec. 21.3).
International Archives of the Photogrammetry, Remote Sensing and Spatial Information Sciences, Volume XXXIX-B3, 2012 XXII ISPRS Congress, 25 August – 01 September 2012, Melbourne, Australia
K.N. Plataniotis, A.N. Venetsanopoulos, Color image processing and applications. Springer-Verlag Berlin Heidelberg 2000 (Sec. 1.8 and 6.2).
W. Wagner, M. Hollaus, C. Briese, and V. Ducic, “3D
vegetation mapping using small-footprint full-waveform airborne laser scanners,” International Journal of Remote Sensing, vol. 29, no. 5, pp. 1433–1452, 2008.
Wolfgang Wagner, Andreas Ullrich,Vesna Ducic, Thomas Melzer, Nick Studnicka. Gaussian decomposition and calibration of a novel small-footprint full-waveform digitizing airborne laser scanner, ISPRS Journal of Photogrammetry & Remote Sensing. 60 (2006) 100– 112
J.C. Bezdek, Fuzzy mathematics in pattern classification. Ph.D. Thesis, Cornel University, Ithaca, N.Y.
J.C. Bezdek, Pattern recognition with fuzzy objective function algorithms. Plenum Press, New York.
Wolfgang Wagner, Andreas Ullrich, Vesna Ducic, Thomas Melezer, Nick Studnicka. Gaussian decomposition and calibration of a novel small-footprint full-waveform digitizing airborne laser scanner. ISPRS Journal of Photogrammetry & Remote Sensing 60 (2006) 100– 112
7. ACKNOWLEDGMENTS
The authors would like to thank for the support from the National Natural Science Foundation of China (Grant No.40901177) and International Cooperation Project of
the Ministry of Science and Technology of the People’s
Republic of China (Grant No.2010DFA72290). International Archives of the Photogrammetry, Remote Sensing and Spatial Information Sciences, Volume XXXIX-B3, 2012
XXII ISPRS Congress, 25 August – 01 September 2012, Melbourne, Australia