ACHIEVING ECONOMIC BENEFITS THROUGH AGRICULTURAL
TRADE REFORMS IN INDONESIA
1Saktyanu Kristyantoadi Dermoredjo
Indonesian Center for Agricultural Socio Economic and Policy Studies Jl. A. Yani No. 70 Bogor 16161
ABSTRAK
Ekonomi Indonesia telah mencapai suatu perubahan bentuk yang luar biasa, yakni menjadi ekonomi modern yang diperkirakan mencapai pertumbuhan sebesar 6 persen. Untuk tetap mempertahankan pertumbuhan sebesar itu, diperlukan perbaikan ekonomi secara berkesinambungan seperti perdagangan bebas yang sesuai dengan kebijakan pemerintah. Tujuan dari tulisan ini adalah untuk mengkaji pengaruh ekonomi dari model program liberalisasi perdagangan bilateral seperti antara Australia dan Indonesia. Kerangka pikir tulisan ini didasarkan pada model ekuliberium dari GTAP (Global Trade Analysis Project). Hasil analisis menunjukkan bahwa pertumbuhan perdagangan antara Australia dan Indonesia akan memperoleh keuntungan dari pendapatan yang lebih tinggi dan adanya efisiensi dari alokasi sumberdaya. Dalam studi ini diketahui bahwa dari
pemotongan tarif perdagangan pertanian diperoleh efisiensi sebesar US$ 1,67 – 3,35 juta
dan peningkatan GDP sebesar US$ 3,55 – 7,08 juta. Hal ini menunjukkan bahwa
perdagangan bebas memberikan kontribusi dalam proses pertumbuhan ekonomi Indonesia.
Kata kunci : perdagangan bilateral, perdagangan pertanian
ABSTRACT
The Indonesian economy has achieved a remarkable transformation from an agricultural economy to a modern economy that is estimated to grow at a high rate of 6 per cent. Sustaining it requires the continual adoption of economic reforms. Part of it requires the adoption of freer trade practices in sectors of the economy where resources are retained due to large government assistance. This paper aims to examine the economy-wide effects of a bilateral agricultural trade liberalization program between Australia and Indonesia. The analytical framework adopted in this paper is a global general equilibrium model known as GTAP (Global Trade Analysis Project). Increasing the agricultural trade between Australia and Indonesia will lead to benefits arising from higher incomes and resource allocation efficiency. In this study, the removal of tariffs on agricultural imports
in Indonesia resulted in efficiency gains of US$ 1.67 – 3.35 million and GDP increase by
US$ 3.55 – 7.08 million. This shows that freer trade practices contribute to the economic
growth process in Indonesia.
Key words : agricultural trade, bilateral trade
1 This project was done in Australian Leadership Awards Fellowship 2007 Program,
INTRODUCTION
The Indonesian economy has achieved a remarkable transformation from an agricultural economy to a modern economy where manufacturing and services account for 85 per cent of the gross domestic product (GDP) through government programs that led to a better macroeconomic management and liberalization of the economy.
Currently, the economy is estimated to grow at a high rate of 6 per cent. Sustaining it requires the continual adoption of economic reforms. Part of it requires the adoption of freer trade practices in sectors of the economy where resources are retained due to large government assistance. Some of these sectors are agricultural in nature. For example, rice and sugar received substantial government support through technological assistance and import regulations. For some agricultural commodities, government policies emphasise self-sufficiency due to its importance in the diets of poor households. A case in point is rice.
The Indonesian self-sufficiency policy requires substantial resources. The total amount spent by the government on fertiliser, pesticide and irrigation subsidies alone amounted to US$725 billion in 1989. Subsidies led to excessive use of inputs that sometimes caused environmental damages. For example, the outbreak of a pesticide resistant brown planthopper species that affected rice production in 1986-87 was due to the excessive use of pesticides. Expansion of rice production in upland areas in Java caused annual soil erosion damages amounting to US$139.8 million (Barbier, 1989).
Allowing more agricultural imports from countries like Australia may lower the costs of the Indonesian agricultural self-sufficiency policy since resources can then be re-allocated to sectors where they are most profitable while consumers can purchase more diverse and cheaper goods. This paper aims to examine the economywide effects of a bilateral agricultural trade liberalization program between Australia and Indonesia.
The paper is organised in the following manner. The second section discusses the trade patterns between Indonesia and Australia. The third section presents the analytical framework used in estimating the economic effects of freeing agricultural trade in Indonesia and Australia. The fourth section provides the key modelling results of the study. Conclusions and other future issues are in the last section.
THE BILATERAL TRADE BETWEEN INDONESIA AND AUSTRALIA
0,00 100,00 200,00 300,00 400,00 500,00 600,00 700,00 800,00 900,00
1969 1970 1971 1972 1973 1974 1975 1976 1977 1978 1979 1980 1981 1982 1983 1984 1985 1986 1987 1988 1989 1990 1991 1992 1993 1994 1995 1996 1997 1998 1999 2000 2001 2002 2003 2004 2005
Indonesia Australia
grown to US$ 2.567 billion. Close to 40.77 per cent of the imports of Indonesia is accounted by agricultural products. Australia’s imports from Indonesia amounted to US$1.519 billion in 2000. It grew to US$2.228 billion in 2005. A large share of it are accounted by petroleum and forestry products that acccounted for 49.48 per cent in 2005.
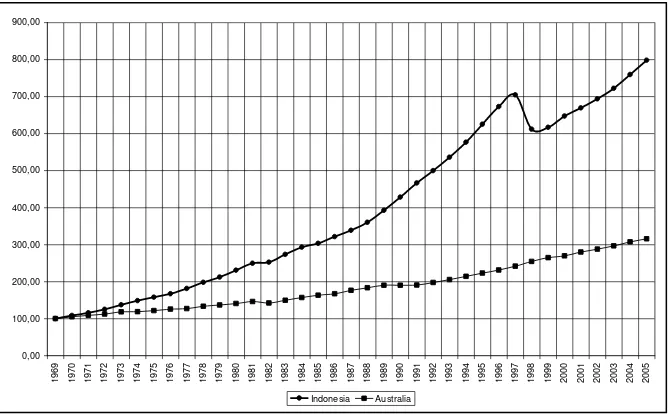
The continued growth experienced by both economies (see figure 1) means that the rising incomes of Indonesian and Australian consumers may increase their demand for more diverse and cheaper imported products. Also, Indonesia is experiencing resources moving from the agricultural sector to the manufacturing and service sectors. This results in the declining share of agriculture in the economy. The GDP share of agriculture fell from 49 per cent in 1970 to 13.08 per cent in 2005 while the shares of the non-agricultural sectors rose from 51 per cent to 86.92 per cent in 2005.
Figure 1. Relatively GDP of Indonesia dan Australia, 1969-2005 (1969=100)
With the re-allocation of resources from agriculture to the other sectors, the costs of producing some agricultural goods may increase as fewer factors of production becomes available to it and as innovative technological options such as the availability of modern rice varieties become scarce. Consequently, the competitiveness of Indonesia in producing agricultural products may be declining while it may be rising in the case of labour-intensive manufactures like textiles and garments.
0 100000 200000 300000 400000 500000 600000
Year
E
x
p
o
rt
V
a
lu
e
(
$
0
0
0
)
Cotton, not carded or combed. 535038,24 285826,56 218092,954 144108,834 121651,449 Total Plant-based fibers 535734,27 285826,56 218092,954 144108,834 121670,312
2001 2002 2003 2004 2005
0 100000 200000 300000 400000 500000 600000
2001 2002 2003 2004 2005
Year
E
x
p
o
rt
V
a
lu
e
(
$
0
0
0
)
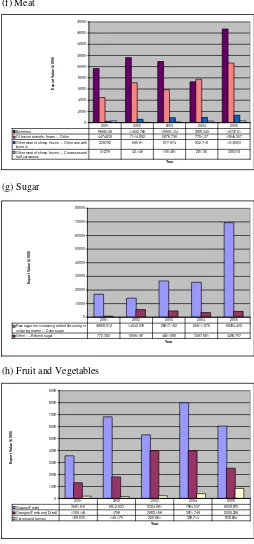
figures indicate that Australia is the leading exporter of agricultural products to Indonesia such as wheat, cotton, live animals and beef and dairy products. As shown in figures 2, wheat, dairy, fruit and vegetables, beef and live cattle imports from Australia are rising. The continued growth in incomes in Indonesia may partly be causing this pattern since demand for these products are highly sensitive to changes in it (Fabiosa, 2006; Andayani and Tilley, 1997; Fabiosa, 2005; and Hutasuhut et al., 2001).
However, to realise the benefits from trade, Indonesia and Australia must adopt freer trade practices. These will create opportunities for the availability of cheaper and differentiated goods relative to what domestic producers are selling currently.
(a) Cotton and Total Plant-based fibers
0
2001 2002 2003 2004 2005
Year
In powder, granules or other solid forms, of a fat content, by weight, not exceeding 1.5 %
33585,976 37790,06 18961,593 37421,483 36317,693 In powder, granules or other solid forms, of a fat
content, by weight, exceeding 1.5 % :-- Not containing added sugar or other sweetening matter
7398,908 8395,658 12461,479 15373,059 17534,195
Whey and modified whey, whether or not concentrated or containing added sugar or other sweetening matter
6539,345 5731,645 4492,3 11507,126 9706,482
In powder, granules or other solid forms, of a fat content, by weight, exceeding 1.5 % :-- Other
199,235 696,427 497,91 5423,71 36739,815 Fresh (unripened or uncured) cheese, including 7155,944 8032,902 5276,074 4103,227 3377,523 2001 2002 2003 2004 2005
0
Wheat or meslin flour. 13493,766 14715,865 18030,335 40184,018 54321,38 Total Food products nec 48195,363 39996,281 43300,668 106053,747 91880,545
2001 2002 2003 2004 2005
(c) Live Bovine Animals
(d) Dairy products
0
Boneless 9656,139 11602,766 10909,134 7288,345 16727,21 Of bovine animals, frozen :-- Other 4474,639 7114,852 5876,736 7751,27 10646,357 Other meat of sheep, frozen :-- Other cuts with
bone in
229,792 595,91 877,974 932,718 1318,553 Other meat of sheep, frozen :-- Carcasses and
half-carcasses
312,76 42,149 105,481 281,05 305,318
2001 2002 2003 2004 2005
0
Raw sugar not containing added flavouring or colouring matter :-- Cane sugar
16869,012 14042,576 26617,162 25611,875 69384,422 Other : ---Refined sugar 772,302 5566,167 4631,908 3367,681 4260,707
2001 2002 2003 2004 2005
0
Grapes (Fresh) 3561,613 6812,623 5304,901 7984,537 6038,876 Oranges (Fresh and Dried) 1309,145 1796 3982,156 3971,749 2526,226 Carrots and turnips 189,035 149,175 225,861 389,714 838,664
2001 2002 2003 2004 2005
(f) Meat
(g) Sugar
(h) Fruit and Vegetables
TRADE BARRIERS IN INDONESIA AND AUSTRALIA
In the case of Australia, trade impediments are low. The average tariff of Australia on agricultural and manufactured imports are 1.64 and 3.8 respectively. Indonesia has pursued substantial trade reforms in three decades: (1) from an inward looking import substitution strategy during the oil boom in the early 1970s, (2) to limited liberalization and deregulation in the early 1980s, and (3) extensive deregulation and liberalization after the end of oil boom in the mid 1980s.
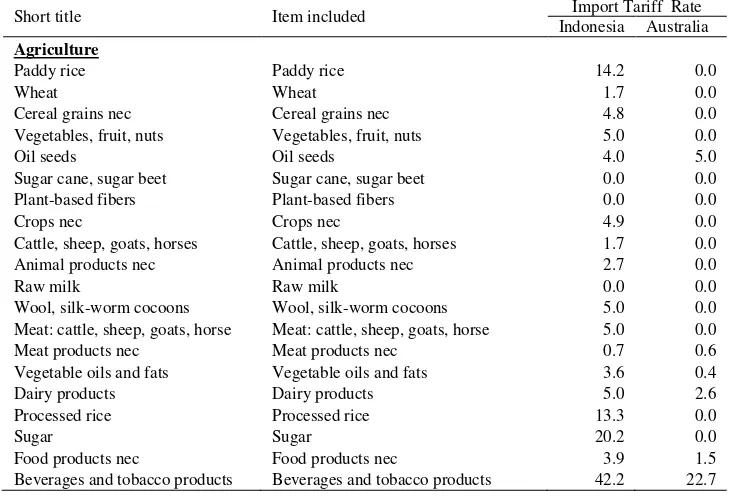
Indonesia has pursued substantial trade reforms since it joined the WTO and since the implementation of the structural reforms in 1997-98. For example, Bulog ceased to be the sole importer of agricultural products like rice and wheat. Applied tariffs on agricultural imports are low (5 per cent). The applied tariff rates used in this study are given in table 1.
As shown in table 1, Australia is providing full market access to foreign producers. This means that trade impediments in Australia are low. Indonesia’s tariff rate tend to be high for milled rice (31.3 per cent), sugar (42.2 per cent) and Beverages and tobacco products (42.2 per cent) while the rest of agriculture products ranges from 1.7 to 5 per cent. In contrast, Australia’s applied tariff rates in agriculture products are low with the exception of beverages and tobacco products (22.7 per cent).
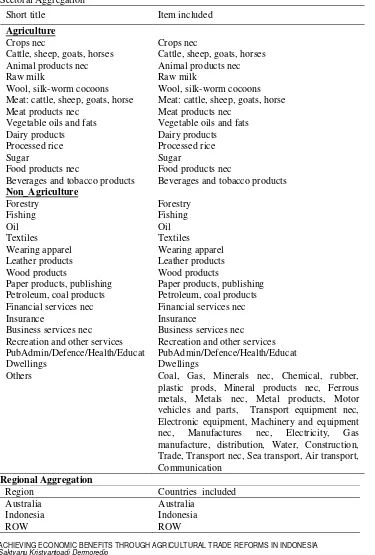
Table 1. Sectoral and Regional Aggregations
Short title Item included Import Tariff Rate
Indonesia Australia
Agriculture
Paddy rice Wheat
Cereal grains nec Vegetables, fruit, nuts Oil seeds
Sugar cane, sugar beet Plant-based fibers Crops nec
Cattle, sheep, goats, horses Animal products nec Raw milk
Wool, silk-worm cocoons Meat: cattle, sheep, goats, horse Meat products nec
Vegetable oils and fats Dairy products Processed rice Sugar
Food products nec
Beverages and tobacco products
Table 1. continued
Short title Item included Import Tariff Rate
Indonesia Australia
Non_Agriculture
Forestry Fishing Oil Textiles Wearing apparel Leather products Wood products
Paper products, publishing Petroleum, coal products Financial services nec Insurance
Business services nec Recreation and other services PubAdmin/Defence/Health/Educat Wearing apparel Leather products Wood products
Paper products, publishing Petroleum, coal products Financial services nec Insurance
Business services nec Recreation and other services PubAdmin/Defence/Health/Educat Dwellings
Coal, Gas, Minerals nec, Chemical, rubber, plastic prods, Mineral products nec, Ferrous metals, Metals nec, Metal products, Motor vehicles and parts, Transport equipment nec, Electronic equipment, Machinery and equipment nec, Manufactures nec, Electricity, Gas manufacture, distribution, Water, Construction, Trade, Transport nec, Sea transport, Air transport, Communication
Source: GTAP Database (2003)
ESTIMATING THE TRADE GAINS OF A UNILATERAL AGRICULTURAL TRADE LIBERALIZATION IN INDONESIA
For illustrative purposes, the following sections discuss the estimation of trade gains arising from a partial and full agricultural tariff liberalization in Indonesia and Australia.
Modelling the trade liberalization : The GTAP model
production, consumption, trade and investment decisions of representative producers and consumers in regions across commodity and service groupings.
Details of the GTAP model are provided in Hertel (1997). Its key features that are relevant to the study are the following. First, the model represents perfect competitive conditions. This means that the zero profit condition prevails, meaning all excess profits are eliminated by the unrestricted entry and exit of firms. Second, all production functions in the model are homogeneous and exhibit constant returns to scale. Production in each sector of the economy is represented by a nested CES (Constant Elasticity of Substitution) function. Each firm in the model uses a CES composite of domestic and imported intermediate inputs in fixed proportions with a CES composite of primary factors of production such as skilled and unskilled labour, land, capital and natural resources. Finally, demand relationships in the model use the constant differences in elasticities (CDE) which are calibrated to represent the differing income and price responses across commodities and regions. Goods demanded in the model are a CES composite of domestic and imported items.
The policy experiment was undertaken under the assumption of a long run model closure2. This means that the capital stock is endogenous and consequently,
freer trade begets more capital investments. There is perfect capital mobility in the model and capital will be re-allocated across the various sectors until the change in the rate of return on capital stock become equal across all regions (Nakajima, 2002). There will be two policy simulations, a partial 50 per cent and a 100 per cent reduction in the applied tariffs on agricultural imports in Australia and Indonesia. To model the impact of trade liberalization, the world economy is aggregated into 3 regions (Australia, Indonesia, Rest of the world-ROW) and 36 commodities. The commodities are seperated into agriculture and non-agriculture groupings (see table 2).
Table 2. Sectoral and Regional Aggregations
Sectoral Aggregation
Short title Item included
Agriculture
Paddy rice Wheat
Cereal grains nec Vegetables, fruit, nuts Oil seeds
Sugar cane, sugar beet Plant-based fibers
Paddy rice Wheat
Cereal grains nec Vegetables, fruit, nuts Oil seeds
Sugar cane, sugar beet Plant-based fibers
2 A long run model closures in GTAP : EXPAND is exogenous and qo(capital) is
Table 2. continued
Sectoral Aggregation
Short title Item included
Agriculture
Crops nec
Cattle, sheep, goats, horses Animal products nec Raw milk
Wool, silk-worm cocoons Meat: cattle, sheep, goats, horse Meat products nec
Vegetable oils and fats Dairy products Processed rice Sugar
Food products nec
Beverages and tobacco products
Non_Agriculture
Forestry Fishing Oil Textiles
Wearing apparel Leather products Wood products
Paper products, publishing Petroleum, coal products Financial services nec Insurance
Business services nec Recreation and other services PubAdmin/Defence/Health/Educat Dwellings
Others
Crops nec
Cattle, sheep, goats, horses Animal products nec Raw milk
Wool, silk-worm cocoons Meat: cattle, sheep, goats, horse Meat products nec
Vegetable oils and fats Dairy products Processed rice Sugar
Food products nec
Beverages and tobacco products
Forestry Fishing Oil Textiles
Wearing apparel Leather products Wood products
Paper products, publishing Petroleum, coal products Financial services nec Insurance
Business services nec Recreation and other services PubAdmin/Defence/Health/Educat Dwellings
Coal, Gas, Minerals nec, Chemical, rubber, plastic prods, Mineral products nec, Ferrous metals, Metals nec, Metal products, Motor vehicles and parts, Transport equipment nec, Electronic equipment, Machinery and equipment
nec, Manufactures nec, Electricity, Gas
manufacture, distribution, Water, Construction, Trade, Transport nec, Sea transport, Air transport, Communication
Regional Aggregation
Region Countries included
Australia Indonesia ROW
RESULTS
Macroeconomic effects
Overall, the GDPs of Australia and Indonesia increase through the bilateral cuts on agricultural imports. When tariffs are eliminated completely, Indonesia’s GDP grew by 0.005 per cent or US$ 7.07 million while that of Australia by 0.003 percent or US$10.8 million. While the gains are appear to be miniscule, this reflects largely the fact that the liberalizing sectors are not the dominant enterprises in the economy and that tariffs are generally low on average in both countries.
Welfare effects
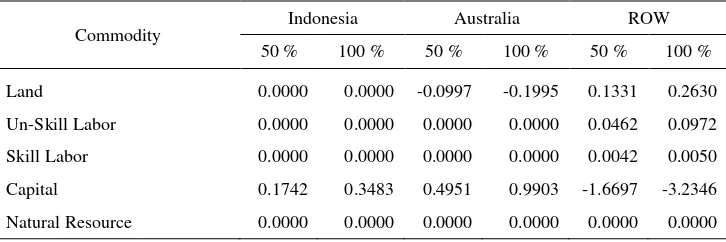
The welfare criterion used in GTAP is the equivalent variation (EV). It approximates the change in income at initial prices needed by the regional representative household to reach the level of welfare corresponding to the simulated tariff cuts. To determine the sources of welfare gains, the EV decomposition developed by Huff and Hertel (1997) was adopted in this paper. The largest gains for Indonesia arise from the increase in resource allocation efficiency. The gains from it range from US$1.63 to US$3.35 million for the 50 percent and 100 percent tariff cuts respectively. The highest tariff laden industry in Indonesia, which is the beverage and tobacco products and sugar industries were the main sources of the resource allocation efficiency gains (see table 3).
Also, as tariffs are reduced on agricultural imports, other sectors such as the labour intensive textile manufactures of the Indonesian economy expand as they receive resource transfers from them. The welfare gains of Australia emanate from favorable terms of trade changes. Higher prices for its exports occur as the Indonesian demand for agricultural products increases due to higher incomes.
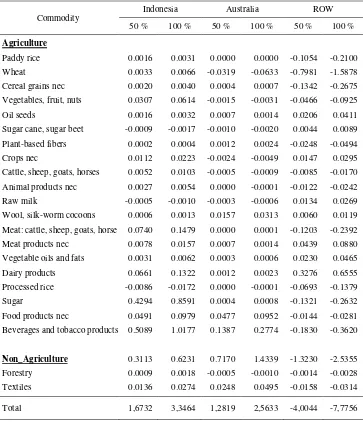
Table 3. Decomposition of the Regional Allocative Efficiency Effects by Commodity (US$ million)
Commodity Indonesia Australia ROW
50 % 100 % 50 % 100 % 50 % 100 %
Land
Un-Skill Labor
Skill Labor
Capital
Natural Resource
0.0000
0.0000
0.0000
0.1742
0.0000
0.0000
0.0000
0.0000
0.3483
0.0000
-0.0997
0.0000
0.0000
0.4951
0.0000
-0.1995
0.0000
0.0000
0.9903
0.0000
0.1331
0.0462
0.0042
-1.6697
0.0000
0.2630
0.0972
0.0050
-3.2346
Table 3. continued
Commodity Indonesia Australia ROW
50 % 100 % 50 % 100 % 50 % 100 %
Agriculture
Paddy rice Wheat
Cereal grains nec Vegetables, fruit, nuts
Oil seeds
Sugar cane, sugar beet
Plant-based fibers Crops nec
Cattle, sheep, goats, horses Animal products nec
Raw milk
Wool, silk-worm cocoons
Meat: cattle, sheep, goats, horse Meat products nec
Vegetable oils and fats Dairy products
Processed rice Sugar
Food products nec
Beverages and tobacco products
Non_Agriculture
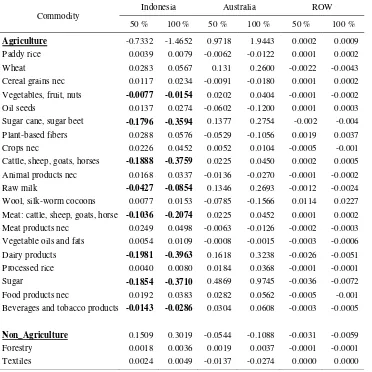
Table 4. Percent Change in Output by Commodity (%)
Commodity Indonesia Australia ROW
50 % 100 % 50 % 100 % 50 % 100 %
Agriculture
Paddy rice Wheat
Cereal grains nec Vegetables, fruit, nuts Oil seeds
Sugar cane, sugar beet Plant-based fibers Crops nec
Cattle, sheep, goats, horses Animal products nec Raw milk
Wool, silk-worm cocoons Meat: cattle, sheep, goats, horse Meat products nec
Vegetable oils and fats Dairy products Processed rice Sugar
Food products nec
Beverages and tobacco products
Non_Agriculture
Demand for Endowment
-0,7 -0,6 -0,5 -0,4 -0,3 -0,2 -0,1 0
%
Indonesia Australia
Indonesia -0,2302 -0,4604
Australia -0,3114 -0,6183
Tarif Cutting 50 % Tarif Cutting 100 %
-2 -1,5 -1 -0,5 0 0,5 1 1,5 2 2,5
%
Indonesia Australia
Indonesia -0,8243 -1,6432
Australia 1,0377 2,0756
Tarif Cutting 50 % Tarif Cutting 100 %
-2 -1,5 -1 -0,5 0 0,5 1 1,5 2 2,5
%
Indonesia Australia
Indonesia -0,8316 -1,6632
Australia 1,0478 2,0961
Tarif Cutting 50 % Tarif Cutting 100 %
(a) Land
(b) Un-skilled Labor
-2 -1,5 -1 -0,5 0 0,5 1 1,5 2 2,5
%
Indonesia Australia
Indonesia -0,8175 -1,6376
Australia 1,0693 2,139
Tarif Cutting 50 % Tarif Cutting 100 %
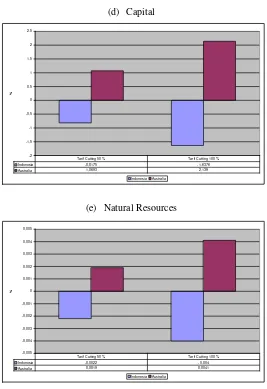
-0,005 -0,004 -0,003 -0,002 -0,001 0 0,001 0,002 0,003 0,004 0,005
%
Indonesia Australia
Indonesia -0,0022 -0,004
Australia 0,0019 0,0041
Tarif Cutting 50 % Tarif Cutting 100 %
(d) Capital
(e) Natural Resources
Figure 4. Impact of Free Trade Between Indonesia and Australia on Demand for Endowment
CONCLUDING REMARKS
Increasing the agricultural trade between Australia and Indonesia will lead to benefits arising from higher incomes and resource allocation efficiency. In this study, removal of tariffs on agricultural imports in Indonesia resulted in efficiency gains of US$ 1.67 – 3.35 million and GDP increase of US$ 3.55 – 7.08 million. This shows that freer trade practices contribute to the economic growth process, particularly in Indonesia, as viewed in terms of the analysis conducted in this paper.
REFERENCES
Andayani, R.M and Tilley, D.S. 1997, Demand and competition among supply resources:
The Indonesian fruit import market, Journal of Agricultural and Applied
Economics, vol. 29, No.2, pp. 279−289.
Barbier, E. 1989. Cash Crops, Foods, Crops, and Sustainability : The Case of Indonesia. World Development, vol. 17, no.6, pp. 879-895
Fabiosa, J.F. 2005, Growing Demand for Animal-Protein Source Products in Indonesia: Trade Implications, Working Paper 05-WP400, CARD, Iowa, Ames.
Fabiosa, J.F. 2006, Westernization of the Asian Diet: The Case of Rising Wheat Consumption in Indonesian, Working Paper 06-WP422, CARD, IOWA, Ames.
Hertel. T.W. 1997. Global Trade Analysis : Modeling and Applications. Cambridge University Press. New York.
Hutasuhut, M., Chang, H.S, Griffith, G., O’Donnel, C. and Doran, H. 2001, The Demand
for Beef in Indonesia: Implications for Australian Agribusiness, Working Paper No. 2001-4, University of New England, Armidale.
Kowaltcyzk, C. 2000, ‘Welfare and integration’, International Economic Review, vol. 41,
no.2, pp.483 – 492.
Nakajima, T. 2002. An Analysis of the Economic Effects of Japan-Korea FTA : Sectoral
Aspects. Economic Research Institute for Northeast Asia. Japan.
0 0,005 0,01 0,015 0,02 0,025 0,03 0,035 0,04 0,045 0,05
%
Food products nec Crops nec Vegetable oils and fats
Food products nec 0,0192 0,0383
Crops nec 0,0226 0,0452
Vegetable oils and fats 0,0054 0,0109
Tarif Cutting 50 % Tarif Cutting 100 %
-0,15 -0,1 -0,05 0 0,05 0,1 0,15 0,2 0,25 0,3
%
Plant-based fibers Wheat Cattle, sheep, goats, horses
Plant-based fibers -0,0529 -0,1056
Wheat 0,131 0,26
Cattle, sheep, goats, horses 0,0225 0,045
Tarif Cutting 50 % Tarif Cutting 100 %
Annex 1. Impact of Free Trade Between Indonesia and Australia on Output of the main
of Indonesia’s commodities
Annex 2. Impact of Free Trade Between Indonesia and Australia on Output of the main
0,00 0,01 0,02 0,03 0,04 0,05 0,06 0,07
%
Food products nec Crops nec Vegetable oils and fats
Food products nec 0,02 0,06
Crops nec 0,02 0,05
Vegetable oils and fats 0,01 0,05
Tarif Cutting 50 % Tarif Cutting 100 %
0,00 0,02 0,04 0,06 0,08 0,10 0,12
%
Food products nec Crops nec Vegetable oils and fats
Food products nec 0,04 0,10
Crops nec 0,04 0,09
Vegetable oils and fats 0,01 0,06
Tarif Cutting 50 % Tarif Cutting 100 %
Annex 3. Impact of Free Trade Between Indonesia and Australia on Demand of Land of Indonesia
0,00 0,01 0,01 0,02 0,02 0,03 0,03 0,04 0,04 0,05
%
Food products nec Crops nec Vegetable oils and fats
Food products nec 0,02 0,04
Crops nec 0,02 0,04
Vegetable oils and fats 0,01 0,01
Tarif Cutting 50 % Tarif Cutting 100 %